We examine the auditory perception of one feature of simulated 3D resonators: the .... sensation produced by the sound itself, and not by the sound source size.
Auditory Perception of 3D Size: Experiments with Synthetic Resonators LAURA OTTAVIANI and DAVIDE ROCCHESSO Universita` degli Studi di Verona
For representing complex data through auditory display, the ecological approach to sound perception, if combined with the most advanced techniques for physical modeling, seems to form a good strategy to translate information into sound by composition of auditory scenes and to create an object-based auditory information space. We examine the auditory perception of one feature of simulated 3D resonators: the size. In prior publications, we assessed the ability of humans to distinguish the shapes of (spherical and cubic) resonators, and we investigated pitch perception and its relationship to the volume of the enclosures. In this paper, we focus on the latter topic, introducing our most recent experiments and results. We validate previous results in a more controlled environment and, in particular, we investigate whether the specific procedure used in the auditory display may affect the users’ performance. The results of the experiment show that even the perception of a basic object property such as size can be affected by the listening procedure and can be decoupled from object shape only in controlled conditions. Categories and Subject Descriptors: H.5.2 [Information Interfaces and Presentation (e.g. HCI)]: User Interfaces; H.5.5 [Information Interfaces and Presentation (e.g. HCI)]: Sound and Music Computing General Terms: Design, Experimentation, Performance Additional Key Words and Phrases: Auditory display, auditory perception, pitch, spherical and cubic resonators, volume
1.
INTRODUCTION
The main scope of the field of auditory display is to represent and convey information by means of sound [Kramer 1994a]. To represent data of high complexity and dimensionality, sound information spaces have to be designed according to experimentally assessed rules and principles. One of the crucial challenges for the researcher is to “discover the set of truly useful auditory parameters and understand their perceptual transfer functions so that displays can be designed to take advantage of them” [Barrass 1997]. In his overview of the organizing principles to represent data with sound, Kramer emphasized the problems that designers face when developing multivariate auditory displays: “Even if sound parameters that do not directly interfere with each other are used, the fact that our attention is drawn more to certain variables than others makes the design of a balanced, or unbiased auditory display virtually impossible” [Kramer 1994b]. This pessimistic view can be somewhat counterbalanced by the observation that in our everyday listening experience we do detect different aspects of the environment by concurrent analysis of multivariable information streams [Bregman 1990] that are all combined in a single pressure signal at the entrance of the ear canal. For instance, “while walking down a city street Authors’ address: Laura Ottaviani and Davide Rocchesso, Dipartimento di Informatica, Universita` degli Studi di Verona, Strada Le Grazie, 15-37134 Verona, Italy; email: {ottaviani,rocchesso}@sci.univr.it. Permission to make digital/hard copy of part of this work for personal or classroom use is granted without fee provided that the copies are not made or distributed for profit or commercial advantage, the copyright notice, the title of publication, and its date of appear, and notice is given that copying is by permission of the ACM, Inc. To copy otherwise, to republish, to post on servers, or to redistribute to lists, requires prior specific permission and/or fee. c 2004 ACM 0000-0000/04/1000-0118 $5.00 � ACM Transactions on Applied Perceptions, Vol. 1, No. 2, October 2004, Pages 118–129.
Auditory Perception of 3D Size
•
119
we are likely to listen to the sources of sounds—the size of an approaching car, how close it is and how quickly it is approaching” [Gaver 1993]. This emphasis on sound sources and events is at the kernel of the ecological approach to sound perception, which was exploited by Gaver in the realization of auditory interfaces [Gaver 1988]. In the auditory realm, “ecological psychology studies acoustic phenomena by observing the physical characteristics of a sound event, the high-order configuration of variables, and the listener’s ability to detect the information provided by the event” [Keller 1999]. In the ecological perspective, each event is characterized by its structural invariants that specify the kind of object and its properties under change, and its transformational invariants, which specify the style of change of the object’s properties [Warren and Verbrugge 1984]. For instance, to distinguish bouncing from breaking we make use of two temporal transformational invariants (i.e., randomness and density of impacts) under certain structural invariants that, in this case, act as constraints (e.g., metal objects rarely break). From the viewpoint of the display designer, the ecological approach to sound perception, if combined with the most advanced techniques for physical modeling, seems to form a good strategy to translate information into sound by composition of auditory scenes. Assume we have a scatter plot where objects have different shape, size, and color. A na¨ıve auditory translation from the ecological standpoint may use simulations of struck resonators of different shape, size, and material. However, it is very unlikely that such translation would be effective, just because we have a poor understanding on how the physical variables shape, size, and material are perceptually combined. In order to increase such understanding, we are forced to consider nonecological perceptual variables, such as pitch or brightness, which can be studied with the tools of experimental phenomenology [Vicario 1993] and psychophysics [Purgh`e 1997; Baird and Noma 1978]. In prior publications [Rocchesso 2001; Rocchesso and Ottaviani 2001], we presented the results from some experiments about the auditory information conveyed by the shape of 3D (spherical and cubic) resonators. In particular, we assessed the ability of humans to distinguish the shapes of resonators, and specifically the relationship between pitch and resonator volume. In this paper, we present further and more conclusive experiments on this latter topic, using models of cubic and spherical resonators, in order to investigate the size of 3D objects and its perceptual interference with the object shape. Moreover, we focus on the influence that the listening procedure can have on the users’ performance. We have to stress the difference with previous works and investigations about auditory perception of shape and volume. As Cabrera [Cabrera 1999] points out, the term “volume” must not be confused. In fact, many prior studies dealt with the so-called tonal volume, meant as an attribute of auditory sensation produced by the sound itself, and not by the sound source size. According to a definition provided by Perrott et al. [1980], the term “volume” refers to the apparent size of extensity of the sound image. On the contrary, in this paper, we are interested in perception of sound pitch and its relationship with the source size, as part of the general task of ordering ecological sound events along scales. A clarification about the word “pitch” is mandatory at this point, as the impulse responses of 3D resonators are typically inharmonic and they do not produce a strong pitch sensation. However, as it emerges from the experiments presented in Section 5, listeners are capable of ordering them into scales, even though the resolution is about one order of magnitude worse than the JND of pitch perception for sine waves. Therefore, a standard definition of pitch can be applied to these sounds [Houtsma 1997]. After the description of the sound models in Section 2, and a recall, in Section 3, to the method of constant stimuli that we use in our experiments, we will give a brief summary of our prior experiments (Section 4) and we will report and analyze the most recent tests and new findings (Section 5). The results find application in auditory display and sonification, where it is useful to decouple different object properties such as size and shape in order to have object-based rather than signal-based Information Sound Spaces [Barrass 1997]. ACM Transactions on Applied Perceptions, Vol. 1, No. 2, October 2004.
120
2.
•
L. Ottaviani and D. Rocchesso
SOUND MODELS FOR SPHERICAL AND CUBIC RESONATORS
A rectangular cavity has a theoretical frequency response that is the superposition of harmonic combs, each having a fundamental frequency � c f 0,lmn = (l / X )2 + (m/Y )2 + (n/Z )2 (1) 2 where c is the speed of sound, l , m, n are a triple of positive integers with no common divisor, and X , Y, Z are the edge lengths of the box [Morse and Ingard 1968]. A spherical cavity has a theoretical frequency response that is the superposition of inharmonic combs, each having peaks at the extremal points of spherical Bessel functions. Namely, said zns the sth root of the derivative of the nth Bessel function, the resonance frequencies are found at c f ns = (2) zns 2πa where a is the radius of the sphere [Moldover et al. 1986]. In our experiments, the impulse responses of a sphere or a rectangular box have been modeled by summing the contributions of exponentially damped sinusoids, each tuned at the position of a theoretical resonance frequency. In the models, it is possible to choose the size of the resonator and the material of its enclosure among marble, wood and drape, each material being specified by frequency-dependent absorption curves. The absorption coefficient, together with volume and enclosure surface area, are used to compute the decay rate of each partial, according to the Sabine reverberation formula T = 0.163
V αA
(3)
where V is volume, A is surface area, and α is the absorption coefficient. For our experiments we chose a wood-like enclosure [Rocchesso and Ottaviani 2001], and the impulse responses have a decay time (at 40 dB attenuation) that is between 50 and 70 ms. 3.
METHOD OF CONSTANT STIMULI AND DIFFERENTIAL LIMEN ESTIMATION
The method of constant stimuli [Purgh`e 1997] is one of the classical methods in psychophysics which attempt to describe the relationship between the measurable/physical aspects of a stimulus and an observer’s perception of that stimulus. If the experiment aims at establishing the absolute limen (AL), that is, the minimum threshold for a stimulus continuum that elicits a certain perception, a constant set of stimuli are repeatedly presented in sequence to each subject. If the goal is to estimate the difference limen (DL), that is, the minimum detectable difference in a stimulus continuum, the stimuli are presented in pairs, where one is the standard stimulus. The main characteristics of this method are: the randomized presentation of the stimulus set; the use of a reduced number of stimuli, approximately at equal distance from one another on the physical continuum; the use of the appropriate stimulus set, in order to elicit both extremes in probability of the responses. In our experiment, we are interested in estimating the DL, using only two categories of responses (“higher” or “lower”). In general, the DL is half of the interval between the values of the variable stimuli judged positively 25% of the time and 75% of the time. Another important measure is the point of subjective equivalence (PSE) that is the value of the variable stimulus judged equal to the standard stimulus 50% of the time. A third important measure in the classical psychophysical methods is the ACM Transactions on Applied Perceptions, Vol. 1, No. 2, October 2004.
Auditory Perception of 3D Size
•
121
constant error (CE), which is the difference between the PSE and the point of subjective equality. It is determined by finding the algebraic difference between the PSE and the standard stimulus value. We calculated these measures by applying the method of interpolation with the least-squares regression line. The PSE is calculated with the following equation: a PSE = − (4) b where n b=
� n � i=1
n
�
�
Ri zi −
�
n �
� Ri2
��
n �
Ri
i=1
�
−
n �
i=1
n �
i=1 �2
� zi (5)
Ri
i=1
and ¯ a = z¯ − b R
(6)
in which n is the number of stimuli used, Ri are the values of the physical stimuli, and zi are the z ¯ respectively, the scores related to the probability p of positive responses. We indicate with z¯ and R, mean of the zi values and of the Ri values. The CE and the DL are calculated with the following equations: CE = PSE − St 1 DL = z 75 b
(7) (8)
where St is the value of the standard stimulus and z 75 is the z score relative to a probability of 75%. 4.
PREVIOUS EXPERIMENTS
The experiments previously reported [Rocchesso 2001; Rocchesso and Ottaviani 2001] concerned three main tasks: (i) pitch equalization of spheres and cubes; (ii) shape recognition; (iii) estimation of the sphere’s pitch. The overall aim was to find the properties and cues of 3D resonators and of the sounds they produce, in order to control them, for example, in auditory display systems. 4.1
Pitch Equalization of Spheres and Cubes
The first task of the experiments was to determine the relationship between pitch and enclosure volume. We reported good pitch equalization for sounds filtered by different shapes (cubes and spheres) enclosing the same volume. We conducted two experiments using the method of constant stimuli. In both experiments, the impulse response of a spherical resonator was used as the standard stimulus. In the first experiment, the diameter of the standard sphere was d = 36 cm. In the second experiment, the diameter of the standard sphere was d = 100 cm. The comparison sounds were the impulse responses of 13 cubes. One cube had the same volume as the standard sphere. Six were larger in volume than the standard, and six were smaller in volume than the standard. The cubes differed in size by a minimal edge length difference obtained by converting frequency JNDs into length JNDs by means of the formula � � c 1 �l = (9) − l0 2 f0 − � f ACM Transactions on Applied Perceptions, Vol. 1, No. 2, October 2004.
122
•
L. Ottaviani and D. Rocchesso
where c is the speed of sound in the enclosure, and l 0 = 2cf 0 is the reference size length. The impulse responses of the resonators were computed using methods described in Section 2. The sounds from the 13 cubes were presented, to each participant, in random order, each one preceded by the standard stimulus and repeated 10 times. From these tests, we could see that listeners equalized the pitches of cavities � having � the same volume. From the frequencies of partials f i , the spectral centroid—proportional to i ifi / i f i —was computed for each stimulus. This number gives an indication about where most of the energy is found on the frequency axis, and it is usually considered a good correlate of perceived brightness. Since measurements of the spectral centroid indicated that the sphere was systematically brighter than the cube, we claim that brightness does not play a role in pitch equalization. 4.2
Shape Recognition
The second task of the experiments concerned the recognition of 3D shape by hearing a snare drum sound filtered by the resonators. We chose that type of sound because it could excite a large part of the frequency response while keeping its identity when filtered. We used five spheres with the following diameters: 100, 90, 70, 50, 30 cm, and the corresponding volume-matching cubes, all in random order and repeated 10 times. The participants attended a training phase, listening to the snare drum pattern filtered by shapes with three different sizes, and different from the ones used during the experiment. The aim of the training was to let the listener only acquire the “method” to distinguish the enclosing shapes, and not to learn that particular sound. After training, the average listener was able to recognize the shape of the enclosure where a sound comes from if the cavity is larger than 50 cm. Otherwise, for smaller cavities, responses converge to random choice. 4.3
Estimation of the Sphere’s Pitch
We performed the third task to estimate the sphere’s pitch by comparing the impulse response of the spherical resonator to an exponentially damped sinusoid, using an up–down staircase procedure [Levitt 1970]. We decided to use the spherical enclosure, because the participants in the pitch equalization experiments reported a stronger pitch effect for the sphere, as compared to the cubes. One fourth of the participants estimated the pitch close to the lowest partial and another one fourth estimated the pitch in the second partial neighborhood. However, the subjects found this task difficult, probably due to the different identity of the stimuli used in the test. Nevertheless, it seems that when comparing the frequency response of a resonator with a damped sinusoid, listeners apply an analytic listening mode, that is, the ability to hear a component in a mixture [Terhardt 1974]. On the other hand, the experiments of Section 4.1 indicate that, when the standard sound is another complex 3D response, pitch is attributed using a more holistic (or synthetic) listening mode, that is, the ability to hear properties of a mixture, leading to the perception of a single complex sound object [Terhardt 1974].
5.
NEW EXPERIMENTS ON PITCH PERCEPTION RELATED TO VOLUME ESTIMATION
We have conducted a new set of experiments on pitch comparison between impulse responses of spherical and cubic resonators. The aim was twofold: (i) validating previous results in a more controlled environment, and (ii) investigating the effects of the particular procedure used. ACM Transactions on Applied Perceptions, Vol. 1, No. 2, October 2004.
Auditory Perception of 3D Size
•
123
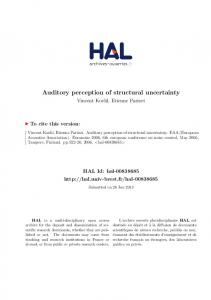
Fig. 1. Low-frequency spectra of the responses of a spherical resonator (d = 36 cm; solid line) and a cube having the same volume (dashed line).
5.1
Participants
The subjects were 15 volunteers (8 females and 7 males), with age ranging between 21 and 39, all students or faculty members of the University of Verona. Thirteen subjects were na¨ıve listeners. Two listeners were somewhat trained, as they participated to the previous experiment as well. All of the participants reported having normal hearing. 5.2
Stimuli
We used the same stimuli as in the previous experiment on pitch equalization, that is, the impulse response of a spherical resonator with diameter equal to 36 cm and the impulse responses of 13 cubes, one of which with the same volume as the sphere. The length differences for the size of the other 12 cubes were calculated by equation (9), with the central one equal in volume to the sphere. In Figure 1, we plot the frequency responses, limited to the low-frequency range, of a spherical resonator with diameter equal to 36 cm and a cube with the same volume. The apparent lack of a harmonic or quasi-harmonic spectral template [Hartmann 1998] that could match most peaks of either spectrum make us think that the stimuli do not elicit a unique and salient pitch. In particular, although the low-frequency peaks of the response of the spherical resonator seem to be regularly spaced, they are not multiples of a common fundamental. Nevertheless, listeners were able to make pitch comparisons between responses both within and between shapes. A closer analysis of the stimuli using the auditory correlogram was presented by the authors in Rocchesso and Fontana [2003, pp. 103–105]. Similar to what was observed by Roberts and Brunstrom [2001], we hypothesized that the spines visible in the ACM Transactions on Applied Perceptions, Vol. 1, No. 2, October 2004.
124
•
L. Ottaviani and D. Rocchesso
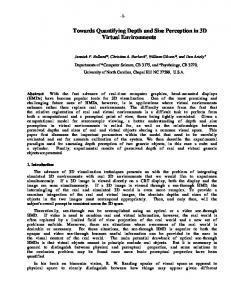
Fig. 2. Responses probability as a function of the cubes volume in the fixed sounds order presentation. Standard deviation bars are shown.
correlogram act as a shape signature that can be processed even if the summary correlogram does not exhibit sharp peaks (i.e., indicators of salient pitch). 5.3
Procedure
The participants performed the test in a quiet, but not acoustically isolated listening environment. The test was conducted with the method of constant stimuli. We presented the sounds pairwise from the cubes and the standard stimulus from the sphere. All the pairs were presented four times in random order. In order to balance the results, we decided to present the sounds with the same order within the pairs. Half of the participants were presented the sphere in the first position and the other half were presented the sphere in the second position. In addition to this balancing issue, this experiment presents another difference from the one reported in Rocchesso [2001]: We reduced the number of repeated trials because from the previous test we saw that four repetitions would have been enough to capture a general trend. The subjects were told that the first or the second sound in the pair—depending on the subject— had the same pitch during the whole test. After having listened to the pair of sounds twice, they were asked to evaluate which sound was higher in pitch. The test was conducted by means of a MATLAB environment on a PC Pentium III, with a Creative SoundBlaster Live! soundcard and the stimuli were presented to the listeners over closed headphones (Beyerdynamic DT 770). 5.4
Results and Observations
In Figure 2, we report the probability of the answer “the spherical impulse response has a higher pitch than the cubic impulse response” as a function of the cubes volume. The standard deviation bars measure how the answers are dispersed. From these data, we have calculated the PSE (0.0237 m3 ), the CE (−0.0006), and the DL (−0.0027) (χ 2 = 10.6439, df = 10, p > 0.3) using methods described in Section 3. The PSE resulted to be relatively close to the volume of the reference sphere (diameter d = 36 cm, volume = 0.0244 m3 ). The data included two outliers: a participant who admitted to have had a big ACM Transactions on Applied Perceptions, Vol. 1, No. 2, October 2004.
Auditory Perception of 3D Size
•
125
difficulty in judging some couples and to have answered by chance to some of them, and a na¨ıve listener who was influenced by the variation, besides pitch, of another parameter in the two sounds, that she was not able to define but the examiner can identify with the brightness. From the data without outliers, we have calculated the PSE (0.0241 m3 ), the CE (−0.0003), and the DL (−0.0024) (χ 2 = 7.6322, df = 10, p > 0.6). The PSE indicates the size of the cube judged by the subjects to have the impulse response with the same pitch as the reference sphere (d = 36 cm). The PSE computed without outliers is closer to the volume of the reference sphere. We can see that the pitch equalization is achieved with equal-volume cavities, and the match is especially accurate after removal of the two outliers. The DL in volume can be translated into a difference in length and, by means of equation (9), into a difference in frequency. Both the length and frequency limens obtained in this way are about 3.5% of the spatial extension and lowest partial frequency, respectively. As a comparison, in the frequency neighborhood of 600 Hz, the frequency limen of pure tones that are about as long as our impulse responses (about 60 ms for 40 dB attenuation) is one order of magnitude lower (see, e.g., Moore [2003, pp. 197–204] for a review on frequency discrimination). On the other hand, the length limen obtained by our auditory comparison task is close to the Weber fraction commonly found for visual length discrimination (0.04, as reported in Baird and Noma [1978, p. 44]). 5.5
Order Effect
Besides validating the previous results by repeating the experiment in a more controlled environment, within this research activity we investigated whether the presentation of the stimuli could affect the listeners’ performance and, therefore, if the results were dependent on the experiment procedure. We studied these topics in a pilot experiment conducted during the arrangements for the reported test. Seventeen subjects (5 female, 12 male) with age ranging from 20 to 55 years participated in this pilot experiment. All subjects were either students or employees at the University of Verona—the authors participated to this pilot experiment—and reported having normal hearing. Two subjects—one of the authors and another participant—were expert listeners. In this pilot experiment, we used another technique for balancing the response result. Half of the trials contained the standard stimulus (resulting from the spherically shaped resonator) in the first position, and half of the trials contained the standard stimulus in the second position. Trials were presented in randomized order. Using this presentation method, we observed that many subjects seemed to confuse the standard stimulus with the comparison stimuli. From Figure 3, it appears that the probability of responses “sphere is higher” never crosses the horizontal line corresponding to 50% of the responses. It remains above it. Because the estimated PSE is out of the range of the examined cube sizes (PSE = 0.0196 m3 ) (χ 2 = 16.0675, df = 10, p > 0.05), we conclude that there is no pitch equalization in this range of enclosure volumes. To understand this fact, it is convenient also to report the individual performances of two subjects. In Figure 4, we display individual performances with a representation consisting of two rows, each one for a different response (lower or higher) and 13 columns, one for each cube. We display the number of responses for each cube in a grey scale, within a range between black—the minimum, and white—the maximum. Therefore, the maximum level of uncertainty would correspond to the middle grey in both rows. This representation is redundant, because one row is the negative of the other, but it gives a clear view of the equalization point, because the maximum uncertainty can be found only by looking for the column with the same hue in both the rows, instead of looking for a particular hue. The two subjects whose performances are reported in Figure 4 repeated the test in both conditions, that is, with the sound positions inverted in half trials, and with the sound positions fixed during the whole experiment. In this second modality, the sphere was always presented in first position to subject no. 1 (Figure 4(a)), and always in second position to subject no. 2 (Figure 4(b)). ACM Transactions on Applied Perceptions, Vol. 1, No. 2, October 2004.
126
•
L. Ottaviani and D. Rocchesso
Fig. 3. Responses probability as a function of the cubes volume in the randomized sounds order presentation. Standard deviation bars are shown.
Fig. 4. Individual performances of subjects no. 1 (a) and no. 2 (b) in the two different test conditions.
We can observe a different approach of the two subjects to the listening task. Subject no. 1, in the fixedorder position case, has a strong pitch equalization perception and he estimates it corresponding to the central cube, which has equal volume to the sphere, while, in the situation of randomized presentation, it is clear that he gets confused and cannot give any judgment, showing substantial uncertainty for most pairs he listened to. On the contrary, subject no. 2, in the randomized presentation condition, shows a strong perception that the sphere’s impulse response is higher in pitch than any cube response. ACM Transactions on Applied Perceptions, Vol. 1, No. 2, October 2004.
Auditory Perception of 3D Size
•
127
Conversely, in the fixed-order position case, he is able to hear, even if not as strongly as subject no. 1, a pitch equalization corresponding to the central cube. Most participants in both experimental conditions mentioned to the examiner that the task in the fixed-order case was easier than in the random-order case. Only one participant, a na¨ıve listener, that we consider one of the outliers, showed difficulties in both conditions, and we suspect that she was influenced by variations in brightness. Indeed, it seems that brightness works as an anchor for listening in the randomized-order case. Even if brightness seemed not to affect the listeners performance during the test with fixed-order position, it seems to be involved in the randomized-order case. We already pointed out in Section 4.1 that the sphere is brighter than all the cubes considered, because its surface area is smaller than the surface area of all the cubes so that the absorption coefficient has lower effect. The results of this pilot experiment highlight that, due to the connection between shape and brightness, objects of different size can be sorted across different shapes only in controlled listening conditions, namely when the presentation order is kept fixed. In Section 4.3, we concluded that listeners apply either an analytic or holistic listening mode [Terhardt 1974] whether the standard sound is a simple or a complex tone. Keeping a complex response as standard sound, but randomizing the presentation order entails, on the other hand, a change in the listening attitude, which could be due to the lack of a “reference point,” and the consequent changing of focus of attention. 6.
CONCLUSIONS
Recently, much research has been devoted to devise efficient and accurate algorithms for simulating the resonating properties of objects for audio-visual animation [van den Doel et al. 2001]. Sometimes, the same computational machinery is used to produce both graphics and sound [O’Brien et al. 2001], for the sake of more realistic audio-visual experiences. The benefit is especially evident when a user interacts with the objects [Rocchesso and Fontana 2003], and proper synchronization and coherence of audio-visual events certainly increases the sense of presence. The benefits of accurate physical modeling of resonators are far less obvious when the purpose is information display. For instance, physical modeling can be useful for auditory display because it allows us to change the values of parameters and variables, and the consequent perceptual properties, according to the user actions or the information requirements [Hermann and Ritter 1999]. In any case, as shown in this paper, a designer has to remember that the auditory perception of a physical property, in certain cases, can be strictly dependent on the listening conditions. Even a basic object property such as size can be differently perceived and can be decoupled from object shape only in a controlled setting. In particular, these experiments confirmed that, under certain conditions, cubic and spherical enclosures of the same volume are identified by listeners to have equal pitch. From these experiments we can deduce that a “static reference point,” that is, the order position of the sound, is important to help a listener, either a trained or a na¨ıve one, to perform a pitch comparison task. Even if a small number of subjects showed difficulties in the pitch equalization task in both conditions, the performance gap between the two conditions seems to be due only to a change of listening attitude related to the order of presentation of the stimuli. However, this has implications in auditory display and sonification, because the ordering of 3D impulse responses of different shapes along pitch scales is not as simple as it may first appear. Shape and size are both spatial attributes of 3D objects and, as such, they are “indispensable attributes” for visual perception [Kubovy and Van Valkenburg 2001]. When 3D objects are used as resonators, their shape and size features are translated into frequency distributions of spectral peaks and, as such, they affect the “indispensable attributes” of auditory perception [Van Valkenburg and Kubovy ACM Transactions on Applied Perceptions, Vol. 1, No. 2, October 2004.
128
•
L. Ottaviani and D. Rocchesso
2003]. However, the experiments here presented have shown that disentangling the shape and size properties of resonators via auditory evaluation of their frequency content is difficult or may require substantial training [Wright and Fitzgerald 2003]. Conversely, shape and size manifest and distinguish themselves much more sharply through dynamic interactions. For instance, the auditory perception of a ball exists as long as it bounces, and the perceptual attributes of bouncing have nothing to do with the resonating properties of spherical cavities. It is rather the irregularity in bouncing that perceptually reflects shape features [Rocchesso et al. 2003]. Further research has to be devoted to study the perception of object properties through temporal features. This kind of research will eventually lead to ecologically valid, physics-based auditory displays. ACKNOWLEDGMENTS
This work was supported by the European Commission’s Future & Emergent Technologies collaborative R&D program under contract IST-2000-25287 (“SOb - the Sounding Object”: http://www.soundobject. org). We are grateful to professor Giovanni Bruno Vicario and his co-workers from the University of Udine, for their valuable comments. We are also grateful to the volunteers who participated to the experiments. Special thanks go to Pavel Zahorik and the anonymous reviewers for their well-grounded criticism on earlier versions of the manuscript. REFERENCES BAIRD, J. C. AND NOMA, E. 1978. Fundamentals of Scaling and Psychophysics. Wiley, New York. BARRASS, S. 1997. Auditory Information Design. Ph.D. Thesis, Australian National University. BREGMAN, A. 1990. Auditory Scene Analysis. MIT press, Cambridge, MA. CABRERA, D. 1999. The size of sound: Auditory volume reassessed. MikroPolyphonie 5. Online journal. Available at http:// www.mikropol.net/volume5/cabrera d/Volume.html. GAVER, W. W. 1988. Everyday Listening and Auditory ICONS. Ph.D. Thesis, University of California, San Diego. GAVER, W. W. 1993. What in the world do we hear? An ecological approach to auditory event perception. Ecol. Psychol. 5, 1, 1–29. HARTMANN, W. M. 1998. Signals, Sound, and Sensation. Springer-Verlag, New York. HERMANN, T. AND RITTER, H. 1999. Listen to your data: Model-based sonification for data analysis. In Advances in Intelligent Computing and Multimedia Systems, G. Lasker, Ed. International Institute for Advanced Studies in System Research and Cybernetics, Baden-Baden, Germany, 189–194. HOUTSMA, A. 1997. Pitch and timbre: Definition, meaning and use. J. New Music Res. 26, 2, 104–115. KELLER, D. 1999. touch’n’go: Ecological Models in Composition. Master of Arts Thesis, Simon Fraser University. Burnaby, BC. Available at http://www.sfu.ca/sonic-studio/srs/EcoModelsComposition/Title.html. KRAMER, G. 1994a. An introduction to auditory display. In Auditory Display: Sonification, Audification and Auditory Interfaces, SFI Studies in the Sciences of Complexity, Proceedings Volume XVIII, G. Kramer, Ed. Addison-Wesley, Reading, MA, 1– 77. KRAMER, G. 1994b. Some organizing principles for representing data with sound. In Auditory Display: Sonification, Audification and Auditory Interfaces, SFI Studies in the Sciences of Complexity, Proceedings Volume XVIII, G. Kramer, Ed. Addison-Wesley, Reading, MA, 185–221. KUBOVY, M. AND VAN VALKENBURG, D. 2001. Auditory and visual objects. Cognition 80, 97–126. LEVITT, H. 1970. Transformed up–down methods in psychoacoustics. J. Acoust. Soc. Am. 49, 2, 467–477. MOLDOVER, M., MEHL, J., AND GREENSPAN, M. 1986. Gas-filled spherical resonators: Theory and experiment. J. Acoust. Soc. Am. 79, 2, 253–272. MOORE, B. C. 2003. An Introduction to the Psychology of Hearing. Academic Press, London, UK. MORSE, P. AND INGARD, K. 1968. Theoretical Acoustics. McGraw-Hill, New York. O’BRIEN, J., COOK, P., AND ESSL, G. 2001. Synthesizing sounds from physically based motion. In Proceedings of the ACM SIGGRAPH, Los Angeles, CA, 529–536. PERROTT, D., MUSICANT, A., AND SCHWETHELM, B. 1980. The expanding image effect: The concept of tonal volume revisited. J. Aud. Res. 20, 43–55. ACM Transactions on Applied Perceptions, Vol. 1, No. 2, October 2004.
Auditory Perception of 3D Size
•
129
PURGHE` , F. 1997. Metodi di Psicofisica e di Scaling Unidimensionale. Bollati Boringhieri, Torino, Italy. ROBERTS, B. AND BRUNSTROM, J. M. 2001. Perceptual fusion and fragmentation of complex tones made inharmonic by applying different degrees of frequency shift and spectral stretch. J. Acoust. Soc. Am. 110, 5 (Nov.), 2479–2490. ROCCHESSO, D. 2001. Acoustic cues for 3-D shape information. In Proceedings of the International Conference on Auditory Display—ICAD 2001. Espoo, Finland, 175–180. Available at http://www.acoustics.hut.fi/icad2001/. ¨ , M. 2003. Sounding objects. IEEE Multimedia 10, 2, 42–52. ROCCHESSO, D., BRESIN, R., AND FERNSTROM ROCCHESSO, D. AND FONTANA, F., EDS. 2003. The Sounding Object. Mondo Estremo, Firenze, Italy. Freely distributed under the GNU Free Documentation License. Available at http://www.soundobject.org/SObBook/. ROCCHESSO, D. AND OTTAVIANI, L. 2001. Can one hear the volume of a shape? In Proceedings of the IEEE Workshop on Applications of Signal Processing to Audio and Acoustics, Mohonk, NY, 115–118. Available at http://www.soundobject.org/articles.html. TERHARDT, E. 1974. Pitch, consonance, and harmony. J. Acoust. Soc. Am. 55, 5 (May), 1061–1069. VAN DEN DOEL, K., KRY, P. G., AND PAI, D. K. 2001. FoleyAutomatic: Physically-based sound effects for interactive simulation and animation. In Proceedings of the ACM SIGGRAPH, Los Angeles, CA, 537–544. VAN VALKENBURG, D. AND KUBOVY, M. 2003. In defense of the theory of indispensable attributes. Cognition 87, 225–233. VICARIO, G. 1993. On experimental phenomenology. In Foundations of Perceptual Theory, S. Masin, ed. North-Holland, Amsterdam, The Netherlands, 197–219. WARREN, W. H. AND VERBRUGGE, R. R. 1984. Auditory perception of breaking and bouncing events: A case study in ecological acoustics. J. Exp. Psychol. Hum. Percept. Perform. 10, 5, 704–712. Sound discrimination learning and auditory displays. In Proceedings of the WRIGHT, B. A. AND FITZGERALD, M. B. 2003. International Conference on Auditory Display—ICAD 2003, Boston, MA, 228–232. Available at http://www.icad.org/ websiteV2.0/Conferences/ICAD2003/index.html.
Received September 2003; revised January 2004, April 2004, May 2004, June 2004; accepted June 2004
ACM Transactions on Applied Perceptions, Vol. 1, No. 2, October 2004.