appliance/gadget by augmenting repair information on to the camera feed and displaying it on a PC/laptop/tablet screen. By using this application even a person ...
IJCSI International Journal of Computer Science Issues, Vol. 9, Issue 4, No 3, July 2012 ISSN (Online): 1694-0814 www.IJCSI.org
333
Augmented Reality Repair Guidance System Sidharth Bhatia, P. Vijayakumar Department of Electronics and Communication Engineering, SRM University Kattankulathur, Chennai, Tamil Nadu- 603203, India
Abstract The daily life of a common man revolves around various forms of appliances/gadgets he uses throughout the day such as a mobile phone, laptop, printer, microwave oven, washing machine, etc. Although these appliances/gadgets are taken by most of the people for granted, the problem occurs when any of these things do not work as they are expected to. Getting them to the repair shops for every small glitch is expensive as well as time consuming. Although most of the companies which produce these appliances/gadgets do supply them with basic manuals, which deal with how to solve these minor issues, but reading them and at the same time repairing the corresponding appliance/gadget can be a frustrating task at times. These problems can be reduced to a large extent if some kind of live guidance is available. In this paper we propose a method to do so with the help of an augmented reality based system that will guide the user to carry out small scale repair jobs on these gadgets. All that is required is a decent webcam and a computing device, with a processor of 1 GHz or more and a display screen.
Keywords: Augmented Reality, Guidance System, Appliance Repair.
1. Introduction The field of augmented reality has grown by leaps and bounds during the past decade. In our daily lives we can see augmented reality at work in sports where cricket or rugby pitches show sponsor advertisements. BMW, Corvette and GM use augmented reality HUDs (Heads-Up Displays) in their cars; mostly for meter and traffic information. a similar kind of application is used for fighter jets for displaying in flight and combat information. In this paper an augmented reality based application is discussed which can guide the user, to repair any appliance/gadget, by overlaying computer generated graphical information on the input taken by a webcam. To make the repair instructions easy to understand the user also gets audio instructions corresponding to the graphical information simultaneously. As a proof of concept we have applied our method to help the user change the SIM card of NOKIA 1600 mobile phone. The whole paper is divided into 7 sections. The second section briefly discusses the work done previously in this domain and our contributions to it. The third section sheds light on our method with the
help of flow charts. There the various algorithms that have been used in our method are discussed briefly and also how and where they fit in the whole scheme of things. The fourth section describes the experimental results that have been achieved and the performance characteristics of our method. In the fifth section there is a comparison between the performance of our method and that of the existing ones. The sixth section talks about the limitations of this method and thoughts about how they may be tackled. In the seventh section our future goals regarding this method are discussed. The last section concludes the paper.
2. Related Work and Our Contributions A notable work in the field of augmented reality is ‘SixthSense’ by Pranav Mistri [1]. This system, like our own system, comprises of a camera and a computing device that processes this information. But instead of a display screen it has a projector. The system is used for interactions between user and the computer to get information via gestures and coloured bands on the user’s fingers. Some other applications such as ‘Layar’ and ‘Wikitude’, which basically augment information about the surroundings onto the view of the camera of the smartphone, have also been developed for smartphones. Another work worth mentioning is that of Juan et al. in [2]. This is one of the first AR applications aimed at treating psychological disorders. This AR system works with the help of a transparent HMD (Head Mounted Display). The system when ‘ON’ makes the user to see cockroaches all around and over him/her and thus a treatment is carried out accordingly. Another application in the field of defence is discussed in [3]. This helps mechanics perform routine maintenance tasks inside an armoured vehicle turret. In [4] an application in the medical field is discussed. In this paper the authors claim to have made an augmented reality system in which heart beat’s evaluation and visualization is done. The system collects cardiologic data in various circumstances, for example while the person using the system is running, playing, sleeping, etc. The system then processes it and displays it in an augmented reality environment in a meaningful form so that even the people
Copyright (c) 2012 International Journal of Computer Science Issues. All Rights Reserved.
IJCSI International Journal of Computer Science Issues, Vol. 9, Issue 4, No 3, July 2012 ISSN (Online): 1694-0814 www.IJCSI.org
334
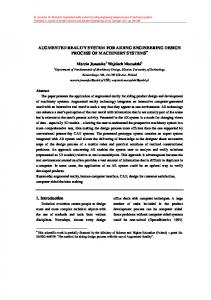
who do not have much knowledge about the heart can make sense from the data presented and take precautionary measures to avoid any heart problems. The work by Kazuyo Iwamoto et al. in [5] discusses an augmented reality system, which uses a monocular video see-through HMD to present instructions on to a work object, for performing an experiment in which the user does line heating for plate bending. The system augments a straight line, on to a plate, which the user has to follow while he is performing heating to bend the plate effectively. Our contribution to this growing world of augmented reality applications is a system that helps the user repair an appliance/gadget by augmenting repair information on to the camera feed and displaying it on a PC/laptop/tablet screen. By using this application even a person who has no technical know-how about how the specific appliance/gadget works can easily perform small scale repairs on his appliance/gadget. As said above we demonstrate our concept by performing the task of changing the SIM card of a NOKIA 1600 mobile phone. An example of how the system gives input the user is shown in Fig. 1.
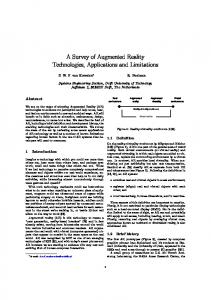
3. Tables, Figures and Equations In this section the work flow of our method is discussed which relies heavily on two independent works of Satoshi Suzuki et al. and John Canny described in [6] and [7] respectively. The constituent frames of the video feed from the camera are of size 320x240 and have 8-bit RGB colour format. The flow diagram of the overall system is shown in Fig. 2. The whole system has mainly two phases, Detection and Tracking.
Fig. 2 The overall work flow of our method.
The detection phase is responsible for finding the object as a whole within the camera frame. The tracking phase has more functions than the detection phase. First of them is to find the individual parts within the object boundary and follow them in the subsequent frames or if they are already found in the detection phase then track them. The second and a very important function is to generate and augment the computer generated guidance information on to the frame and display it in the output window. The whole system consists of different stages which execute one after another after the previous stage is finished and the user has requested for the next stage directions. Each stage has its own detection and tracking phases and therefore is independently responsible for guiding the user to perform a specific task on the phone. There are in all 5 stages in the case of our application on changing the SIM card of a Nokia 1600 mobile phone. They are summarised in Fig. 3.
Fig. 1 An example of the output by our method.
Fig. 3 Stages in overall working of the system
Copyright (c) 2012 International Journal of Computer Science Issues. All Rights Reserved.
IJCSI International Journal of Computer Science Issues, Vol. 9, Issue 4, No 3, July 2012 ISSN (Online): 1694-0814 www.IJCSI.org
335
3.1 Detection Phase The detection phase, as already discussed is only responsible for detecting the object as a whole within the given frame and finding the bounding rectangle coordinates for it. The functioning of the detection phase is very similar but not same for every stage. We discuss the first stage detection in detail. The whole process is described by the help of two continuous flow charts shown in Fig. 4 and Fig. 5. To find the edges using the canny edge detection method mentioned in [7], we must have a gray scale image to operate on. We get the image by applying the following equation on every pixel. Y = 0.299*R + 0.587*G + 0.114*B
(1)
In the above equation Y is the gray scale value of the pixel we have got for the corresponding Red (R), Green (G) and Blue (B) components of the pixel in question. After getting the gray scale image we apply the procedure mentioned in [7] to get the binary image of the original colour frame consisting of the edges. The method consists of 4 steps. These steps are Pre-processing, Calculating the gradient, Non-Maximum suppression and thresholding with hysteresis. During the hysteresis thresholding stage the upper threshold is kept at 0 and the lower threshold at 150. By following this procedure we get a binary image consisting of the ‘strong’ boundaries, which is what we require. A sample output achieved from this procedure is shown in Fig. 6. Here the upper image is the source image and the lower image is the binary image found after applying canny edge detection method. After we have got the binary image consisting of the edges the next step is to find the contours in that binary image by using the method described in [6]. This method does the topological analysis of the binary image we have obtained. The method consists of two algorithms which in effect calculate the inner and outer contours of the objects inside the binary image. An example can be seen in Fig. 7. In this figure we can see two distinct colours in the resultant image on the right. The Red colour signifies the outer contours which as is described in [6] “not surrounded by holes”. The Blue coloured areas are inner contours. Each contour is saved as a sequence of connected points, where each point contains the value of its corresponding pixel coordinates. After getting the contours sequence we need to search this sequence for a correspondence to the approximate shape of our object, in this case being a quadrilateral. To do this the Douglas-Peucker algorithm mentioned in [11] is used. The algorithm finds similar curves with fewer points. At first the algorithm defines a threshold distance E>0 to be used as a guideline for deciding on which point to keep and which point to discard. Initially all the points are considered and only the first and the last points in the sequence of points for a particular contour are kept.
Fig. 4 Detection phase flow diagram (Part I).
Copyright (c) 2012 International Journal of Computer Science Issues. All Rights Reserved.
IJCSI International Journal of Computer Science Issues, Vol. 9, Issue 4, No 3, July 2012 ISSN (Online): 1694-0814 www.IJCSI.org
336
After assuming that the first and the last points form a line segment the algorithm finds the farthest point from it. If the
Saved Children quadrilaterals
Find a quadrilateral of a specified area at each end of the parent
A1
NO
Do Such Quadrilaterals exist?
Fig. 7 Internal and external contours.
Frame copy stored
NO YES
Are the colour specifications satisfied?
YES Calculate coordinates for an Upright Bounding Rectangle around the Mobile Phone
distance of the point from the line segment is less that E then that point and all the points within that distance are discarded. If the distance is more than or equal to E then the point is kept. The newfound point is then taken as one end of a new line segment and the last point of the previous line segment is retained as the last point. The same procedure is again applied and a new point is again found. This procedure continues until there are no more points to keep between the two points of a line segment. In the end an approximated curve is obtained for each contour. The whole process is shown in Fig. 8.
Coordinates saved
Raise the Detection Flag
Detection Phase Ends
Fig. 8 Douglas-Peucker algorithm. Fig. 5 Detection phase flow diagram (Part II).
To check whether the curve found is a quadrilateral or not two conditions can be checked for. First being that the curve obtained is a closed loop and the second being that the closed loop has four corner points. The resultant quadrilaterals from this method are shown in Fig. 9.
Fig. 6 Sample output of edge detection
Fig. 9 Quadrilaterals found from the contours.
The coordinates of the vertices of the quadrilaterals and the contours from which they were derived are saved. The
Copyright (c) 2012 International Journal of Computer Science Issues. All Rights Reserved.
IJCSI International Journal of Computer Science Issues, Vol. 9, Issue 4, No 3, July 2012 ISSN (Online): 1694-0814 www.IJCSI.org
next step is to check which quadrilateral signifies the outer boundary of the phone. We start from the quadrilateral with the largest area. The required quadrilateral should have two quadrilaterals within its boundaries as shown in Fig. 9. The next step is to check whether these internal quadrilaterals have the required area proportionalities satisfying the criteria. In the case of our mobile phone the criteria is that there should be two quadrilaterals within the outer quadrilateral out of which one has an area A1 with an area specified in (2) and the other has an area A2 specified in (3). The area of the outer quadrilateral is assumed to be A. 0.25(A) ≤ A1 ≤ 0.40(A)
(2)
0 ≤ A2 ≤ 0.05(A)
(3)
If the above given conditions are met then the two internal quadrilaterals are checked for their positions within the outer quadrilateral. If the outer quadrilateral is divided into two parts equally along its height then the quadrilateral with the area A1 should be present within one half and the quadrilateral with the area A2 should be present within the other half and the centres of gravity of both should be apart by a distance D. The value of D should be within the range specified in (4). 0.7(A) ≤ D ≤ 0.9(A)
337
(7)
If H < 0 then we make H positive by using (8).
(8)
Fig. 10 Filled outer quadrilateral.
(4)
If the above criterion is met then we check the interested region signified by the outer quadrilateral for the required colour information. To do this we perform ‘AND’ operation on the original colour image and the image obtained after filling the area under the quadrilateral by white pixels on a black background. This filled quadrilateral is shown in Fig. 10. The result which we get after the ‘And’ operation is an image which has only the region which is within the outer quadrilateral in the original colour image. The rest is black. This technique can be called as a kind of ‘background subtraction’ technique. The result which we get after the ‘AND’ operation is shown in fig. 11. The image obtained from the above steps is now checked for colour composition. This is done by colour thresholding the image. The image is first transformed from RGB colour space to HSV colour space. To do this, for every pixel the integer values of R, G and B components are converted to floating point format and scaled to fit the range of 0 to 1, from (5) to (8).
z
Fig. 11 Result obtained after the ‘AND’ operation.
The obtained values of H, S and V are then converted to the range of 0 to 255 by using (9), (10) and (11).
Copyright (c) 2012 International Journal of Computer Science Issues. All Rights Reserved.
IJCSI International Journal of Computer Science Issues, Vol. 9, Issue 4, No 3, July 2012 ISSN (Online): 1694-0814 www.IJCSI.org
After obtaining an HSV image individual pixels can be simply checked in each region of the object for the range of H component required. All the pixels that correspond to this range of H are made white and the others are made black. To know about how well the colours of the object match those which are required we can just count the white pixels in a specific region of the image and check for the ratio between the area of that region and the number of white pixels within it. If the range of H is fulfilled then the outer quadrilateral which was obtained, as shown in Fig. 9, is confirmed as the boundary of the object. An upright bounding rectangle for the object is calculated and the detection flag is raised.
3.2 Tracking Phase The functioning of the tracking phase, as in the detection phase, varies according to the stage which is active at the time. We will discuss about the first stage in detail. The rest of the stages utilize the same basic method as in the first stage. When the first stage of tracking is entered the results obtained from the detection phase are the coordinates of an upright bounding box around the mobile phone/object, the coordinates of the quadrilaterals inside the boundary of the object and their approximate positions inside the outer quadrilateral, which signifies the object boundary. In this step the boundaries of the battery cover are found and drawn. Also we need to generate guidance information which tells the user how to remove the battery cover. Since the colour of the battery cover is knon , i.e. black we can threshold the image obtained in Fig.11 for black pixels. After thresholding a binary image is obtained. It might be possible that some of the pixels that appear grey might also come in the range of colour value that we threshold. So to remove these kinds of pixels and obtain the outline of the rectangular battery cover some operations are performed on the obtained binary image. At first the quadrilateral with the area A1 as mentioned in (2) is expanded along the lines, from the centre of gravity to each vertex, in a direction away from the COG (centre of gravity). The expansion along each vertex n is done by an amount Xn calculated by (12). Xn = 0.20(Distance(Vn G) )
(12)
Where Distance (VnG) is the distance between the vertex n (n ranges from 1 to 4) and the COG. After the expansion the coordinates of the vertices of the expanded quadrilateral are obtained. A quadrilateral is drawn filled with black pixels, with the new vertices, on the binary image. The result obtained is shown in Fig. 12. Contours are then detected in this image using the technique we used before in this paper and as described in [6]. After obtaining the contours we estimate the quadrilaterals with the technique used before in this paper and as mentioned
338
in [11]. At most two contours are obtained. The smaller one is discarded and the larger quadrilateral is kept. This quadrilateral is named Q1. To show the directions on how to remove the cover from the mobile phone a rotated rectangle needs to be estimated from the coordinates of Q1. To do this some operations are performed on these coordinates. The lengths of the two diagonals of Q1 are calculated and the larger diagonal is kept. The end points of this diagonal are marked as P1 and P2. Then, out of the points of Q1except P1 and P2, the point farthest from the diagonal is found out. This point is marked as P3 and is connected to P1 and P2. The length from P1 to P3 is marked as L1 and from P2 to P3 as L2. Then a line segment is drawn from P1 at an angle of 45 degrees to the diagonal. The length of this line segment is kept equal to L2. The end point of this line segment is named P4. In the end P4 and P2 are joined. The steps are shown in Fig. 13.
Fig. 12 Resultant thresholded binary image.
After getting the rotated rectangle it is drawn on the original colour frame and its COG is drawn. To display the directional arrow its position and size must be aligned according to the rotation, size and COG of the rotated rectangle obtained. For this purpose a template is taken which is resized and aligned with the parameters of the rotated rectangle mentioned above. The template is shown in Fig. 14. The template is of size 100X100. Its COG is then calculated. The template is then placed on the original colour frame such that the COG of the template lies exactly on top of the COG of the rotated rectangle calculated above. During this step the direction, in which the arrow should point, has to be kept in mind. For example in this case the point of the arrow will be in the direction of the smaller quadrilateral found in the detection
Copyright (c) 2012 International Journal of Computer Science Issues. All Rights Reserved.
IJCSI International Journal of Computer Science Issues, Vol. 9, Issue 4, No 3, July 2012 ISSN (Online): 1694-0814 www.IJCSI.org
phase with the area A2. The rotation of the template depends on the position of its vertices on the diagonals of the rotated rectangle. To determine the position of the vertices the size of the rectangular area, in which to display the template, is required. The area of this rectangular region should be 80% of the area of the rotated rectangle. Let the rotated rectangle have a length LR and a breadth BR. Let the length and breadth of the required rectangular region is LN and BN respectively.
339
WN = 0.80(WR)
(14)
The next step is to calculate the diagonal lengths of this newly calculated rectangle. Let the diagonal lengths be DN1 and DN2. The coordinates of the rectangular region will be the points PN1, PN2, PN3 and PN4 as shown in Fig. 15. After these points are obtained a 2-D rotation is done by the method mentioned in [12]. The main formula for performing the rotation is given in (15). (15)
Fig. 13 Drawing a rotated rectangle.
Fig. 14 Directional arrow template.
The values of LN and BN are given by (13) and (14) respectively. (13) LN = 0.80(LR)
Initially we have the original four points (vertices) of the template and the destination vertices which are present inside the rotated rectangle obtained in Fig. 13. Next the coordinates of the vertices of the template image are calculated after it has been resized to the dimensions, given by LN and WN, and has been placed in the original colour frame with its COG exactly on top of the COG of the rotated rectangle found in Fig. 13. These coordinates are named PTSN where N signifies the vertex (N=1,2,3,4). As an initial step the coordinates (x,y) of PTSN are substituted in (15) at the place of UP and VQ respectively and the coordinates (x,y) of PN1 are substituted at the place of XJ and YK respectively. The value of θ is then calculated from (15). After obtaining the value of θ we can simply put all the pixel coordinates inside the superimposed non-rotated template in (15) and get the new (x,y) coordinates for the rectangle with vertices PN1 to PN4 in (XJ,YK). In the end all the information generated is drawn on the original colour frame and the output looks like the one given in Fig. 1. Audio directions for the corresponding stage can also be given simultaneously to make it even more convenient for the user to understand the directions. After all these steps have been carried through a fresh upright bounding rectangle is calculated for the whole object/mobile/phone to be used for the next frame.
For the next frames each frame is thresholded once for grey pixels and once for black pixels, within the upright bounding rectangle area obtained in the detection phase, as these two colours comprise the colour combination of our Mobile phone. The resultant two thresholded images are then added to each other and the resultant image is added to the binary image consisting of the edges, obtained by applying canny edge detection in the region of the upright bounding rectangle. We thus obtain an overall thresholded image of the full object. Since the knowledge about the locations of internal quadrilaterals in the new frame is not present the same procedure used in the detection phase is used to obtain these quadrilaterals, but this time within the area of the upright bounding rectangle only. Then the same tracking procedure is applied to create guidance
Copyright (c) 2012 International Journal of Computer Science Issues. All Rights Reserved.
IJCSI International Journal of Computer Science Issues, Vol. 9, Issue 4, No 3, July 2012 ISSN (Online): 1694-0814 www.IJCSI.org
340
information. The whole procedure is repeated until the user signifies that he wants to get the directions for the next step by clicking the left mouse button. Once the user does this the program jumps to the next stage of detection in which the same method is applied with slight modifications to the detection parameters (example positional information, colour/hue values, etc.). After the mouse click by the user the detection flag is also lowered.
Fig. 16. The variation in frames processed per 10 seconds in the detection phase and tracking phase over a period of 1 minute of usage each.
70 60
56
CPU usage % (detection) 68 69 67 65 64 65 62 61 60
50 Fig. 15 Vertices of the rectangular area where the template should be superimposed.
40 30
3. Results and Performance
20 10
300
270
240
210
180
150
120
90
60
0
30
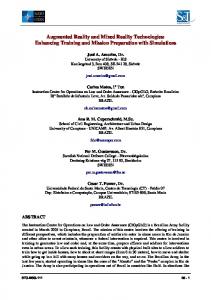
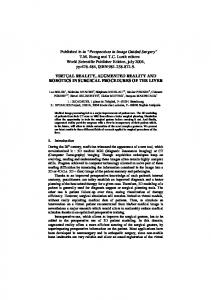
Our method was implemented using OpenCV, Intel’s open source computer vision library. The code was written in C language and the application was built using Microsoft’s Visual Studio 2008 IDE. The resultant application was tested on a Windows machine with a 1.67 GHz dual-core AMD E450 APU and 2 GB of RAM. Our method was found giving us an average frame rate of 23 FPS. The variation in frames processed per 10 seconds in the detection phase and tracking phase over a period of 1 minute of usage each is summarised in Fig. 16. From Fig. 16 it can be seen that the detection phase works slightly slower than the tracking phase. This is due the fact that in the detection phase the search window is the whole of the input frame coming from the camera. Whereas in the tracking phase the search window size has been limited to the bounding rectangle coordinates we got from the detection phase initially. These coordinates are then updated regularly by the simple follow mechanism which we discussed in the previous section. Also, the CPU usage in both the phases during an interval of 5 minutes each can be seen in Fig. 17 and Fig. 18 respectively. It can be comprehended from these figures that the CPU usage is around 63% at an average. Therefore our method is light too. This means that this method can be implemented easily on portable devices that the user can carry anywhere.
Seconds Fig. 17. CPU usage in detection phase during an interval of 5 minutes.
Fig. 18. CPU usage in tracking phase during an interval of 5 minutes.
The amount of RAM used also reflects upon the efficiency of a method. The RAM usage excluding the 35%
Copyright (c) 2012 International Journal of Computer Science Issues. All Rights Reserved.
IJCSI International Journal of Computer Science Issues, Vol. 9, Issue 4, No 3, July 2012 ISSN (Online): 1694-0814 www.IJCSI.org
dedicated for the OS is shown in Fig. 19. From this figure we can observe that of the 1.3 GB of RAM available (2 GB total minus 35% dedicated to OS) a maximum of 37% is being utilised. Therefore it is fair to say that our method needs only a maximum of 500 MB free RAM to work effectively which is nowadays a very commonplace thing in smart phones. This can be taken as another proof for our claim that our method can be implemented on portable devices. As far as the detection performance goes in the our method was able to detect the phone in 22 frames, at an average, out of every 30 frames; achieving a hit ratio of approximately 73%. These tests were done under normal indoor lighting conditions where the light was not focussed directly on to the phone. An example result is shown in Fig.1 (tracking phase). Some more examples of tracking phase are shown in Fig. 20 and Fig. 21. Also, the method is rotation and scale invariant as shown in Fig. 22, 23 and 24.shown in Fig.1 (tracking phase). Some more examples of tracking phase are shown in Fig. 20 and Fig. 21. Also, the method is rotation and scale invariant as shown in Fig. 22, 23 and 24.
341
Fig.21. Tracking phase output.
Fig. 22. A sample output of the detection phase.
Fig. 19. RAM usage over a period of 5 minutes excluding the 35% dedicated for the OS.
Fig. 20. Tracking phase output.
Fig. 23. Repeatability versus rotation.
Copyright (c) 2012 International Journal of Computer Science Issues. All Rights Reserved.
IJCSI International Journal of Computer Science Issues, Vol. 9, Issue 4, No 3, July 2012 ISSN (Online): 1694-0814 www.IJCSI.org
342
5. Comparision With Other Methods A variety of methods are being used around the world nowadays for object detection and tracking. Some of the well known algorithms are SIFT [8], SURF [9] and Viola Jones [10]. We tested our method against these methods by applying them on the same dataset and got to the conclusion that our method is competitive on the detection front but it is less CPU intensive. The results are shown in Fig. 23 to 25. In Fig. 23 the repeatability of the methods for the corresponding 2D rotation of the object can be observed. Fig. 24 demonstrates the scale invariance of our method when compared to the other methods. Taking a look at Fig. 25 it can be seen that the CPU usage of our method is also very competitive when compared to the other methods in question.
6. Limitations
Fig. 24. Repeatability versus distance from the object.
First and foremost of the limitations of this method is the problem caused in edge detection due to shadows or reflections off the surface of the object. The major cause of the non-detections is the inability of the system to detect all the edges effectively when the object is reflecting a lot of ambient light off its surface or when dense shadows are falling on it. Some of the available normalisation techniques can be applied but they will have to be optimised first in order to allow the overall method to maintain its real-time working ability. Another potential shortcoming of this method is the requirement of having the background of a colour which not same or close to that of the object as this can lead to the inability to detect proper edges of the object.
7. Future Work Work is on to add 3D graphics overlay to our method shortly. Also a see-through HMD is under development that can be attached to this system easily and will have the camera mounted on it in such a way that the camera sees exactly what the user is seeing at that instant thereby reducing the effort in overlaying computer generated graphics over the real world scene.
8. Conclusion
Fig. 25. CPU usage comparision.
This paper has presented a method for creating an augmented reality system which can guide any untrained user to perform small scale repairs on geometrical shaped appliances/gadgets. Our method is fairly accurate and is low on CPU usage while at the same time being rotation and scale invariant to a large extent.
Copyright (c) 2012 International Journal of Computer Science Issues. All Rights Reserved.
IJCSI International Journal of Computer Science Issues, Vol. 9, Issue 4, No 3, July 2012 ISSN (Online): 1694-0814 www.IJCSI.org
References [1]
[2]
[3]
[4]
[5]
[6]
[7]
[8]
[9]
[10]
[11]
P. Mistry, P. Maes, “Sixthsense, a wearable gestural interface” in the Proceedings of SIGGRAPH Asia 2009, Sketch. Yokohama, Japan. 2009. Juan, M.C., Botella, C., Alcañiz, M., Baños, R., Carrion, C., Melero, M., Lozano, J.A,.I. S. Jacobs and C. P. Bean, “An augmented reality system for treating psychological disorders: application to phobia to cockroaches” in Proceedings of the Third IEEE and ACM International Symposium on Mixed and Augmented Reality [ISMAR 2004]. Steven J. Henderson, Steven Feiner, “Evaluating the benefits of augmented reality for task localization in maintenance of an armored personnel carrier turret”, in IEEE International Symposium on Mixed and Augmented Reality 2009 [Science and Technology Proceedings 19 -22 October]. Edgard Lamounier, Jr., Arthur Bucioli, Alexandre Cardoso, Adriano Andrade and Alcimar Soares, “On the use of augmented reality techniques in learning and interpretation of cardiologic data”, in 32nd Annual International Conference of the IEEE EMBS [Buenos Aires, Argentina, August 31 - September 4, 2010]. Kazuyo Iwamoto, “A monocular video see-through head mounted display for interactive support system“, in Proceedings of the 2009 IEEE International Conference on Systems, Man, and Cybernetics [San Antonio, TX, USA - October 2009]. Satoshi Suzuki, K.Abbe “Topological structural analysis of digitized binary images by border following”, in Computer vision, graphics, and image processing, [30, 32-46 (1985)]. John Canny, “A computational approach to edge detection”, in IEEE transactions on pattern analysis and machine intelligence, [vol. PAMI-8, No. 6, November 1986]. David G. Lowe. “Object recognition from local scaleinvariant features”, in Proceedings of the International Conference on Computer Vision, [Corfu (Sept. 1999)]. Herbert Bay, Andreas Ess, Tinne Tuytelaars, Luc Van Gool, “Speeded-up robust features (surf)”, in Computer vision and image understanding [110 (2008) 346–359]. Paul Viola, Michael Jones, “Rapid object detection using a boosted cascade of simple Features”, accepted for conference on computer vision and pattern recognition [2001]. David Douglas, Thomas Peucker, "Algorithms for the reduction of the number of points required to represent a digitized line or its caricature", in The canadian cartographer [10(2), 112–122 (1973)]. William K. Pratt, “Digital Image Processing”, fourth edition [2010 pp. 387-410].
343
2012. He has until now published three international papers. He is currently pursuing his research in the field of Computer Vision.
P. Vijayakumar completed his B.Tech Degree in Electronics and Communication Engineering in the year 2000 and Master’s Degree in Applied Electronics in 2006. He is currently working as an Assistant Professor at SRM University, Chennai, India. He has published numerous papers in National/International journals and conferences. His research interests include Intelligent Signal And Image Processing, Wireless Sensor Network, Human Computer Interaction, Real-time Computing And Embedded Systems. Sidharth Bhatia completed his B.Tech degree in Electronics and Communication Engineering in 2010 and Master’s Degree in Embedded System Technology in
Copyright (c) 2012 International Journal of Computer Science Issues. All Rights Reserved.