ISPRS Annals of the Photogrammetry, Remote Sensing and Spatial Information Sciences, Volume II-5, 2014 ISPRS Technical Commission V Symposium, 23 – 25 June 2014, Riva del Garda, Italy
AUGMENTED REALITY SYSTEM USING LIDAR POINT CLOUD DATA FOR DISPLAYING DIMENSIONAL INFORMATION OF OBJECTS ON MOBILE PHONES S. Gupta *, B. Lohani
Geo-informatics Laboratory, Department of Civil Engineering, Indian Institute of Technology Kanpur, Kanpur
[email protected],
[email protected]
KEY WORDS: Mobile augmented reality, LiDAR, intensity image, dimension measurement, feature matching, registration ABSTRACT: Mobile augmented reality system is the next generation technology to visualise 3D real world intelligently. The technology is expanding at a fast pace to upgrade the status of a smart phone to an intelligent device. The research problem identified and presented in the current work is to view actual dimensions of various objects that are captured by a smart phone in real time. The methodology proposed first establishes correspondence between LiDAR point cloud, that are stored in a server, and the image t hat is captured by a mobile. This correspondence is established using the exterior and interior orientation parameters of the mobile camera and the coordinates of LiDAR data points which lie in the viewshed of the mobile camera. A pseudo intensity image is generated using LiDAR points and their intensity. Mobile image and pseudo intensity image are then registered using image registration method SIFT thereby generating a pipeline to locate a point in point cloud corresponding to a point (pixel) on t he mobile image. The second part of the method uses point cloud data for computing dimensional information corresponding to the pairs of points selected on mobile image and fetch the dimensions on top of the image. This paper describes all steps of the proposed method. The paper uses an experimental setup to mimic the mobile phone and server system and presents some initial but encouraging results.
1. INTRODUCTION 1.1 Motivation Smart phones are the most popular and common device nowadays because of their user friendly and portable advantages. Smart phones are being integrated with the latest technology to provide the best possible applications. Currently the focus of researchers and industry is to use the capabilities of a mobile to offer something beyond reality which is Mobile Augmented Reality System (MARS). With this technology a user is able to view information about an area in front of his mobile device helping him to get the location details, name of the street and other relevant information available. This is one example of mobile AR application providing location details. The other example is where a user is able to visualise an object which he is interested to buy. A user can have an idea of how a furniture will look like by posing the camera in that position and AR provides the view of the scene with the furniture which actually was not present there. Mobile augmented reality is being applied in navigation systems also by integrating geospatial domain with this technology. Navigation using mobile AR location based services is now popular where a user is able to view a virtual environment for navigation on his mobile onsite. Thinking apart from navigation services a user may also be interested in more details about his surroundings. The most common objects that we come across in our environment are the buildings, electric or telephone poles, trees, sign boards, landmarks, road furniture etc. It is possible to identify these features by their name and location using popular mobile map services currently. A mobile user will appreciate such services more if he is also able to know the sizes of these objects onsite. So the
problem statement taken in this paper is to make it possible for a mobile user to get dimensions of buildings and other features around him on his mobile by just clicking over the image taken by the mobile. The motivation for the current work comes from the increasing importance of geospatial domain in the AR framework to provide geo-referenced information on site. The idea of augmenting dimensions of buildings and other objects in the mobile’s field of view can help a mobile user to know measurements of various features in front of him. This also holds a good potential for personnel associated with construction and mining sites where it can provide a quick means of measurement which is highly interactive in nature. Additionally, a municipal worker will benefit by quick supervision of sites, while security personnel can know dimensions of environment they are operating in. The problem of determining dimensions of objects which are seen in a mobile image utilizes LiDAR point cloud in our proposed method. Moreover, the point can be from any source with laser scanning being the most significant source currently. Dimensions can be easily computed between any two points in LiDAR 3D point cloud which therefore is the motivation to use these for realizing the objective of this research. LiDAR data from a terrestrial and/or mobile laser scanner provide 3D point cloud data of the scenes along with the intensity of each point. The objective is to get the dimension of buildings and other objects over a captured mobile image using the LiDAR point cloud data stored in a server in near-real time. 1.2 Challenges in the proposed system The problem presented in this paper requires registration of any pixel in mobile image to the corresponding point in LiDAR
* Corresponding author.
This contribution has been peer-reviewed. The double-blind peer-review was conducted on the basis of the full paper. doi:10.5194/isprsannals-II-5-153-2014 153
ISPRS Annals of the Photogrammetry, Remote Sensing and Spatial Information Sciences, Volume II-5, 2014 ISPRS Technical Commission V Symposium, 23 – 25 June 2014, Riva del Garda, Italy
point cloud data to compute real world measurements. There are many issues in this process as the image captured by a smart phone device is RGB image and its characteristic is different than the point cloud data acquired by a terrestrial/mobile laser scanner. Further, LiDAR data differ in their intensity values even for same material due to the different range and incidence angle at different points in the scene. These issues pose difficulty during registration process and demand a robust method to find correspondence in the datasets. Also, there is difference in the resolution of both datasets. Mobile image will have a different resolution from that of the 2D representation of a point cloud data, which is desired to be produced in this research as an intermediate data. So the chosen methodology should be such that it produces reliable results even with this difference in resolution of the datasets. Another important issue is the availability of only rough position and orientation information of the mobile camera. In view of the above issues the challenge is to utilize available information to get a good correspondence in mobile image and LiDAR point cloud, which would decide the success of this work.
are used for 2D projection of LiDAR data as required in the steps described in the following paragraphs.
1.3 Related work
2.2 2D representation of LiDAR data
Augmented Reality for location based services is a fast growing area of interest for researchers. Smart phones equipped with GPS and gyroscopes provide a basis to link this information with geospatial database. Bae et al. (2013) proposed a mobile augmented reality system to access 3D cyber information onsite. The database in chosen system is a collection of various site images and Building Information Model (BIM) and these are utilized to augment BIM information over the mobile image. The authors have used the structure for motion algorithms for 3D point cloud reconstruction using precollected site images. Guan et al. (2010) developed an outdoor AR system which involves efficient matching method for robust feature matching. Hierarchical image partitioning method is used to detect scale of a live image by matching this image with the database images. Lazaridis et al. (2013) designed a method to search and retrieve multimodal data. This framework links images to semantic annotation using some similarity measure. The concept of semantic annotation added to the existing database provides a basis for distinguishing different content type. Kai-Chen et al. (2012) developed a lightweight helmet to project construction drawings and related information as a location based service. The information is extracted from a collection of site images (2D drawings) database and is overlaid over the device in image format. Yabuki et al. (2012) proposed AR registration technique using point cloud data in which the point cloud data are retrieved from the data server and are displayed over a video image.
The geo-referenced 3D LiDAR data are defined in the world coordinate system and to generate their corresponding 2D representation these points are projected onto a plane defined by mobile camera parameters. The coordinate system of this projection plane is defined as shown in Fig. 1.
2. METHODOLOGY Smart phones are integrated with different types of sensors like GPS, accelerometers, magnetometers and gyroscopes that provide acceleration and orientation of mobile camera at any point of time in the world coordinate system. So the work presented here assumes that a mobile phone is aware of its location and orientation in the world coordinate system. This information is attached within the EXIF tags of mobile. This extracted information of mobile image and camera parameters
2.1 Proposed solution The solution to the problem of this paper is realized through three modules, as discussed in the following paragraphs. The first module utilizes the mobile camera parameters to determine the location and extent of LiDAR data point cloud corresponding to the mobile image and projecting these data onto a 2D plane. The intensity values of LiDAR point cloud are used to give digital numbers to this plane thus generating a pseudo intensity image corresponding to mobile image. In the second module corresponding pixels are identified between the pseudo image and the mobile image. Finally in the third module, the corresponding points in both the datasets are used to derive a transformation model to transform from one image to other. After transformation points corresponding to image pixels are selected from LiDAR data and used for dimension computations. Each module is discussed in detail in the following sections.
Figure 2. Projection of 3D laser point onto a plane defined in camera coordinate system
The origin of any camera coordinate system is the center of its lens. The Z-direction is along the camera axis, i.e., perpendicular to the CCD sensor or XY plane of the camera system with positive direction pointing towards the objects to be imaged. The image plane on which laser point cloud is to be projected is defined as of the same size as that of CCD array of the mobile camera and is assumed to be situated at a distance equal to focal length of camera from the origin of camera coordinate system. LiDAR data points are projected onto this defined plane using the well known collinearity equations. This equation includes rotation and translation required to align camera and image plane coordinate system. The position of projection centre at the time of clicking image is known from the onboard GPS. The width (w) and height (h) of the
This contribution has been peer-reviewed. The double-blind peer-review was conducted on the basis of the full paper. doi:10.5194/isprsannals-II-5-153-2014 154
ISPRS Annals of the Photogrammetry, Remote Sensing and Spatial Information Sciences, Volume II-5, 2014 ISPRS Technical Commission V Symposium, 23 – 25 June 2014, Riva del Garda, Italy
mobile image is used to define the interior orientation parameters (xo,yo,-f), where xo=(w/2) and yo=(h/2). The focal length of the mobile camera lens defines f. Rotation matrix M is a 3x3 matrix (Eq. 1). The elements of rotation matrix M used in collinearity equation are defined in terms of rotation parameters (ω,ϕ,Ʀ) which are the rotations about X, Y and Z axis, respectively, and are given by the onboard gyroscope. As illustrated in Fig. 1 these rotation angles rotate the world coordinate system to camera coordinate system.
m11 m12 M m21 m22 m31 m32
m13 m23 m33
(1)
The computed pseudo image coordinates requires a resampling step as (x’,y’) may not always be integers. These coordinates are rounded off to the nearest integer value and thus one image coordinate may correspond to more than one LiDAR point. Each image pixel in the projected plane corresponding to a 3D LiDAR data point contains the intensity value of the LiDAR point and in case of multiple points, average intensity value is taken. Thus the image generated from this process is a pseudo intensity image which corresponds to the camera image. 2.3 Feature detection and matching The next step in the proposed methodology is to find correspondences between mobile RGB image and pseudo intensity image generated using LiDAR point cloud data. The intensity image generated from LiDAR data differs from mobile image in terms of information stored in each pixel. Intensity image is represented by intensity values captured by laser scanner while the mobile images have RGB values. As already discussed these images differ in their radiometric characteristics, resolution, exposure station and viewshed. So, a robust method of registration is needed which can work under available constraints. Objects such as trees, grass patches, building planes can be identified in LiDAR data as cluster of points having similar intensity. Correspondence detection using features in different types of images has been found to provide reliable results (Meierhold et al., 2010). In view of this and the above discussion feature based registration method SIFT by Lowe (2004) is selected in this work. This algorithm is robust enough to find corresponding features in images of different scale, orientation and resolution (Lowe, 2004). SIFT is a keypoint extractor and finds distinct keypoints in the images which are invariant to scale and rotation. SIFT searches for local features in an image and has ability to detect large set of features even in small objects. Different smoothing versions of the same image are created to generate scale space. This reduces the effect of illumination differences in the images while finding keypoints. The scale space peaks are selected which are potential locations of local features. These keypoints are localized to find accurate position of all keypoints. Each keypoint is also assigned orientation. The most important thing about this algorithm is the descriptors attached with each keypoint which describe it. The keypoints which are detected also contains information about its orientation and descriptors are then further matched against feature database of the other image. Correspondence among features is obtained if the
distance between keypoints within descriptor space is less than a certain threshold. This threshold is manually optimised in our work to find consistent matches. 2.4 Transformation Model SIFT finds a number of matches in the images but it is not necessary that all computed matches are correct. There may be several false matches as well, which should be removed before further steps. Random Sample Consensus (RANSAC) is a popular method for outlier removal. It is an iterative method in which random sample dataset from the given data is derived and a model is fit to this dataset. After this the number of outliers is computed and the procedure is repeated until a best fit model is obtained. The subset of data used in the best model fit is the set of inliers and are considered to be true matches. In this paper, the model fitting in RANSAC is done using the concept of estimating homography (Li et al., 2005). Homography is a projective transformation which transforms between two views of a planar surface. This mapping between corresponding image points can be represented by a homogenous matrix H3x3. In homogenous coordinate system, transformation of point (x1,y1) in one image to (x2,y2) in other image is represented by Eq. 2 and Eq. 3.
x2 x1 y 2 H y1 1 1 h11 H h21 h31
h12 h22 h32
h13 h23 h33
(2)
(3)
The above equation Eq. 2 is solved using Direct Linear Transform (DLT) method and at least four correspondences are required to fit the model. For more than four matches the solution is computed by homogenous least square approach (Brown et al., 2007). Thus this transformation matrix is used to register camera image to LiDAR intensity image. This threshold is manually optimised in our work to find consistent matches. 2.5 Finding 3D point correspondence For every pixel in the camera image that a user clicks there is a registered pixel in the intensity image. This intensity pixel may correspond to multiple points in the LiDAR data. There are issues in selecting the most appropriate point from this data set. A pixel can correspond to several points on objects that are in the same line of sight from the user. For example, there may be a tree in front of building and when a building point is selected it may conflict with tree points which are projected into the same pixel or nearby pixels. So point selection criterion is also an important factor that may affect the final results. Here we are bound with the assumption that dimensions can be found for the points that are visible from the user viewpoint. In the present work, to differentiate between front and rear object points we define point selection criteria as defined in Eq. 4.
P median(dist ( Po , Pc ))
This contribution has been peer-reviewed. The double-blind peer-review was conducted on the basis of the full paper. doi:10.5194/isprsannals-II-5-153-2014 155
(4)
ISPRS Annals of the Photogrammetry, Remote Sensing and Spatial Information Sciences, Volume II-5, 2014 ISPRS Technical Commission V Symposium, 23 – 25 June 2014, Riva del Garda, Italy
The point is selected from a candidate set of points Pc by computing distance of each candidate point from the user location point Po and then finding median of those distances. For more reliability the candidate set is expanded by considering neighbourhood of the pixel selected. This approach produces more reliable results, though still there is scope for improvement.
points acquired by terrestrial laser scanner are in a local coordinate system defined by the scanner for each scan. After merging the scans these are georeferenced using the ground control points. Cloudcompare software was used in the experiment for merging and georeferencing. The accuracy of georeferencing is defined in terms of RMSE (Root Mean Square Error) of the georeferencing model as a measure of deviation between points and model. The details of scans and their georeferencing accuracy are shown in Table 1.
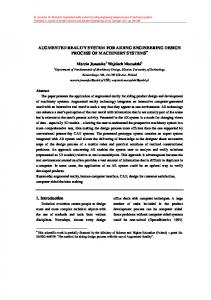
3. EXPERIMENT 3.1 Experimental setup Instead of using a mobile phone and a server as is originally proposed in this research the algorithm designed here is being tested through an experimental setup that mimics the mobile phone and server system. LiDAR 3D data for the experiments are acquired using ILRIS-3D terrestrial laser scanner. The data are collected at a location with some prominent buildings in IIT Kanpur campus. For algorithm testing a high resolution Nikon D200 camera was used and placed over the laser scanner to capture images of the scanned area. To keep track of the rotation of the camera and its position a POS system (IMU and GPS) was used where IMU was placed parallel to the camera. The IMU used was Landmark 40 INS/GPS. There is no such significance of placing camera and IMU system over scanner as TLS data is later georeferenced and the setup is used just for the sake of convenience in carrying out experiments. The setup is shown in Fig. 2.
Camera
Scan Number No. of points Scan 1 2134707 Scan 2 2231860 Scan 3 3356672 Scan 4 3235504 Scan 5 2952643 Scan 6 1093101
RMSE (m) 0.122 0.043 0.012 0.069 0.066 0.044
Table 1. Scanned LiDAR data statistics
The position and orientation of mobile user (here NIKON camera) are provided by the POS system in the world coordinate system. Here, the position of user/camera is measured using GPS (stop and go mode to mimic mobile user) without performing any baseline processing in the GPS data. The accuracy of GPS position thus obtained is comparable to the accuracy of location values provided by mobile GPS which is around 5-8 meters. The orientation of camera are measured by IMU and converted accordingly for the desired parameters. 3.3 Algorithm testing
X
IMU
Y Z
. Figure 2. Experimental setup
It is clear from Fig. 2 that IMU and camera coordinate system are not aligned. The orientation parameters measured by IMU is defined for its own coordinate system and thus a transformation is applied to obtain orientation of camera. The desired orientation parameters of camera used in our experiments are (ω-180o, ϕ+270o, Ʀ+270o) which can be interpreted from the alignment difference of IMU and camera body system. 3.2 Data pre-processing Six laser scans were conducted to comprehensively capture the experiment's site. Different buildings were targeted in these scans. Four camera images were captured in this area as the sample images for the experiment. These sample images differ in the amount of feature information present in them. Data
Implementation of the algorithm described in the previous section is done using MATLAB 2013. For the experiments the setup used is described earlier. The 2D projection of the point cloud data is to be done by transforming the points from world coordinate system to camera coordinate system to produce pseudo intensity images. The user location (Xp,Yp,Zp) and orientation parameters (ω,ϕ,Ʀ) corresponding to a particular image are measured from GPS and IMU, respectively. These values are measured as explained earlier. For each LiDAR point (X’,Y’,Z’), its corresponding image plane coordinate (x’,y’) is computed using collinearity equation. Pseudo intensity image is generated after sampling as defined in the methodology section. After 2D representations of LiDAR data in the form of pseudo intensity image, standard SIFT implementation by Lowe is used to detect features and find correspondences in the images. RANSAC implementation in MATLAB is used to compute consistent match set and estimate homography model to compute transformation matrix H. The transformation parameters in H transforms intensity image to camera image. Next, 3D point in LiDAR database corresponding to a pixel in intensity image is to be identified for every pixel/point selected in camera image for dimension computation (it is clear till now that camera and intensity image are registered so we have pixel-to-point correspondence in hand). This is done by the method discussed in section 2.5 to fine 3D point correspondence. The dimensions between two image points are finally measured by computing the Euclidean distance between corresponding 3D points which serves the purpose of measurement.
This contribution has been peer-reviewed. The double-blind peer-review was conducted on the basis of the full paper. doi:10.5194/isprsannals-II-5-153-2014 156
ISPRS Annals of the Photogrammetry, Remote Sensing and Spatial Information Sciences, Volume II-5, 2014 ISPRS Technical Commission V Symposium, 23 – 25 June 2014, Riva del Garda, Italy
4. RESULTS AND DISCUSSION 4.1 2D representation The sample camera images for the tests were captured by a 10 megapixel Nikon D200 camera of focal length 28 mm. A snapshot of sample 3D LiDAR data acquired by the TLS is shown in Fig. 3 (top). Image taken by the camera is shown in Fig. 3 (middle). The corresponding intensity image, from a certain viewpoint, is computed using user location and camera image parameters as per the proposed methodology and is shown in Fig. 3 (bottom).
Image No. Camera image LiDAR intensity image
I 8238 1105
II 6468 12500
III 7028 3135
IV 4854 6491
Table 2. Number of SIFT keypoints in images
4.3 Feature matching After SIFT keypoints generation, matching of these interest points to the corresponding points in the other image is also important. For this, a keypoint in one image is matched to a keypoint in the other image if the distance ratio is less than a specified threshold. Experiments were performed on various sample datasets to test and derive a suitable value of distance ratio. In this paper, a match is acceptable if the distance ratio is less than 0.7 which is used throughout our experiments. It is optimized during experiments with four different sample images (includes image with less features which produce more false matches). This value of distance ratio provided sufficient number of true matches to be considered for refinement through RANSAC for consistent match set. The results of SIFT matching on a sample dataset of experiment is shown in Fig. 4
Figure 4. Matching results of camera image (left) and LiDAR intensity image (right)
Figure 3. LiDAR scanned data (top), camera image taken by user (middle) and corresponding intensity image (bottom) 4.2 Feature detection In the experiments performed SIFT detection in both the images are efficient in terms of running time and number of keypoints detected. It is tested on sample set of images available and the number of keypoints detected in the images shows the robustness of this algorithm in the proposed framework. The comparison of number of keypoints detected in RGB camera and intensity image is tabulated in Table 2.
The above matching using SIFT contains many false matches as well. So these matches were refined to remove outlier matches and consider only the consistent matches. This was done using RANSAC outlier removal technique. The distance threshold between data point and the model is used to decide whether a point is an inlier. The point coordinates are normalised so that their mean distance from the origin is squareroot of 2. The value of threshold should be set relative to this in the range 0.001-0.01. We have used a threshold value of 0.01 in RANSAC, though there is not much change in experimental results by taking value in the range 0.001-0.01. The refined results with only consistent matches after applying RANSAC is shown in Fig. 5.
This contribution has been peer-reviewed. The double-blind peer-review was conducted on the basis of the full paper. doi:10.5194/isprsannals-II-5-153-2014 157
ISPRS Annals of the Photogrammetry, Remote Sensing and Spatial Information Sciences, Volume II-5, 2014 ISPRS Technical Commission V Symposium, 23 – 25 June 2014, Riva del Garda, Italy
Figure 5. Refined matching results of camera image (left) and LiDAR intensity image (right) after RANSAC
4.4 Transformation using estimated homography In RANSAC, a model is fit using projective transformation and the estimated homography matrix H is used to transform the intensity image to camera image and vice versa. The result of registration of two images after applying this transformation is shown in Fig. 6. The foreground shows the intensity image while RGB image is in the background (shown here as gray level image.) The results show that the registration performed using the method is satisfactory and reliable.
Figure 6. Registration of LiDAR intensity image (foreground) and camera image (background) 4.5 Dimension computation and augmentation After registration of the two images, LiDAR 3D point correspondence for any user clicked pixel in camera image is found by the method proposed in section 2.5. The dimensions are computed between any two user selected points and shown on top of the camera image. The results are shown in Fig. 7. The dimensions computed by the proposed method in this paper were tested against direct computations in point cloud data. Though only one image is used for showing the results in this paper, the validation was carried out for all images captured. The validation was done by computing dimensions of 70 randomly clicked points on the images and comparing these with the directly computed corresponding dimensions. The results show that approximately 90% times, the dimensions computed are matching within a accuracy of 30 cm and 80% of the points are within 25 cm accuracy. Thus this paper proves the feasibility of the proposed framework.
Figure 7. Dimensions of user selected points augmented over camera image
SUMMARY AND CONCLUSION In this paper, the problem of augmenting dimension information for a mobile augmented reality system is taken up and an approach is developed to solve this using LiDAR data. The proposed solution for the problem utilizes terrestrial LiDAR geo-referenced data to find dimensions between any two points clicked by a mobile user onsite. This paper has proved the feasibility of the described method for the problem framework. The approach presented in this paper is able to provide another augmented reality location based service with only the location and orientation input from the user. This method does not require any additional complex and expensive hardware into the mobile device. Thus the approach here integrates a mobile camera image and its parameters with the geospatial data to know the sizes of buildings and other objects in the surrounding. A method is presented to register mobile image with 3D point cloud data which involves the projection of LiDAR data from user viewpoint to form pseudo intensity images. The paper also discusses the issues of working with the pseudo intensity image which differ from the camera image in terms of orientation, resolution, scale and some geometric distortion. The paper has used SIFT algorithm to find feature correspondences between these images and found it to work satisfactorily. While SIFT establishes a correspondence between mobile image and the pseudo intensity image, to realize the desired output, locating the most accurate point in LiDAR point cloud corresponding to the user clicked pixel is also important. This issue is also discussed in this paper and an approach is presented to select the best matching point from a set of candidate points. The results of the experiments have shown that the designed methodology provides the required result for the problem defined here. The problem of finding the best point correspondence still holds a scope for improvement though our method provides correct results almost 90% of the times with an accuracy of 30 cm. The method can be improved by defining a more robust method of point picking. The future work will deal with the issues of identifying points of interest of user in an image and finding the correct point correspondence in the database. Visibility of a point from a user location is an important factor here. In the next stage of the work the methodology presented here will be also implemented using a data server and a mobile.
This contribution has been peer-reviewed. The double-blind peer-review was conducted on the basis of the full paper. doi:10.5194/isprsannals-II-5-153-2014 158
ISPRS Annals of the Photogrammetry, Remote Sensing and Spatial Information Sciences, Volume II-5, 2014 ISPRS Technical Commission V Symposium, 23 – 25 June 2014, Riva del Garda, Italy
REFERENCES Bae, H., Golparvar-Fard, M., and White, J., 2013. Highprecision and Infrastructure-independent Mobile Augmented Reality System for Context-Aware Construction and Facility Management Applications. Computing in Civil Engineering , pp. 637-644. Bodensteiner, C, and Arens, M., 2012. Real-time 2D video/3D LiDAR registration. In Pattern Recognition (ICPR), 21st International Conference on, pp. 2206-2209. Brown, M., and Lowe, D., 2007. Automatic panoramic image stitching using invariant features. International Journal of Computer Vision 74, no. 1, pp. 59-73. Guan, W., You, S., and Neumann, U., 2011. Computationally efficient retrieval-based tracking system and augmented reality for large-scale areas. Applications of Computer Vision (WACV), IEEE Workshop on, pp. 410-417. Lazaridis, M., Axenopoulos, A., Rafailidis, D., and Daras. P., 2013. Multimedia search and retrieval using multimodal annotation propagation and indexing techniques. Signal Processing: Image Communication 28, no. 4, pp. 351-367. Li, X., Liu, Y., Wang, Y., and Yan, D., 2005. Computing homography with ransac algorithm: a novel method of registration. Photonics Asia 2004, International Society for Optics and Photonics, pp. 109-112. Liestol, G., 2011. Learning through situated simulations: exploring mobile augmented reality. ECAR Research Bulletin, 1, pp. 1-14. Lowe, D., 2004. Distinctive image features from scaleinvariant keypoints. International journal of computer vision 60, no. 2 , pp. 91-110. Meierhold, N., et al., 2010. Automatic feature matching between digital images and 2D representations of a 3D laser scanner point cloud. Int. Arch. Photogramm. Remote Sens. Spat. Inf. Sci 38, pp. 446-451. Yabuki, N., Hamada, Y., & Fukuda, T., 2012. Development of an accurate registration technique for outdoor augmented reality using point cloud data. Proceedings of the 14th International Conference on Computing in Civil and Building Engineering. Yeh, K. C., Tsai, M. H., and Kang, S. C., 2012. On-site building information retrieval by using projection-based augmented reality. Journal of Computing in Civil Engineering, Vol. 26(3), pp. 342-355.
This contribution has been peer-reviewed. The double-blind peer-review was conducted on the basis of the full paper. doi:10.5194/isprsannals-II-5-153-2014 159