Research
F Morais-Santos et al.
Lactate transport inhibition in breast cancer cell lines
21:1
27–38
AUTHOR COPY ONLY
Differential sensitivities to lactate transport inhibitors of breast cancer cell lines
´ F Vieira3, Filipa Morais-Santos1,2, Vera Miranda-Gonçalves1,2, Sı´lvia Pinheiro1,2, Andre ´ tima Baltazar1,2,* and Joana Paredes3, Fernando C Schmitt3,4,5,6, Fa 1,2,5,7, ´ line Pinheiro * Ce
Endocrine-Related Cancer
1 School of Health Sciences, Life and Health Sciences Research Institute (ICVS), University of Minho, Campus of Gualtar, Braga, Portugal 2 ICVS/3B’s – PT Government Associate Laboratory, Braga, Guimara˜es, Portugal 3 IPATIMUP – Institute of Molecular Pathology and Immunology, University of Porto, Porto, Portugal 4 Medical Faculty, University of Porto, Porto, Portugal 5 Department of Laboratory Medicine and Pathobiology, Faculty of Medicine, University of Toronto, Toronto, Canada 6 Department of Pathology, University Health Network, Toronto, Canada 7 Barretos School of Health Sciences, Dr. Paulo Prata - FACISB, Barretos, Sao Paulo, Brazil *(F Baltazar and C Pinheiro contributed equally to this work)
Correspondence should be addressed to C Pinheiro Email
[email protected]
Abstract The tumour microenvironment is known to be acidic due to high glycolytic rates of tumour cells. Monocarboxylate transporters (MCTs) play a role in extracellular acidification, which is widely known to be involved in tumour progression. Recently, we have described the upregulation of MCT1 in breast carcinomas and its association with poor prognostic variables. Thus, we aimed to evaluate the effect of lactate transport inhibition in human breast cancer cell lines. The effects of a-cyano-4-hydroxycinnamate, quercetin and lonidamine on cell viability, metabolism, proliferation, apoptosis, migration and invasion were assessed in a panel of different breast cancer cell lines. MCT1, MCT4 and CD147 were differently expressed among the breast cancer cell lines and, as expected, different sensitivities were observed for the three inhibitors. Interestingly, in the most sensitive cell lines, lactate transport inhibition induced a decrease in cell proliferation, migration and invasion, as well as an increase in cell death. Results were validated by silencing MCT1 expression using siRNA. The results obtained here support targeting of lactate transport as a strategy to treat breast cancer, with a special emphasis on the basal-like subtype, which so far does not have a specific molecular therapy.
Key Words "
breast
"
molecular biology
"
carcinoma
Endocrine-Related Cancer (2014) 21, 27–38
Introduction Increased glucose uptake is a widely described phenomenon in cancer cells, being the rationale behind the whole-body non-invasive positron emission imaging technique, using 18F-fluorodeoxyglucose-positron emission tomography (FDG-PET). This technique is useful in the diagnosis and prognosis of breast cancer, especially http://erc.endocrinology-journals.org DOI: 10.1530/ERC-13-0132
q 2014 Society for Endocrinology Printed in Great Britain
regarding the detection of distant metastases, and recurrent disease as well as in monitoring response to therapy (Jadvar et al. 2009). This increased uptake of glucose, especially through glucose transporter 1 (GLUT1), is a consequence of an increased glycolytic metabolism that generates acids inside the cell. This fact leads to Published by Bioscientifica Ltd.
Research
F Morais-Santos et al.
Lactate transport inhibition in breast cancer cell lines
21:1
28
Endocrine-Related Cancer
AUTHOR COPY ONLY
upregulation of some pH regulators, like carbonic anhydrase IX (CAIX) (Pouyssegur et al. 2006), to maintain the intracellular physiological pH, causing extracellular acidosis. The increased glycolytic metabolism ultimately leads to an increase in lactate release by cancer cells, also contributing to microenvironmental acidosis, as well as increased invasion (Stern et al. 2002) and suppression of anticancer immune response (Fischer et al. 2007). In this context, lactate has a central role in cancer aggressiveness and lactate transporters (monocarboxylate transporters (MCTs)) are currently seen as potential therapeutic targets in cancer treatment, with promising results obtained using in vitro and in vivo models (Mathupala et al. 2004, 2007, Colen et al. 2006, 2011, Fang et al. 2006, Sonveaux et al. 2008). There is an ongoing clinical trial using a specific MCT1/MCT2 inhibitor (Jones & Schulze 2012). MCTs belong to a family of 14 members, with isoforms 1–4 being lactate proton symporters that exhibit different affinities for lactate (Halestrap & Meredith 2004). As the isoforms responsible for lactate efflux, MCT1 and MCT4 are probably the most promising in the cancer context and reports on MCT1 and MCT4 upregulation in a variety of tumours are becoming more frequent (Mathupala et al. 2004, Fang et al. 2006, Koukourakis et al. 2006, 2007, Pinheiro et al. 2008a,b, 2010, 2012). Importantly, we have described association of MCTs, especially MCT1, with poor prognostic variables (Pinheiro et al. 2008b, 2009, 2010, de Oliveira et al. 2012), reinforcing the potential of MCT1 as a cancer therapeutic target. Recently, our group described an increase in MCT1 expression in breast carcinomas, when compared with normal tissue. This enhanced MCT1 expression, as well as the expression of CD147, a MCT1/MCT4 chaperone (Kirk et al. 2000, Gallagher et al. 2007), was associated with basal-like-subtype tumours and other poor prognostic parameters (Pinheiro et al. 2010). Additionally, we found that MCT1, but not MCT4, was associated with GLUT1 and CAIX expressions, indicating a role of MCT1 in the hyperglycolytic and acid-resistant phenotype characteristic of less oxygenated (Pinheiro et al. 2011), instead of oxygenated cancer cells as pointed by others (Sonveaux et al. 2008). Over recent years, different approaches have been used to inhibit lactate efflux from cancer cells, including MCT small-molecule inhibitors such as a-cyano-4hydroxycinnamic acid (CHC; Colen et al. 2006, Sonveaux et al. 2008), lonidamine (Ben-Horin et al. 1995, Ben-Yoseph et al. 1998, Fang et al. 2006), flavonoids such as quercetin (Belt et al. 1979, Deuticke 1982, Wang & Morris 2007), and MCT siRNA (Mathupala et al. 2004, Fang et al. 2006, Sonveaux et al. 2008). The inhibition of MCTs http://erc.endocrinology-journals.org DOI: 10.1530/ERC-13-0132
q 2014 Society for Endocrinology Printed in Great Britain
has a direct effect on lactate transport, as well as on pH homeostasis, therefore having an important effect on cancer cell viability. In fact, studies on MCT inhibition are providing evidence for this strategy in the reduction of tumour malignancy, enhancement of radio-sensitivity and induction of cell death (Mathupala et al. 2007). Despite the promising results with obtained for MCT inhibition in cancer, more efforts are needed to support inhibition of lactate transport and pH regulation as an alternative therapeutic strategy in cancer treatment. In this work, we were able to demonstrate the potential of MCT inhibitors in reducing breast cancer cell proliferation, migration and invasion as well as inducing cell death.
Materials and methods Cell lines and culture conditions The human breast cancer cell lines MDA-MB-468, MDAMB-231, Hs578T, BT-20, MCF-7/AZ and SkBr3 were obtained from ATCC (Manassas, VA, USA) or from collections developed by Drs Elena Moisseva (Cancer Biomarkers and Prevention Group, Departments of Biochemistry and Cancer Studies, University of Leicester, UK), Marc Mareel (Laboratory of Experimental Cancerology, Ghent University Hospital, Belgium) and Eric Lam (Imperial College School of Medicine, Hammersmith Hospital, London, UK). The characteristics of each cell line are presented in Table 1. All cell lines were routinely cultured in DMEM (Invitrogen), supplemented with 10% foetal bovine serum (Invitrogen) and 1% antibiotic solution (penicillin– streptomycin; Invitrogen), in a 37 8C humidified atmosphere with 5% CO2. Drugs Stock solutions of CHC, quercetin and lonidamine (Sigma–Aldrich) were prepared with DMSO (Sigma– Aldrich) and stored at K20 8C until use. Working solutions were freshly prepared in the culture medium without serum. DMSO concentration in the cell culture medium never exceeded 1%. All controls were performed using DMSO alone (vehicle). Downregulation of MCT1 expression Silencing of MCT1 expression was achieved using siRNA (siRNA for MCT1, #4390824, Ambion, Foster City, CA, USA; scramble siRNA, #4390843 (Ambion)), using lipofectamine (RNAiMAX 13778-075, Invitrogen, Published by Bioscientifica Ltd.
F Morais-Santos et al.
Research
Table 1
Lactate transport inhibition in breast cancer cell lines
21:1
29
AUTHOR COPY ONLY
Details of the origin, clinical, and pathological features of the tumours used to establish the breast cancer cell lines used in
present study (Neve et al. 2006) Cell line
Origin
Age (years)
MDA-MB-468 MDA-MB-231 Hs578T
Metastatic site (pleural effusion) Metastatic site (pleural effusion) Breast
51 51 74
BT20
Breast
74
MCF-7/AZ
Metastatic site (pleural effusion)
69
SkBr3
Metastatic site (pleural effusion)
43
Carlsbad, CA, USA) as permeabilisation agent, according to the manufacturer’s instructions.
Endocrine-Related Cancer
Evaluation of the metabolic behaviour of human breast cancer cell lines Glucose and lactate quantification The metabolic behaviour of the different cell lines was determined by assessing extracellular amounts of glucose and lactate. Glucose and lactate were quantified using commercial kits (Roche, Basel, Switzerland and SpinReact, Sant Esteve de Bas, Girona, Spain, respectively), according to the manufacturer’s instructions, as described previously (Miranda-Goncalves et al. 2013). Results are expressed as the total in micrograms for three independent experiments.
Pathology
Cancer subtype
ER status
Adenocarcinoma Adenocarcinoma Invasive ductal carcinoma Invasive ductal carcinoma Invasive ductal carcinoma Adenocarcinoma
Basal A Basal B Basal B
K K K
Basal A
K
Luminal
C
Luminal (Her2C)
K
See Table 2 for immunocytochemistry details. Negative controls were performed by using adequate serum controls for the primary antibodies (N1698 and N1699, Dako, Carpinteria, CA, USA). Cytoblock sections were counterstained with haematoxylin and permanently mounted. Cells were evaluated for positive expression, distinguishing cytoplasmic expression from membrane expression. Western blot Western blot was performed as described previously (Miranda-Goncalves et al. 2013), using the same antibodies as for immunocytochemistry (antiMCT1, 1:200; anti-MCT4, 1:500 and anti-CD147, 1:500). Goat anti-actin (1:500, sc-1616, Santa Cruz Biotechnology, Santa Cruz, CA, USA) was used as loading control.
Assessment of the effect of lactate transport inhibitors Protein expression assessment Paraffin cytoblock and immunocytochemistry Concentrated cell suspensions were used to prepare paraffin cytoblocks for immunocytochemistry of MCT1, MCT4 and CD147, as described previously (Miranda-Goncalves et al. 2013).
Table 2
IC50 determination Cells were plated in 96-well plates and allowed to adhere overnight in a complete DMEM medium before incubation with a culture medium containing 3–15 mM of CHC, 10–100 mM of quercetin and 50–300 mM of
Details of the immunocytochemical procedure for MCT1, MCT4 and CD147 Primary antibody
Protein
Positive control
MCT1
Colon carcinoma
MCT4
Colon carcinoma
CD147
Colon carcinoma
Antigen retrieval
Peroxidase inactivation
Detection system
R.T.U. VECTASTAIN Elite ABC Kit (Vector Laboratories) Citrate buffer 3% H2O2 in methanol, Ultravision 10 min Detection System, (10 mM, pHZ6) Anti-polyvalent, 98 8C; 20 min HRP (Thermo Fisher Scientific) EDTA (1 mM, pHZ8) 3% H2O2 in methanol, R.T.U. VECTASTAIN 10 min Elite ABC Kit 98 8C; 15 min (Vector Laboratories) Citrate buffer (10 mM, pHZ6) 98 8C; 20 min
0.3% H2O2 in methanol, 30 min
Company (reference)
Dilution and incubation time
Santa Cruz Biotechnology (sc-365501)
1:500, overnight, RT
Santa Cruz Biotechnology (sc-50329)
1:500, 2 h, RT
Santa Cruz Biotechnology (sc-71038)
1:400, overnight, RT
Santa Cruz Biotechnology, Santa Cruz, CA, USA; Thermo Fisher Scientific, Fremont, CA, USA; Vector Laboratories, Burlingame, CA, USA.
http://erc.endocrinology-journals.org DOI: 10.1530/ERC-13-0132
q 2014 Society for Endocrinology Printed in Great Britain
Published by Bioscientifica Ltd.
F Morais-Santos et al.
Research
Lactate transport inhibition in breast cancer cell lines
21:1
30
AUTHOR COPY ONLY
lonidamine. The effect of CHC on total biomass, measured by the Sulpho rhodamine B assay (TOX-6, Sigma–Aldrich), was evaluated after 24 h of treatment, while for quercetin and lonidamine the time of treatment was 48 h. IC50 values were estimated with the GraphPad Prism 5 Software (GraphPad Software, Inc., La Jolla, CA, USA), applying a sigmoidal dose–response (variable slope) nonlinear regression, after logarithmic transformation. Metabolic profiling After reaching confluence, cells of each cell line were incubated with each inhibitor at its IC50 and aliquots of cell culture media were retrieved after 4, 8, 12 and 24 h, assuring confluences similar to the ones observed in the control. Glucose and lactate were quantified as described earlier. A
MCT1
MCT4
Cell proliferation assay Proliferation of cells sensitive to treatment with inhibitors was assessed by bromodeoxyuridine incorporation, after treatment with CHC, quercetin and lonidamine at the respective IC50 (24 h for CHC and 48 h for quercetin and lonidamine), as described previously (Miranda-Goncalves et al. 2013). Cell death assay Cells were treated with CHC for 24 h, and quercetin and lonidamine for 48 h (at the appropriate IC50) and cell death was assessed by simultaneous staining with FITC annexin-V and propidium iodide, as described previously (Miranda-Goncalves et al. 2013). Wound-healing assay Cell migration was assessed by the wound-healing assay, as described previously B
CD147
MCT1 MCT4 20.0 µm
20.0 µm
CD147
20.0 µm
MDA-MB-231
46
M
BD
M
M
A-
M
20.0 µm
A-
20.0 µm
D
20.0 µm
B-
8 23 1 H s5 78 T B M T2 C F- 0 7/ A Sk Z Br 3
Actin
C
20.0 µm
20.0 µm
20.0 µm
BT20
20.0 µm
20.0 µm
20.0 µm
Glucose consumption (µg)
Hs578T
1200
MDA-MB-468 MDA-MB-231 Hs578T BT20 MCF-7/AZ SkBr3
1000 800 600 400 200 00 0
4
8
12
16
20
24
Time (h)
MCF-7/AZ
20.0 µm
20.0 µm
20.0 µm
SkBr3
Lactate production (µg)
Endocrine-Related Cancer
MDA-MB-468
800
MDA-MB-468 MDA-MB-231 Hs578T BT20 MCF-7/AZ SkBr3
600 400 200 0 0
20.0 µm
20.0 µm
4
20.0 µm
8
12
16
20
24
Time (h)
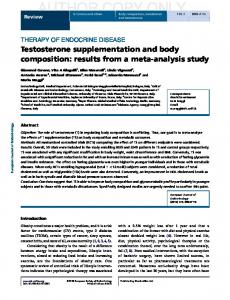
Figure 1 Characterisation of the metabolic profile of the breast cancer cell lines. Immunocytochemical expression of MCT1, MCT4 and CD147 in human breast carcinoma cell lines (scale bars 20 mm) (A). MCT1 (50 kDa), MCT4 (52 kDa) and CD147 (50–60 kDa for the highly glycosylated and 42 kDa for
http://erc.endocrinology-journals.org DOI: 10.1530/ERC-13-0132
q 2014 Society for Endocrinology Printed in Great Britain
the low-glycosylated form) protein expression was detected by western blot in cell lysates (B). Extracellular amounts of glucose and lactate in the different human breast cancer cell lines, over time (4, 8, 12 and 24 h). Values are expressed as meanGS.E.M. (C).
Published by Bioscientifica Ltd.
F Morais-Santos et al.
Research
Lactate transport inhibition in breast cancer cell lines
21:1
31
AUTHOR COPY ONLY
(Miranda-Goncalves et al. 2013). Cells were exposed to half of the IC50 for CHC (to avoid excessive proliferation inhibition and cell death) and of the IC50 concentrations for quercetin and lonidamine. The ‘wounded’ areas were photographed at 0, 12, and 24 h. Invasion assay Cell invasion assay was performed with the sensitive cell lines with invading capacity (MDA-MB-468, MDA-MB-231 and Hs578T), using 24-well BD Biocoat Matrigel Invasion Chambers (BD Biosciences, San Jose, CA, USA), according to the manufacturer’s instructions, as described previously (Miranda-Goncalves et al. 2013). Cells were seeded in a medium containing half of the IC50 for CHC and of the IC50 for quercetin and lonidamine, during 24 h.
Endocrine-Related Cancer
Statistical analysis Data from three independent experiments, each one in triplicate, were stored in GraphPad Prism 5 Software. All conditions were examined for statistical significance using two-tailed Student’s t-test for mean comparison, the threshold for significance being P values !0.05.
Results Cells with higher rates of glucose consumption produce more lactate As depicted in Fig. 1A, membrane expression of MCT1 was only observed in MDA-MB-468, Hs578T, BT20 and, at a very low level, in MCF-7/AZ cell lines, while MCT4 was only clearly expressed at the plasma membrane of MDAMB-231 and SkBr3 cells. CD147 was observed in the plasma membrane of all cell lines. MCT2 expression was not found in any of the cell lines analysed in this study (data not shown). Some intracellular expression was also observed for these markers in some cell lines. Western blot Table 3
analysis confirmed the different levels of expression observed by immunocytochemistry (Fig. 1B). The cell lines studied exhibited different levels of glycolytic metabolism (Fig. 1C). As expected, cells with higher rates of glucose consumption also produced more lactate; MDA-MB-468 and SkBr3 showed the highest glucose consumption rates, followed by Hs578T and MCF-7/AZ, while MDA-MB-231 and BT20 presented the lowest consumption rates. In accordance, MDA-MB-468, SkBr3 and Hs578T produced more lactate than MCF-7/AZ, BT20 and MDA-MB-231 in that order.
Inhibition of lactate transport decreases glucose consumption and lactate production in most glycolytic cells Breast cancer cell lines were treated once with the lactate transport inhibitors CHC, quercetin and lonidamine at increasing concentrations and IC50 values were estimated by evaluating total cell biomass (Table 3). The IC50 values show that MDA-MB-468, MDA-MB-231 and Hs578T cells were sensitive to CHC, quercetin, and lonidamine. MCF-7/AZ cells showed IC50 values only for CHC and lonidamine, while sensitivity to quercetin was not sufficient to estimate the IC50 within the range of concentrations used, and the same was observed for BT20 with all the inhibitors used. SkBr3 showed high IC50 values for both quercetin and lonidamine. To determine whether the induced-inhibitory effect in the different cell lines was due to metabolic disturbance, glucose consumption and lactate production were analysed (Fig. 2). Only MDA-MB-468 and Hs578T cells showed a significant decrease in both glucose consumption and lactate production, after treatment with any of the three inhibitors (Fig. 2A and B respectively). MCF-7/AZ also showed a significant decrease in glucose consumption and lactate production after CHC and lonidamine treatment, but not after quercetin treatment, which is in accordance
IC50 values for CHC, quercetin and lonidamine for each cell line CHC
Cell lines
MDA-MB-468 MDA-MB-231 Hs578T BT20 MCF-7/AZ SkBr3 a
Quercetin
Lonidamine
IC50 value calculated (mM)
IC50 value used (mM)
IC50 value calculated (mM)
IC50 value used (mM)
IC50 value calculated (mM)
IC50 value used (mM)
9.6 5.33 11.45 O15 9.44 12.39
10 5 10 10a 10 10
49.64 40.65 39.88 O100 O100 94.05
50 40 40 50a 50a 50a
95.84 126.1 124.5 O300 123.6 237.8
100 125 125 125a 125 125a
These values do not correspond to the IC50 value. For these cell lines, the highest IC50 value obtained for the other cell lines was used.
http://erc.endocrinology-journals.org DOI: 10.1530/ERC-13-0132
q 2014 Society for Endocrinology Printed in Great Britain
Published by Bioscientifica Ltd.
F Morais-Santos et al.
Research
MDA-MB-468
MDA-MB-231
*#$
CHC
1000
Quercetin
800
Lonidamine
*#$
600 #$
400
#
200 0
1000 800 600 400 200
12
16
20
24
1200
BT20
4
8
12
Glucose consumption(µg)
600
*
* 200 0
600
4
8
12
20
200
24
0
16
20
*$
600
*$
400
*$
200
4
8
12
20
Lonidamine
*#$ *#$ *#$
0
800 600
200
0
8
12
16
20
400 200
Lactate production (µg)
200
4
8
12
16
20
24
24
*#$ 400
*#$
200
4
8
12
16
20
*#$
*#$ 0
24
4
8
800
MCF-7/AZ
600
*$
400 200
*$
*$
12
16
20
24
Time (h)
*$
SkBr3
*
600
* 400
* *
200
0
0
0
20
0 0
800
400
16
600
Time (h)
600
12
Hs578T
600
24
BT20
0
8
800
Time (h) 800
4
Time (h)
Lactate production (µg)
4
* *
400
0 0
24
*
1000
24
Lactate production (µg)
Quercetin
200
16
800 Lactate production (µg)
CHC
20
SkBr3
MDA-MB-231
*#$
16
0 0
24
12
1200
800
MDA-MB-468
400
8
Time (h)
DMSO
600
4
Time (h)
1000
Time (h)
800
*#
400
0 0
Lactate production (µg)
16
MCF-7/AZ
1200
800
400
*#$
800
Time (h)
1000
Lactate production (µg)
1000
0 0
Glucose consumption (µg)
8
4
Time (h)
B
Hs578T
0 0
Glucose consumption (µg)
32
1200
1200 Glucose consumption (µg)
DMSO
Glucose consumption ((µg)
1200
Endocrine-Related Cancer
21:1
AUTHOR COPY ONLY
A Glucose consumption (µg)
Lactate transport inhibition in breast cancer cell lines
0
4
8
Time (h)
12
16
20
24
Time (h)
0
4
8
12
16
20
24
Time (h)
Figure 2 Effects of MCT inhibitors on glycolytic metabolism. Extracellular amounts of consumed glucose (A) and lactate produced (B) in the different human breast cancer cell lines. Cell lines were incubated with the appropriate IC50 for CHC, quercetin and lonidamine for 24 h, and glucose and lactate were
http://erc.endocrinology-journals.org DOI: 10.1530/ERC-13-0132
q 2014 Society for Endocrinology Printed in Great Britain
quantified over time (4, 8, 12 and 24 h). Values are expressed as meanGS.E.M. with P!0.05; *Control (DMSO) vs CHC; #Control (DMSO) vs quercetin and $Control (DMSO) vs lonidamine.
Published by Bioscientifica Ltd.
F Morais-Santos et al.
Research
MDA-MB-468
100
24 M SO
Lactate transport inhibition reduces cancer cell aggressiveness
D
D
D
C H
24
C
M SO
C M SO Q 48 ue h r Lo cet in ni da m in e
0
*
h
0
M SO Q 48 ue h r Lo cet in ni da m in e
20
120
MCF-7/AZ
*
40
20
D
*
60
H
40
120
SkBr3
100
40
40
0
0
24 h
in
SO D
D
Lo
M
ni
da
SO M
m
48
C H C
24 SO M
e
20
h
20
D
*
60
C
*
80
H
*
60
C
80
Percentage BrdU incorporated/control
100
h
Percentage BrdU incorporated/control
*
*
80
C
*
60
Percentage BrdU incorporated/control
100
80
B
D
4 ue 8 h rc et in ni da m in e Q
10
SO
H
M
C
e
C
0
in
48
20
da m
ni Lo
D
M
SO
C
H
h
C
h
0
SkBr3
30
24 h
10
24
SO M D
20
SO
40
Percentage of staining cell population
30
Lo
rc h et in m in e
MCF-7/AZ
40
M
0
da
ni
Lo
ue
Q
SO M D
D
10
48
C H C
M
SO
24
h
0
20
SO
10
* *
*
M
*
20
30
24 h C H C
30
Hs578T
40
D
Percentage of staining cell population
Percentage of staining cell population
MDA-MB-468
40
Percentage of staining cell population
33
Surprisingly, the MDA-MB-231 cell line, with high sensitivity to CHC and quercetin, showed no alterations at the metabolic level after treatment with either inhibitor. Metabolism assay confirmed that half of the IC50 concentration of CHC was also able to significantly inhibit lactate efflux (Supplementary Figure 1A, see section on supplementary data given at the end of this article).
Hs578T
120
h
Percentage BrdU incorporated/control
120
D
21:1
AUTHOR COPY ONLY
A
Endocrine-Related Cancer
Lactate transport inhibition in breast cancer cell lines
Figure 3 Effect of MCT inhibitors on cell proliferation and cell death. Cell lines were treated for 24 h with CHC (IC50/2) and for 48 h with quercetin/ lonidamine (IC50). Cell proliferation (A) was evaluated by bromodeoxyuridine (BrdU) incorporation and cell death (B) by annexin-V/PI. Values are expressed as meanGS.E.M. with *P!0.05 compared with control (DMSO).
with the effect of quercetin on MCF-7/AZ biomass. In accordance with the higher IC50 values determined for quercetin and lonidamine in the SkBr3 cell line, the glycolytic metabolism was only disturbed in this cell line after treatment with CHC. BT20 cells, with a very low sensitivity to the inhibitors, also showed a decrease in lactate production after CHC and quercetin treatment, but with no decrease in glucose consumption. http://erc.endocrinology-journals.org DOI: 10.1530/ERC-13-0132
q 2014 Society for Endocrinology Printed in Great Britain
After assessing the sensitivity to the different inhibitors and the metabolic effects of this inhibition, the effect of the inhibitors was further evaluated for different tumour cell aggressiveness parameters in the most sensitive cells lines and whose metabolism was perturbed. Figure 3A shows that all inhibitors induced a significant decrease in cell proliferation, which was more evident for lonidamine in MDA-MB-468 and Hs578T cells. CHC induced a prominent decrease in the proliferation of MCF-7/AZ and SkBr3 cells. All inhibitors induced a significant increase in cell death in Hs578T cells, while only quercetin induced a significant increase in cell death in MDA-MB-468. Interestingly, for MCF-7/AZ and SkBr3 cell death was not affected by treatment with the inhibitors (Fig. 3B). The influence of lactate transport inhibition on cell migration and invasion was also assessed. Importantly, the three inhibitors induced a significant decrease in cell migration (Fig. 4 and Supplementary Figure 2, see section on supplementary data given at the end of this article). Additionally, both quercetin and lonidamine induced a significant decrease in cell invasion for the two invading cell lines analysed (higher effect for lonidamine), while results on CHC were not consistent, as CHC induced a decrease in MDA-MB-468 invasion and had no effect on Hs578T (Fig. 5 and Supplementary Figure 3, see section on supplementary data given at the end of this article). Downregulation of MCT1 decreases lactate production and cell aggressiveness In order to confirm that the previous results were a consequence of MCT1 activity inhibition, downregulation of MCT1 expression with siRNA was performed in Hs578T cells, which express MCT1 at the plasma membrane. An effective reduction in MCT1 expression was observed upon siMCT1 targeting (84.2%), as well as in CD147 expression (65.5%; Fig. 6A). MCT4 expression levels were not altered Published by Bioscientifica Ltd.
F Morais-Santos et al.
Research
Lactate transport inhibition in breast cancer cell lines
21:1
34
AUTHOR COPY ONLY Hs578T
*
*
80
*
60
*
*
*
40 20
100
* *
60
*
40 20
M
SO
SkBr3
120 100
*
*
80 60 40 20
C H
D
M
SO
C
H
24
C
h 12 SO M D
ni
CHC
C
H da C m in e D M SO 24 h Lo C ni HC da m in e
h
C
Lo
12
DMSO
h
0
SO M D
*
0
0
B
*
20
Percentage of cell migration
*
80
*
40
D
12 h C Q H ue C Lo rce ti ni da n m in e D M SO 24 h Q CH ue C Lo rce ti ni da n m in e
M
100
* *
60
MCF-7/AZ
120
*
80
0
D
Percentage of cell migration
Endocrine-Related Cancer
120
12 h Q CH ue C Lo rce ti ni da n m in e D M SO 24 h Q CH ue C Lo rce ti ni da n m in e
100
Percentage of cell migration
MDA-MB-468
120
SO
Percentage of cell migration
A
Quercetin
Lonidamine
0h
12 h
24 h
Figure 4 Effect of MCT inhibitors on cell migration. Cell migration was evaluated by the wound-healing assay in treated cells over 24 h with half the IC50 for CHC and the IC50 for quercetin and lonidamine. *P!0.05 compared with
control (DMSO; A). Pictures represent Hs578T cell migration captured at 0, 12 and 24 h (scale bars 100 mm; B). Pictures of the remaining cell lines are available in Supplementary Figure 2.
by MCT1 downregulation. Similarly to MCT1 activity inhibition, MCT1 downregulation significantly decreased lactate production after 24 h of silencing; however, glucose levels were not affected (Fig. 6B and C). Importantly, there was a decrease in cell proliferation and migration capacity (Fig. 6D and E), similarly to the results obtained with inhibition of MCT1 activity.
Discussion
http://erc.endocrinology-journals.org DOI: 10.1530/ERC-13-0132
q 2014 Society for Endocrinology Printed in Great Britain
Basal-like tumours have an aggressive clinical behaviour (Sorlie et al. 2001, 2003, Sotiriou et al. 2003) and, in contrast to other molecular subtypes, do not have a specific molecular therapy (Matos et al. 2005, Paredes et al. 2007). This entails the search for new molecular Published by Bioscientifica Ltd.
F Morais-Santos et al.
Research
140 120 100
*
*
80
Hs578T
160
60
*
40 20
140 120 100
*
*
80 60 40 20
e in m da
ni
Q
Lo
C H C
M D
ue
SO
e in m da
ni Lo
C H C Q
ue
rc et in
SO M D
rc et in
0
0
B
100 µm
DMSO Endocrine-Related Cancer
21:1
AUTHOR COPY ONLY MDA-MB-468
160
Percentage of invasive cells
Percentage of invasive cells
A
Lactate transport inhibition in breast cancer cell lines
100 µm
2000 µm
100 µm
Quercetin
CHC
2000 µm
100 µm
2000 µm
Lonidamine
2000 µm
Figure 5 Effect of MCT inhibitors on cell invasion capacity. Cells were treated with half the IC50 (CHC) or the IC50 (quercetin/lonidamine) appropriate to that cell line and inhibitor combination, for 24 h, in matrigel invasion chambers. *P!0.05 compared with control (DMSO; A). Pictures represent Hs578T cell invasion at 24 h (scale bars 100 and 2000 mm; B). Pictures showing MDA-MB-468 are available in Supplementary Figure 3.
targets in this aggressive group of tumours, and, considering the increased expression of MCT1 in basal-like tumours (Pinheiro et al. 2010), as well as recent evidence showing MCTs to be effective anti-cancer targets (Mathupala et al. 2004, Colen et al. 2006, Fang et al. 2006, Sonveaux et al. 2008), MCT1 emerges as a promising therapeutic target that needs to be further explored in breast cancer. In this work, we analysed MCT1 and MCT4 expression, as well as the expression of other relevant proteins in cancer metabolism, in a variety of human breast cancer cell lines. MCT1 was strongly expressed at plasma membrane in MDA-MB-468, Hs578T and BT20 (basal-like subtype cells), in accordance with our findings http://erc.endocrinology-journals.org DOI: 10.1530/ERC-13-0132
q 2014 Society for Endocrinology Printed in Great Britain
35
for human breast carcinoma samples (Pinheiro et al. 2010). In MDA-MB-231, also basal-like subtype cells, MCT1 was not detected, as described by others (Asada et al. 2003, Gallagher et al. 2007, Hussien & Brooks 2011), and the same was observed for the Her2-positive subtype cell line (SkBr3). In contrast, MCT4 was strongly expressed at the plasma membrane in MDA-MB-231, as described by others (Hussien & Brooks 2011), as well as in SkBr3. Therefore, it seems that the plasma expression of these two isoforms is mutually exclusive in breast cancer, suggesting different mechanisms of regulation. Importantly, we should not ignore the presence of intracellular expression of MCTs, especially MCT4. Actually, a recent study has shown mitochondrial expression of MCT2 and MCT4 in two breast cancer cell lines (MCF-7 and MDA-MB-231), indicating a role of MCTs in the mitochondria (Hussien & Brooks 2011). Additionally, two other studies have described a mitochondrial pyruvate carrier, which is a different protein from the MCTs (Bricker et al. 2012, Herzig et al. 2012). However, additional studies are required to elucidate if MCTs are working together, in parallel, or performing the transport of different substrates. Nevertheless, considering that CHC is incapable of crossing the plasma membrane, acting only outside the cell (Colen et al. 2006, 2011), when using this inhibitor, we believe that we are evaluating only the inhibition of MCT1 activity at the plasma membrane. For comparison with CHC-induced effects and to validate our results concerning lactate transport inhibition in breast cancer cells, we used additional drugs described as lactate transport inhibitors, quercetin and lonidamine. Our results show that the human breast cancer cells studied have different responses to the inhibitors and that the underlying mechanisms seem to vary among them. In fact, the most sensitive cell line to both CHC and quercetin, MDA-MB-231, besides being negative for MCT1 and producing less lactate than the other lines, showed no alterations in glucose consumption or lactate production after treatment, indicating that other mechanisms, besides lactate transport inhibition, may account for the effects of CHC and quercetin on this cell line. In contrast, MDAMB-468 and Hs578T, both basal-like-subtype cell lines with MCT1 positive plasma membrane expression and a more pronounced glycolytic phenotype, suffered a significant decrease in glucose consumption and lactate production, accompanied by a decrease in total biomass after exposure to the lactate transporter inhibitors. This was the expected result in a highly glycolytic cell line after MCT1 inhibition. The blockade of lactate efflux probably led to the accumulation of lactate in the cytoplasm, arresting glycolysis with Published by Bioscientifica Ltd.
F Morais-Santos et al.
Research
36
* 50
Percentage of migration
100
100
*
80 60 40 20
0
h
si M C T1
am bl e
Sc
ra
m bl e
24
si M C T1
si M C T1
0 m bl e
m bl e
0
120
ra
200
150
Sc
400
Percentage of BrdU incorporated
*
E
si M C T1
ra
600
ra
0
800
Sc
500
7
0
1000
D
Lactate production (µg/biomass)
84·2%
20
NS
Sc
40
1500
si M C T1
65·5%
C
m bl e
60
Glucose consumption (µg/biomass)
80
C D 14
Actin
100
M C T4
CD147
120
M C T1
MCT4
B
(Protein levels/β-actin)/scramble (%)
MCT1
21:1
AUTHOR COPY ONLY
Sc r
A
Lactate transport inhibition in breast cancer cell lines
Endocrine-Related Cancer
Figure 6 Downregulation of MCT1 in Hs578T. Cells were transfected with scramble or siMCT1, and expression of MCT1, MCT4 and CD147 was evaluated after 24 h (A). Effect of MCT1 downregulation on cell metabolism (B and C),
proliferation (D) and migration (E). *P!0.05 siMCT1 cells compared with scramble; NS, not significant.
subsequent decrease in glucose uptake. Unexpectedly, SkBr3 was sensitive to the inhibitor-induced decrease in total biomass in a metabolic-dependent manner (although at a lower magnitude than MDA-MB-468 or Hs578T and not for the three inhibitors), albeit having undetectable MCT1 expression at the plasma membrane. MCT4 could be another CHC target; however, Ki values for MCT4 are five to ten times higher than that for MCT1 (Halestrap 2012), ranging from 50 to 100 mM, concentrations not reached in the present assays. Additional targets, also affecting cancer cell metabolism, should be behind these effects. Intriguingly, BT20 basal-like-subtype cells, although highly positive for MCT1, were insensitive to treatment with all inhibitors. The reason for this insensitivity remains unclear. This may be due to the low proliferative rate of this cell line, accompanied by the low glycolytic metabolism. These cells could also rely on an alternative source of energy present in the culture medium that is also a substrate for MCT1, such as pyruvate. We evaluated extracellular lactate accumulation and these lactate concentrations could be a result of both lactate production and removal. However, in the presence of glucose, these cells preferred to consume glucose over lactate, some cell lines even being not able to consume lactate. Although the effect on cell metabolism is extremely important for understanding the mechanisms of action of the different inhibitors, it was also crucial to unveil the contribution of MCT inhibition to other aggressiveness parameters, such as cell proliferation, death, migration and invasion. Importantly, we observed that the three inhibitors were able to inhibit proliferation, migration and invasion, as well as to induce cell death in breast cancer cells, this effect being more pronounced in
MDA-MB-468 cells. As inhibition of MCTs will affect both lactate and proton efflux, intracellular accumulation of lactate will lead to glycolysis arrest and the consequent decrease in cell proliferation, as well as cell death induced by intracellular acidification. Also, the decreased migration and invasion capacity after lactate transport inhibition are in accordance with the contribution of both lactate and acidic microenvironment to the increased migration and invasiveness phenotypes of cancer cells (Walenta et al. 2002, Rofstad et al. 2006). In general, we could observe that CHC has a broader effect on the behaviour of the breast cancer cells used in this study. Although used to target the same key metabolic proteins (MCTs), CHC, quercetin and lonidamine seem to act by different mechanisms, as a particular cell line could respond differently to each inhibitor. In fact, other metabolic targets have been described for these inhibitors that could mediate the breast cancer cell-altered phenotype associated with metabolic disturbance. Although being the most commonly used MCT1 inhibitor, CHC has also been described as a potent inhibitor of the mitochondrial pyruvate transporter (Halestrap & Denton 1974); however, permeability studies carried out by others show that CHC is not internalised by U-87MG glioma cells (Colen et al. 2006). Additionally, CHC has also been identified as an inhibitor of the anion exchanger 1 (Deuticke 1982), an important pH regulator that is responsible for ClK/HCOK 3 membrane exchange (Kopito 1990). Different effects have been identified as mediating the antitumour activity of quercetin, including cell cycle arrest (Yang et al. 2006) and apoptosis (Granado-Serrano et al. 2006, Yang et al. 2006), as well as inhibition of the phosphatidylinositol 3-kinase/Akt pathway
http://erc.endocrinology-journals.org DOI: 10.1530/ERC-13-0132
q 2014 Society for Endocrinology Printed in Great Britain
Published by Bioscientifica Ltd.
Research
F Morais-Santos et al.
Lactate transport inhibition in breast cancer cell lines
21:1
Endocrine-Related Cancer
AUTHOR COPY ONLY
(Granado-Serrano et al. 2006). However, we observed that quercetin only affected the MCT1-positive breast cancer cells at the metabolic level with no disturbance in the metabolic behaviour of MCT1-negative breast cancer cell lines, indicating some preference for MCT inhibition. Regarding lonidamine, although results indicate that inhibition of lactate transport and its accumulation are the major metabolic changes induced by lonidamine (Ben-Horin et al. 1995), an additional glycolytic protein, hexokinase II, can also be targeted (Floridi et al. 1981). To better understand the effect of the MCT inhibitors used in this work, downregulation of MCT1 was carried out in Hs578T cells, which displays MCT1 expression at plasma membrane. In a pattern consistent with the activity inhibition results, MCT1 downregulation decreased proliferation and migration probably due to the decrease in lactate production. Other studies corroborate these results, providing evidence for the specificity of CHC to inhibit MCT1 and the importance of MCT1 downregulation (Mathupala et al. 2004, Colen et al. 2011, Miranda-Goncalves et al. 2013). In this study, by targeting lactate efflux, we took a step forward to support targeting metabolism as an effective way to control cancer and, in particular, to considering the development of therapeutic approaches targeting MCT1 to treat basal-like breast tumours.
Supplementary data This is linked to the online version of the paper at http://dx.doi.org/10.1530/ ERC-13-0132.
Declaration of interest The authors declare that there is no conflict of interest that could be perceived as prejudicing the impartiality of the research reported.
Funding This work was supported by the Fundac¸a˜o para a Cieˆncia e a Tecnologia (FCT) grant ref. PTDC/SAU-FCF/104347/2008, under the scope of ‘Programa Operacional Tema´tico Factores de Competitividade’ (COMPETE) of ‘Quadro Comunita´rio de Apoio III’ and co-financed by the Fundo Europeu De Desenvolvimento Regional (FEDER).
Author contribution statement F Baltazar and C Pinheiro contributed equally to this work.
References Asada K, Miyamoto K, Fukutomi T, Tsuda H, Yagi Y, Wakazono K, Oishi S, Fukui H, Sugimura T & Ushijima T 2003 Reduced expression of GNA11
http://erc.endocrinology-journals.org DOI: 10.1530/ERC-13-0132
q 2014 Society for Endocrinology Printed in Great Britain
37
and silencing of MCT1 in human breast cancers. Oncology 64 380–388. (doi:10.1159/000070297) Belt JA, Thomas JA, Buchsbaum RN & Racker E 1979 Inhibition of lactate transport and glycolysis in Ehrlich ascites tumor cells by bioflavonoids. Biochemistry 18 3506–3511. (doi:10.1021/bi00583a011) Ben-Horin H, Tassini M, Vivi A, Navon G & Kaplan O 1995 Mechanism of action of the antineoplastic drug lonidamine: 31P and 13C nuclear magnetic resonance studies. Cancer Research 55 2814–2821. Ben-Yoseph O, Lyons JC, Song CW & Ross BD 1998 Mechanism of action of lonidamine in the 9L brain tumor model involves inhibition of lactate efflux and intracellular acidification. Journal of Neuro-Oncology 36 149–157. (doi:10.1023/A:1005819604858) Bricker DK, Taylor EB, Schell JC, Orsak T, Boutron A, Chen YC, Cox JE, Cardon CM, Van Vranken JG, Dephoure N et al. 2012 A mitochondrial pyruvate carrier required for pyruvate uptake in yeast, Drosophila, and humans. Science 337 96–100. (doi:10.1126/science.1218099) Colen CB, Seraji-Bozorgzad N, Marples B, Galloway MP, Sloan AE & Mathupala SP 2006 Metabolic remodeling of malignant gliomas for enhanced sensitization during radiotherapy: an in vitro study. Neurosurgery 59 1313–1323. (doi:10.1227/01.NEU.0000249218.65332.BF) Colen CB, Shen Y, Ghoddoussi F, Yu P, Francis TB, Koch BJ, Monterey MD, Galloway MP, Sloan AE & Mathupala SP 2011 Metabolic targeting of lactate efflux by malignant glioma inhibits invasiveness and induces necrosis: an in vivo study. Neoplasia 13 620–632. (doi:10.1593/ neo.11134) Deuticke B 1982 Monocarboxylate transport in erythrocytes. Journal of Membrane Biology 70 89–103. (doi:10.1007/BF01870219) Fang J, Quinones QJ, Holman TL, Morowitz MJ, Wang Q, Zhao H, Sivo F, Maris JM & Wahl ML 2006 The HC-linked monocarboxylate transporter (MCT1/SLC16A1): a potential therapeutic target for high-risk neuroblastoma. Molecular Pharmacology 70 2108–2115. (doi:10.1124/mol.106.026245) Fischer K, Hoffmann P, Voelkl S, Meidenbauer N, Ammer J, Edinger M, Gottfried E, Schwarz S, Rothe G, Hoves S et al. 2007 Inhibitory effect of tumor cell-derived lactic acid on human T cells. Blood 109 3812–3819. (doi:10.1182/blood-2006-07-035972) Floridi A, Paggi MG, Marcante ML, Silvestrini B, Caputo A & De Martino C 1981 Lonidamine, a selective inhibitor of aerobic glycolysis of murine tumor cells. Journal of the National Cancer Institute 66 497–499. (doi:10.1093/jnci/66.3.497) Gallagher SM, Castorino JJ, Wang D & Philp NJ 2007 Monocarboxylate transporter 4 regulates maturation and trafficking of CD147 to the plasma membrane in the metastatic breast cancer cell line MDA-MB-231. Cancer Research 67 4182–4189. (doi:10.1158/0008-5472. CAN-06-3184) Granado-Serrano AB, Martin MA, Bravo L, Goya L & Ramos S 2006 Quercetin induces apoptosis via caspase activation, regulation of Bcl-2, and inhibition of PI-3-kinase/Akt and ERK pathways in a human hepatoma cell line (HepG2). Journal of Nutrition 136 2715–2721. Halestrap AP 2012 The monocarboxylate transporter family – structure and functional characterization. IUBMB Life 64 1–9. (doi:10.1002/iub.573) Halestrap AP & Denton RM 1974 Specific inhibition of pyruvate transport in rat liver mitochondria and human erythrocytes by a-cyano-4hydroxycinnamate. Biochemical Journal 138 313–316. Halestrap AP & Meredith D 2004 The SLC16 gene family – from monocarboxylate transporters (MCTs) to aromatic amino acid transporters and beyond. Pflu¨gers Archiv: European Journal of Physiology 447 619–628. (doi:10.1007/s00424-003-1067-2) Herzig S, Raemy E, Montessuit S, Veuthey JL, Zamboni N, Westermann B, Kunji ER & Martinou JC 2012 Identification and functional expression of the mitochondrial pyruvate carrier. Science 337 93–96. (doi:10.1126/ science.1218530) Hussien R & Brooks GA 2011 Mitochondrial and plasma membrane lactate transporter and lactate dehydrogenase isoform expression in breast cancer cell lines. Physiological Genomics 43 255–264. (doi:10.1152/ physiolgenomics.00177.2010)
Published by Bioscientifica Ltd.
Research
F Morais-Santos et al.
Lactate transport inhibition in breast cancer cell lines
21:1
Endocrine-Related Cancer
AUTHOR COPY ONLY
Jadvar H, Alavi A & Gambhir SS 2009 18F-FDG uptake in lung, breast, and colon cancers: molecular biology correlates and disease characterization. Journal of Nuclear Medicine 50 1820–1827. (doi:10.2967/ jnumed.108.054098) Jones NP & Schulze A 2012 Targeting cancer metabolism – aiming at a tumour’s sweet-spot. Drug Discovery Today 17 232–241. (doi:10.1016/ j.drudis.2011.12.017) Kirk P, Wilson MC, Heddle C, Brown MH, Barclay AN & Halestrap AP 2000 CD147 is tightly associated with lactate transporters MCT1 and MCT4 and facilitates their cell surface expression. EMBO Journal 19 3896–3904. (doi:10.1093/emboj/19.15.3896) Kopito RR 1990 Molecular biology of the anion exchanger gene family. International Review of Cytology 123 177–199. (doi:10.1016/S00747696(08)60674-9) Koukourakis MI, Giatromanolaki A, Harris AL & Sivridis E 2006 Comparison of metabolic pathways between cancer cells and stromal cells in colorectal carcinomas: a metabolic survival role for tumorassociated stroma. Cancer Research 66 632–637. (doi:10.1158/00085472.CAN-05-3260) Koukourakis MI, Giatromanolaki A, Bougioukas G & Sivridis E 2007 Lung cancer: a comparative study of metabolism related protein expression in cancer cells and tumor associated stroma. Cancer Biology & Therapy 6 1476–1479. (doi:10.4161/cbt.6.9.4635) Mathupala SP, Parajuli P & Sloan AE 2004 Silencing of monocarboxylate transporters via small interfering ribonucleic acid inhibits glycolysis and induces cell death in malignant glioma: an in vitro study. Neurosurgery 55 1410–1419. (doi:10.1227/01.NEU.0000143034. 62913.59) Mathupala SP, Colen CB, Parajuli P & Sloan AE 2007 Lactate and malignant tumors: a therapeutic target at the end stage of glycolysis. Journal of Bioenergetics and Biomembranes 39 73–77. (doi:10.1007/ s10863-006-9062-x) Matos I, Dufloth R, Alvarenga M, Zeferino LC & Schmitt F 2005 p63, cytokeratin 5, and P-cadherin: three molecular markers to distinguish basal phenotype in breast carcinomas. Virchows Archiv 447 688–694. (doi:10.1007/s00428-005-0010-7) Miranda-Goncalves V, Honavar M, Pinheiro C, Martinho O, Pires MM, Pinheiro C, Cordeiro M, Bebiano G, Costa P, Palmeirim I et al. 2013 Monocarboxylate transporters (MCTs) in gliomas: expression and exploitation as therapeutic targets. Neuro-Oncology 15 172–188. (doi:10.1093/neuonc/nos298) Neve RM, Chin K, Fridlyand J, Yeh J, Baehner FL, Fevr T, Clark L, Bayani N, Coppe JP, Tong F et al. 2006 A collection of breast cancer cell lines for the study of functionally distinct cancer subtypes. Cancer Cell 10 515–527. (doi:10.1016/j.ccr.2006.10.008) de Oliveira AT, Pinheiro C, Longatto-Filho A, Brito MJ, Martinho O, Matos D, Carvalho AL, Vazquez VL, Silva TB, Scapulatempo C et al. 2012 Co-expression of monocarboxylate transporter 1 (MCT1) and its chaperone (CD147) is associated with low survival in patients with gastrointestinal stromal tumors (GISTs). Journal of Bioenergetics and Biomembranes 44 171–178. (doi:10.1007/s10863-012-9408-5) Paredes J, Lopes N, Milanezi F & Schmitt FC 2007 P-cadherin and cytokeratin 5: useful adjunct markers to distinguish basal-like ductal carcinomas in situ. Virchows Archiv 450 73–80. (doi:10.1007/s00428006-0334-y) Pinheiro C, Longatto-Filho A, Ferreira L, Pereira SM, Etlinger D, Moreira MA, Jube LF, Queiroz GS, Schmitt F & Baltazar F 2008a Increasing expression of monocarboxylate transporters 1 and 4 along progression to invasive cervical carcinoma. International Journal of Gynecological Pathology 27 568–574. (doi:10.1097/PGP. 0b013e31817b5b40)
Pinheiro C, Longatto-Filho A, Scapulatempo C, Ferreira L, Martins S, Pellerin L, Rodrigues M, Alves VA, Schmitt F & Baltazar F 2008b Increased expression of monocarboxylate transporters 1, 2, and 4 in colorectal carcinomas. Virchows Archiv 452 139–146. (doi:10.1007/ s00428-007-0558-5) Pinheiro C, Longatto-Filho A, Simoes K, Jacob CE, Bresciani CJ, Zilberstein B, Cecconello I, Alves VA, Schmitt F & Baltazar F 2009 The prognostic value of CD147/EMMPRIN is associated with monocarboxylate transporter 1 co-expression in gastric cancer. European Journal of Cancer 45 2418–2424. (doi:10.1016/j.ejca.2009.06.018) Pinheiro C, Albergaria A, Paredes J, Sousa B, Dufloth R, Vieira D, Schmitt F & Baltazar F 2010 Monocarboxylate transporter 1 is up-regulated in basal-like breast carcinoma. Histopathology 56 860–867. (doi:10.1111/ j.1365-2559.2010.03560.x) Pinheiro C, Sousa B, Albergaria A, Paredes J, Dufloth R, Vieira D, Schmitt F & Baltazar F 2011 GLUT1 and CAIX expression profiles in breast cancer correlate with adverse prognostic factors and MCT1 overexpression. Histology and Histopathology 26 1279–1286. Pinheiro C, Longatto-Filho A, Azevedo-Silva J, Casal M, Schmitt FC & Baltazar F 2012 Role of monocarboxylate transporters in human cancers: state of the art. Journal of Bioenergetics and Biomembranes 44 127–139. (doi:10.1007/s10863-012-9428-1) Pouyssegur J, Dayan F & Mazure NM 2006 Hypoxia signalling in cancer and approaches to enforce tumour regression. Nature 441 437–443. (doi:10.1038/nature04871) Rofstad EK, Mathiesen B, Kindem K & Galappathi K 2006 Acidic extracellular pH promotes experimental metastasis of human melanoma cells in athymic nude mice. Cancer Research 66 6699–6707. (doi:10.1158/0008-5472.CAN-06-0983) Sonveaux P, Vegran F, Schroeder T, Wergin MC, Verrax J, Rabbani ZN, De Saedeleer CJ, Kennedy KM, Diepart C, Jordan BF et al. 2008 Targeting lactate-fueled respiration selectively kills hypoxic tumor cells in mice. Journal of Clinical Investigation 118 3930–3942. (doi:10.1172/JCI36843) Sorlie T, Perou CM, Tibshirani R, Aas T, Geisler S, Johnsen H, Hastie T, Eisen MB, van de Rijn M, Jeffrey SS et al. 2001 Gene expression patterns of breast carcinomas distinguish tumor subclasses with clinical implications. PNAS 98 10869–10874. (doi:10.1073/pnas.191367098) Sorlie T, Tibshirani R, Parker J, Hastie T, Marron JS, Nobel A, Deng S, Johnsen H, Pesich R, Geisler S et al. 2003 Repeated observation of breast tumor subtypes in independent gene expression data sets. PNAS 100 8418–8423. (doi:10.1073/pnas.0932692100) Sotiriou C, Neo SY, McShane LM, Korn EL, Long PM, Jazaeri A, Martiat P, Fox SB, Harris AL & Liu ET 2003 Breast cancer classification and prognosis based on gene expression profiles from a population-based study. PNAS 100 10393–10398. (doi:10.1073/pnas.1732912100) Stern R, Shuster S, Neudecker BA & Formby B 2002 Lactate stimulates fibroblast expression of hyaluronan and CD44: the Warburg effect revisited. Experimental Cell Research 276 24–31. (doi:10.1006/excr.2002. 5508) Walenta S, Schroeder T & Mueller-Klieser W 2002 Metabolic mapping with bioluminescence: basic and clinical relevance. Biomolecular Engineering 18 249–262. (doi:10.1016/S1389-0344(01)00107-1) Wang Q & Morris ME 2007 Flavonoids modulate monocarboxylate transporter-1-mediated transport of g-hydroxybutyrate in vitro and in vivo. Drug Metabolism and Disposition 35 201–208. (doi:10.1124/ dmd.106.012369) Yang JH, Hsia TC, Kuo HM, Chao PD, Chou CC, Wei YH & Chung JG 2006 Inhibition of lung cancer cell growth by quercetin glucuronides via G2/M arrest and induction of apoptosis. Drug Metabolism and Disposition 34 296–304. (doi:10.1124/dmd.105.005280)
Received in final form 23 October 2013 Accepted 30 October 2013 Made available online as an Accepted Preprint 30 October 2013
http://erc.endocrinology-journals.org DOI: 10.1530/ERC-13-0132
q 2014 Society for Endocrinology Printed in Great Britain
38
Published by Bioscientifica Ltd.