Author's personal copy Atmospheric Research 123 (2013) 2–16
Contents lists available at SciVerse ScienceDirect
Atmospheric Research journal homepage: www.elsevier.com/locate/atmos
Progress and challenges with Warn-on-Forecast David J. Stensrud a,⁎, Louis J. Wicker a, Ming Xue c, Daniel T. Dawson II a,b, Nusrat Yussouf a,b, Dustan M. Wheatley a,b, Therese E. Thompson a,b, Nathan A. Snook c, Travis M. Smith a,b, Alexander D. Schenkman c, Corey K. Potvin a, Edward R. Mansell a, Ting Lei c, Kristin M. Kuhlman a,b, Youngsun Jung c, Thomas A. Jones a,b, Jidong Gao a, Michael C. Coniglio a, Harold E. Brooks a, Keith A. Brewster c a b c
NOAA/National Severe Storms Laboratory, Norman, OK USA Cooperative Institute for Mesoscale Meteorological Studies, University of Oklahoma, Norman, OK USA Center for Analysis and Prediction of Storms, University of Oklahoma, Norman, OK USA
a r t i c l e
i n f o
Article history: Received 13 January 2012 Received in revised form 4 April 2012 Accepted 10 April 2012 Keywords: Warnings Real-time analyses Ensemble forecasts
a b s t r a c t The current status and challenges associated with two aspects of Warn-on-Forecast—a National Oceanic and Atmospheric Administration research project exploring the use of a convective-scale ensemble analysis and forecast system to support hazardous weather warning operations—are outlined. These two project aspects are the production of a rapidlyupdating assimilation system to incorporate data from multiple radars into a single analysis, and the ability of short-range ensemble forecasts of hazardous convective weather events to provide guidance that could be used to extend warning lead times for tornadoes, hailstorms, damaging windstorms and flash floods. Results indicate that a three-dimensional variational assimilation system, that blends observations from multiple radars into a single analysis, shows utility when evaluated by forecasters in the Hazardous Weather Testbed and may help increase confidence in a warning decision. The ability of short-range convective-scale ensemble forecasts to provide guidance that could be used in warning operations is explored for five events: two tornadic supercell thunderstorms, a macroburst, a damaging windstorm and a flash flood. Results show that the ensemble forecasts of the three individual severe thunderstorm events are very good, while the forecasts from the damaging windstorm and flash flood events, associated with mesoscale convective systems, are mixed. Important interactions between mesoscale and convective-scale features occur for the mesoscale convective system events that strongly influence the quality of the convective-scale forecasts. The development of a successful Warn-on-Forecast system will take many years and require the collaborative efforts of researchers and operational forecasters to succeed. Published by Elsevier B.V.
Contents 1. 2. 3. 4.
Introduction . . . . . . . . . . . . . . . . . . . . Improved real-time analyses of severe weather events Ensemble forecasts of hazardous and severe weather . Progress toward overcoming challenges to a successful
. . . . . . . . . . . . . . . . . . . . . . . . . . . Warn-on-Forecast
. . . .
. . . .
. . . .
. . . .
. . . .
. . . .
. . . .
. . . .
. . . .
. . . .
. . . .
. . . .
⁎ Corresponding author at: NOAA/NSSL, National Weather Center, 120 David L. Boren Blvd., Norman, OK 73072, USA. E-mail address:
[email protected] (D.J. Stensrud). 0169-8095/$ – see front matter. Published by Elsevier B.V. doi:10.1016/j.atmosres.2012.04.004
. . . .
. . . .
. . . .
. . . .
. . . .
. . . .
. . . .
. . . .
. . . .
. . . .
. . . .
. . . .
. . . .
. . 3 . . 3 . . 4 . 12
Author's personal copy D.J. Stensrud et al. / Atmospheric Research 123 (2013) 2–16
5. Discussion. . . . . . . . . . . . . . . . . . . . . . . . . . . . . . . . . . . . . . . . . . . . . . . . . . . . . . . . Acknowledgments . . . . . . . . . . . . . . . . . . . . . . . . . . . . . . . . . . . . . . . . . . . . . . . . . . . . . . References . . . . . . . . . . . . . . . . . . . . . . . . . . . . . . . . . . . . . . . . . . . . . . . . . . . . . . . . . .
1. Introduction The United States National Weather Service (NWS) issues warnings when there is a threat to life and property from weather events. A warning is an urgent call for the public to take action as a hazardous weather or hydrologic event is underway, is imminent, or is very likely to develop in their vicinity. Warnings are the end result of a sequence of actions taken by NWS forecasters to inform the public of a heightened probability of severe and hazardous weather that often begins days in advance of the event. Improvements in warnings over the past few decades, along with better communication and societal response, have helped to reduce fatalities from hazardous weather events in the United States (Brooks and Doswell, 2002; Pielke and Carbone, 2002; Simmons and Sutter, 2005, 2011). While warnings span a large spatial and temporal range, from hurricane warnings issued days in advance over coastal zones 500 km in length to tornado warnings issued an average of 14 min in advance in 2010 for much smaller areas, this discussion focuses on warnings associated with convectivescale weather events—tornado, thunderstorm and flash flood warnings. Tornado warnings in the United States started in 1953 and today over 4000 tornado warnings typically are issued each year (Simmons and Sutter, 2011). Warnings are issued when a threat is indicated by radar observations, reported by spotters, or deemed imminent based upon NWS forecaster knowledge of the storm environment, past storm behavior and other environmental clues. This warning paradigm is called warn-on-detection, due to the dominant role of radar and spotter observations to detect the threat prior to a warning being issued. The length of time between when the warning is issued and the event occurs is called lead time, and
3
15 15 15
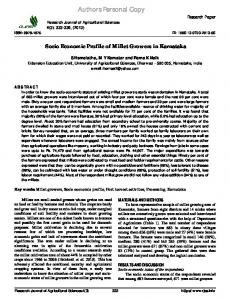
is related to the time scale for which a detectable signature appears in radar observations prior to the event. The average lead time for tornado warnings has increased from 3 min in 1978 to 14 min in 2011, a clear indication of the success of the warning program. However, further analysis of tornado warnings between 1986 and 2006 indicates that the average warning lead time for all events in which lead time is positive hovers around 17 min for all years (Fig. 1). This result indicates that the improvement in average warning lead time for all tornado warnings is mainly due to an improved probability of detection, which increased from 20% in 1978 to its current value that hovers around 75%. At the same time, the false alarm ratio has decreased from 90% in 1978 to below 75% in 2011. The number of misclassification errors—missed events and false alarms—is, in part, a product of the threshold for the weight of evidence needed for forecasters to issue a warning (Brooks, 2004). Lowering the threshold will increase both detections and false alarms, while improving the quality of information available to forecasters could reduce both misclassifications. The lead time results suggest that it will be very difficult to extend tornado warning lead time beyond approximately 17 min using the current warn-on-detection and decisionmaking paradigms. To further reduce the loss of life, injury and the economic costs of high-impact weather events, a different approach to convective-scale warnings will be needed to extend tornado warning lead times well beyond 20 min. Warn-on-Forecast is a new warning paradigm being studied in a NOAA research and development project. The goal of Warnon-Forecast is to extend severe weather warning lead times by incorporating forecasts from a convection-allowing ensemble modeling system into the warning decision process (Stensrud et al., 2009). Research results over the past decade suggest that a convective-scale Warn-on-Forecast paradigm, in which an ensemble of numerical forecasts (initialized using radar observations) provides warning guidance, could be used to extend tornado and other hazardous weather warning lead times. An initial step in the development of such a Warn-onForecast system is to improve analyses of convective-scale weather phenomena from the available observations. Thus, the current status of real-time testing of an initial improved analysis capability for use in the warning process is discussed in Section 2. Section 3 surveys several cases in which the ability to predict hazardous weather events using a convection-allowing ensemble modeling system is examined. Progress toward overcoming the challenges to a Warn-on-Forecast paradigm is outlined in Section 4 followed by a discussion in Section 5. 2. Improved real-time analyses of severe weather events
Fig. 1. Annual, national mean lead time for tornado warnings issued by the US National Weather Service. Red line considers only those warnings issued prior to occurrence of a tornado in the warned area. Black line assigns a lead time of 0 for any tornado that does not have a warning issued before the tornado occurs.
Forecasters examine real-time Doppler radar observations from multiple radars, other remote sensing tools, severe weather detection algorithms, spotter input, and use their considerable experience and situational awareness to issue hazardous weather warnings. Escalating data flow rates from these sensors
Author's personal copy 4
D.J. Stensrud et al. / Atmospheric Research 123 (2013) 2–16
and applications, however, make it challenging for forecasters to make the best use of all the available data in warning operations as the data sets often need to be interrogated independently. Thus, techniques to integrate this large volume of data into products that are dynamically consistent with the equations of motion, and can be interrogated more efficiently, are being explored. One such technique under investigation as part of the Warn-on-Forecast project uses a dynamically-adaptive threedimensional variational data assimilation (3DVAR) system (Gao et al., 2002, 2003, 2004; Hu et al., 2006) to incorporate data from multiple radars into a single analysis. It is believed that such an analysis system could greatly assist warning operations by providing forecasters with a single analysis that incorporates data from all the available observational platforms, thereby improving data quality while also yielding additional information not directly available from any single observation platform. The 3DVAR system, designed especially for storm-scale data assimilation, uses a recursive filter (Purser et al., 2003) with a mass continuity equation and other constraints that are incorporated into a cost function, yielding physically-consistent, three-dimensional analyses of the wind components and other model variables. Multiple analysis passes are used with different spatial influence scales to accurately represent intermittent convective storms, while the quality control steps also are very important to improving the quality of the analyzed radial velocity and reflectivity data. These 3DVAR analyses are available every 5 min during the Spring Experiments of 2009–2011 for the Experimental Warning Program of the NOAA Hazardous Weather Testbed (HWT). The analysis domains are 200 km × 200 km with 1 km horizontal grid spacing and the domain location can be either determined by the forecasters or are automatically located over regions of high radar reflectivity. The 3DVAR system uses the North American Mesoscale (NAM) model forecasts, interpolated to the analysis time, as background and then blends in radar observations of radial velocity from all NWS radars located within 400 km of the domain center. Each analysis typically uses 3 to 6 radars and requires 2–3 min of computer time to complete on a modest computer system. The results of the analysis are then provided to the forecasters using the Weather Decision Support System—Integrated Information (WDSS-II; Lakshmanan et al., 2007). One powerful aspect of the 3DVAR system is that it provides additional information, such as vertical velocity, that is not available from the raw Doppler radar observations. Modifications of this 3DVAR system to use hourly updated analyses and forecasts as background (e.g., Benjamin et al., 2004) and also to assimilate radar reflectivity observations allow for the potential for improved analyses and new information on hydrometeor types in future experiments (Gao and Stensrud, 2012). Results from using the 3DVAR analyses during real-time tests in the HWT (Smith et al., 2010) in 2010 and 2011 indicate that forecasters find the vertical vorticity and updraft products to be most useful, often using these products to increase the confidence in a warning decision (Kuhlman et al., 2012). This is especially true when the storm is supercellular or in close proximity to one of the radars used in the analysis. In addition, forecasters and researchers observed that data fields unique to the 3DVAR analysis, but not directly available in the radar observations, may be indirectly evaluated using independent
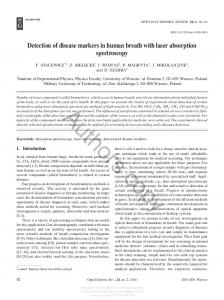
data fields. For example, a radar reflectivity-based hail swath— Maximum Expected Size of Hail (MESH; Ortega et al., 2009) for the 4-hour period from 1900 to 2300 UTC on 16 May 2010—is compared to the trend of updraft intensity for the same time period (Fig. 2). Strong updraft pulses appear to match the MESH algorithm and surface observations of larger hail sizes. Even though large hail is not detected directly by the 3DVAR assimilation, the derived updraft field may be correlated to the production of very large hail. Future studies will attempt to quantitatively assess this relationship on a large number of severe hail events. This assessment of a single analysis tool in the HWT represents an important component of the Warn-onForecast program, as early feedback from operational forecasters allows for much better and timely refinement of strategies and products. 3. Ensemble forecasts of hazardous and severe weather One of the goals of the Warn-on-Forecast program is to demonstrate the utility of short-range ensemble forecasts of hazardous convective weather events to provide guidance that could be used to extend warning lead times. Thus, a number of hazardous weather events are being examined, with a focus on determining the efficacy of various data assimilation methods, defining which model physical process schemes provide the most reasonable results, and the assessment of probabilistic hazard information. Results from five different hazardous weather events are described: the 8 May 2003 Oklahoma City (OKC), Oklahoma, tornadic supercelll; the 4–5 May 2007 Greensburg, Kansas, tornadic supercell; the 15 June 2011 Norman, Oklahoma, damaging macroburst event; the 4 July 2003 Indiana/Ohio damaging windstorm event; and the 14 June 2010 Lynn County, Texas, flash flood event. All five events resulted in significant impacts to life, property, or both. The first three are primarily localized convective-scale events, while the latter two are dominated by the mesoscale, and are being studied to ascertain the importance of the initial mesoscale environment and convective structures to the success of the resulting ensemble forecasts. While an ensemble Kalman filter (EnKF; Evensen, 1994, 1997) approach is used to assimilate radar observations of radial velocity and reflectivity in all of the experiments in this section, several different numerical models and EnKF systems are tested (Table 1 describes the model and assimilation systems for all events discussed—please refer to Table 1 for each event described below). While the details of these choices are important, a number of common themes emerge from the results. Indeed, it is very encouraging that these initial results appear to be largely independent of model and ensemble-based assimilation scheme as long as similar configurations are used.
a. 8 May 2003 tornadic supercell thunderstorm During the mid to late afternoon of 8 May 2003, the synoptic scale environment became increasingly conducive to severe thunderstorms and tornadoes over Oklahoma. A cluster of cells initiated along the dryline in west central Oklahoma around 2040 UTC and eventually developed into an isolated supercell by 2130 UTC. This storm propagated northeastward and intensified significantly over the next hour. A
Author's personal copy D.J. Stensrud et al. / Atmospheric Research 123 (2013) 2–16
5
Fig. 2. Radar-estimated maximum hail size swath (top) and 3DVAR accumulated maximum updraft intensity (bottom), for a very intense hailstorm that moved from northwest to southeast across central Oklahoma on 16 May 2010. Data are for the 4-hour period from 1900 to 2300 UTC.
violent tornado developed around 2210 UTC and tracked east–northeast for about 30 km until it dissipated around 2238 UTC, leaving F4 damage on a path stretching from Moore to Choctaw, Oklahoma. Further details of the case can be found in Hu and Xue (2007) and Romine et al. (2008). As a first test of the value of assimilating radar observations for this event using ensemble-based data assimilation, a deterministic forecast is launched using the Advanced Regional Prediction System (ARPS) model from the ensemble mean analysis at 2155 UTC, 15 min prior to tornado
development, as shown by Lei et al. (2009). This forecast captures the movement of the main supercell storm, as well as the establishment of a hook echo and strong low-level rotation, that compare well with radar observations (Fig. 3). The predicted hook echo and strong rotation at 1-km above ground level (AGL) are present during the time of the observed tornado. Lei et al. (2009) further report results from forecasts using 500 m horizontal grid spacing that are initialized using interpolated fields from the final ensemble mean analysis. The use of smaller grid spacing allows for a more realistic development of the low-level reflectivity
Author's personal copy 6
D.J. Stensrud et al. / Atmospheric Research 123 (2013) 2–16
Table 1 Ensemble data experiments conducted. Models used are the Advanced Regional Prediction System (ARPS; Xue et al., 2003; Tong and Xue, 2005), the Advanced Research Weather Research and Forecasting (WRF) model (Skamarock et al., 2008), and the NSSL Collaborative Model for Multiscale Atmospheric Simulation (NCOMMAS; Coniglio et al., 2006). Both the ARPS and WRF models have a complete physical process parameterization suite (radiation, boundary layer, land surface, microphysics, turbulent mixing), whereas the NCOMMAS only has parameterizations for microphysical and turbulent mixing processes. No convective parameterization is used for any of the model runs. The ensemble data assimilation systems are the ensemble square root filter (EnSRF; Whitaker and Hamill, 2002) designed to work with the model listed, or the ensemble adjustment Kalman filter (EAKF, a variant of the ensemble square root filter) as part of the Data Assimilation Research Testbed (Anderson, 2001; Anderson and Collins, 2007; Anderson et al., 2009). A complete volume scan of Doppler radar observations is typically available every 5 min. An affirmative for mesoscale variability means that the high-resolution model domain is nested from a coarser domain in which standard observations have been assimilated. Case
Model
Horizontal grid spacing (km)
Number of model vertical levels
Ensemble data assimilation system
Number of ensemble members
Length of radar data assimilation window (minutes)
Mesoscale variability included (yes/no)
8 May 2003 8 May 2003 8 May 2003 4 July 2003 4 May 2007 9 May 2007 14 June 2010 15 June 2011
ARPS WRF NCOMMAS WRF NCOMMAS ARPS WRF NCOMMAS
1 2 1 3 1 2 3 1.25
53 51 61 51 50 43 51 60
EnSRF EAKF/DART EnSRF EAKF/DART EnSRF EnSRF EAKF/DART EnSRF
40 45 32 45 30 40 45 40
50 60 60 60 90 60 60 30
Yes Yes No Yes No Yes Yes Yes
features that agree well with nearby Doppler radar observations (not shown). A multi-scale assimilation of both radar and surface mesonet data through a nested grid strategy is found to be important for obtaining good forecast results in this case (Lei et al., 2009). While this deterministic forecast provides a reasonable forecast for up to 1 h, results from other explicit convectionallowing model forecasts indicate that rapidly evolving convective events are highly sensitive to both environmental conditions and internal storm processes (Elmore et al., 2002; Martin and Xue, 2006; Gilmore et al., 2004; Tong and Xue, 2008; Snook and Xue, 2008; Dawson et al., 2012). These results drive the need for a probabilistic convectivescale forecasting approach, as the uncertainties associated with high-impact weather are large. Thus, while the
favorable results from the deterministic forecast of the 8 May 2003 supercell are very encouraging, and illustrate the potential value of an EnKF data assimilation approach, an ensemble forecast approach is needed. Using the Weather Research and Forecasting (WRF) model with a similar ensemble data assimilation approach, results from ensemble forecasts of this tornadic supercell event are examined. Forecasts of ensemble grid-point vorticity probabilities at ~1 km AGL, chosen to be representative of the presence of a significant low-level mesocylone, over four successive 15-minute periods show the east–northeastward movement of the low-level mesocyclone largely overlaying the observed tornado damage path (Fig. 4) that spans over approximately 2210–2238 UTC. Since the model grid spacing is too large to explicitly predict a tornado, the presence of a significant low-level mesocyclone is used as a proxy for a
Fig. 3. A deterministic 30-min forecast of reflectivity (color), wind vectors and vertical vorticity (contours) at 1-km AGL, starting from an ensemble mean analysis at 2155 UTC 8 May 2003 for the Oklahoma City tornadic thunderstorm (right), as compared to radar-observed low-level reflectivity (left). The model maintained the storm intensity and propagation direction during the forecast, and predicted a hook echo region with strong rotation over the time period of the observed tornado.
Author's personal copy D.J. Stensrud et al. / Atmospheric Research 123 (2013) 2–16
7
Fig. 4. Ensemble probability of vorticity exceeding 0.00375 s− 1 at ~ 1 km AGL for the 8 May 2003 forecast experiment for four 15-min time windows starting at 2200 UTC 8 May 2003. Simulated radar reflectivity regions greater than or equal to 30 dBZ and 50 dBZ are shaded in light and dark gray, respectively, for ensemble member 7 at the beginning of each time interval for each panel. Overlaid in each panel is the observed tornado damage track (black outline), the location of Moore, Oklahoma (yellow dot), and county borders (thin black lines). The time interval (UTC) of each 15-min period is indicated in each panel.
tornado on the ground. Probabilities above 90% are apparent over the damage path during the 2200–2215 UTC period and over much of the following 2215–2230 UTC period. The maximum vorticity probabilities are highest early in the forecast, where they approach 100% at some grid points, and decay over time. There is a clear eastward displacement in the maximum vorticity probabilities compared to the observed damage path during the 2230–2245 UTC period as the forecast storm motion is slightly too easterly compared to observations. Probabilities along the damage path remain above 50% in some locations, indicating that some ensemble members produce storms that track close to the observed storm motion. The ensemble forecasts continue to suggest probabilities above 70% during 2245–2300 UTC after the observed tornado has dissipated. The forecast reflectivity structure shows that the predicted supercell loses the hook echo structure over the 1 h forecast time, even as the low-level mesocyclone persists throughout the entire forecast period. b. 4–5 May 2007 tornadic supercell thunderstorm Several large and strong tornadoes from a single prolific tornadic supercell tracked south–southwest to north– northeast across western Kansas from the early evening to overnight hours on 4–5 May 2007. One of these tornadoes began at approximately 0200 UTC 5 May and struck the town of Greensburg, Kansas, just after 0245 UTC. Unfortunately, the town was nearly completely destroyed by this violent EF5 tornado. The tornado persisted for nearly an hour, finally dissipating at approximately 0300 UTC (Lemon and Umscheid, 2008). Bluestein (2009) details the evolution of the mesoscale and storm-scale environment leading up to the development of the storm, while Lemon and Umscheid (2008) include further observations of the storm and tornado itself.
Forecasts of ensemble grid-point vorticity probabilities at ~1 km AGL over four successive 15-minute periods again show the north–northeastward movement of the low-level mesocyclone (Fig. 5). A larger threshold vorticity value is
Fig. 5. As in Fig. 4 but for the 30-member 4–5 May 2007 Greensburg experiment and using a vorticity threshold of 0.015 s− 1. The damage paths of the first 3 large tornadoes are overlaid in each panel for reference, with the first (farthest southwest) track corresponding to the Greensburg tornado. The yellow dot marks the location of the town of Greensburg, Kansas. The time interval (UTC) of each 15-min period on 5 May is indicated in each panel.
Author's personal copy 8
D.J. Stensrud et al. / Atmospheric Research 123 (2013) 2–16
used here compared to the value used for the 8 May 2003 storm due to the use of smaller horizontal grid spacing in the ensemble forecasts. Assuming a constant magnitude of vorticity within a grid cell, the area-integrated vorticity, or circulation, is identical between the two experiments for a given grid cell. The area of highest vorticity probability begins slightly to the east of the observed tornado damage path from 0200 to 0215 UTC, and then shifts to slightly west of the tornado damage path with a higher maximum probability predicted from 0215 to 0230 UTC. Probabilities for this 15-minute period approach 100% for some grid points. The probabilities decrease over the next 15-minute period with maximum values approaching 60%, and with non-zero probabilities over the town of Greensburg. During the final 0245–0300 UTC period, it is curious that two areas of low-level mesocyclones are present: one following the damage path of the Greensburg tornado that loops to the
Fig. 6. Comparison of (a) 3DVAR surface wind analysis and (b) 20-minute ensemble mean near-surface wind forecast both valid at 0030 UTC 15 June 2011 for the central Oklahoma macroburst. Colors indicate wind speed, with wind vectors plotted. The locations of two Doppler radars used in the 3DVAR are shown by a black and white dot. Locations where ensemble probabilities of near-surface winds exceeding 30 m s− 1 are greater than 50% are shown by bold wind vectors.
northwest of the town, and the other to the east of Greensburg where the next tornado develops. The decreasing probabilities correspond with the weakening phase of the tornado. Further details regarding this ensemble forecast are discussed in Dawson et al. (2012). c. 15 June 2011 macroburst On 15 June 2011 a macroburst occurred in the city of Norman, Oklahoma just after 0000 UTC. This macroburst was associated with a convective cell that initiated ahead of a slowly moving cold front at around 2330 UTC 14 June. Ahead of the front, a 3-km deep boundary layer developed as surface temperatures approached 40 °C, and convective available potential energy calculated from the 0000 UTC rawinsonde launch at Norman, Oklahoma, exceeded 2100 J kg − 1. The convective storms intensified rapidly near 0000 UTC, with the macroburst reaching the ground at approximately 0015 UTC, lasting for 20–25 min, and having maximum observed 10-m wind speeds of greater than 40 m s − 1. The swath of damage was approximately 4 km wide and 12 km long, traveling in a path from west– northwest to south–southeast across northern and central Norman. A 20-minute ensemble forecast is started at 0010 UTC, 5 min prior to the macroburst reaching the ground. A comparison between a 3DVAR wind analysis (Shapiro et al., 2009; Potvin et al., 2012), that uses observations from two nearby radars, with the 20-minute ensemble mean wind forecasts valid at 0030 UTC indicates that the pattern of ensemble mean maximum winds is very similar to the 3DVAR analysis (Fig. 6). Closer inspection reveals that the predicted gust front is displaced 5–10 km farther east, particularly on the northern end. The predicted mean wind field maximum is also broader, but this is due in part to the averaging across the ensemble members (not shown). The bold wind vectors indicate locations where the probability of near-surface wind speeds exceeding 30 m s − 1 is above 50%, highlighting the most severe portion of the macroburst. The probabilistic information would provide confidence to operational forecasters that the depiction of severe winds is a property of most of the ensemble members, rather than just a few outliers. d. 4 July 2003 mesoscale convective system On 4–5 July 2003, the upper Great Plains and Midwest regions of the United States were affected by three mesoscale convective systems (MCSs). This succession of systems produced significant variability in the pressure and temperature patterns over these regions. These mesoscale features, and their interactions with the surrounding environment, were particularly important to the development of the later convective systems, but were largely absent in operational model initial conditions. A real-time WRF forecast and subsequent research simulations were unable to reproduce the initiation and evolution of the third system, which developed over northern Indiana between 2000 and 2100 UTC 4 July and then moved south–southeastward over southwest Ohio, producing over one hundred high wind reports. Ensemble mean reflectivity at the last analysis time, 2300 UTC 4 July, shows a simulated convective system of similar
Author's personal copy D.J. Stensrud et al. / Atmospheric Research 123 (2013) 2–16
(b) EnKF Analysis at 0000 UTC
(a) OBS at 2300 UTC
5 15 25 35 45 55 65
4
8 12 16 20 24 28 32 36
dBZ
deg C
dBZ
4
5 15 25 35 45 55 65
4
dBZ
8 12 16 20 24 28 32 36
deg C
(d) 1-h Ensemble Forecast at 0000 UTC
(c) OBS at 2300 UTC
5 15 25 35 45 55 65
9
8 12 16 20 24 28 32 36
deg C
5 15 25 35 45 55 65
dBZ
4
8 12 16 20 24 28 32 36
deg C
Fig. 7. Observed radar reflectivity (dBZ) and analyzed 2-m temperature (°C) and 10-m winds at (a) 2300 UTC 4 July and (c) 0000 UTC 5 July 2003, paired with ensemble mean reflectivity and 2-m temperature at the last analysis time of 2300 UTC 4 July 2003 (b) and the 1-h forecast time of 0000 UTC 5 July 2003 (d). The analyzed 2-m temperatures and 10-m winds are from the Storm Prediction Center meso-analysis. The solid dots in (b,d) indicate the difference between observed and ensemble mean 2-m temperature values at available observation locations. Color bars indicate radar reflectivity and 2-m temperature values. Full wind barb is 10 m s− 1.
intensity and location as the observed system. However, the ensemble mean reflectivity and 2-m temperature forecasts of the Indiana MCS show that the ensemble forecasts are not as progressive or intense as the observed system, which produces more movement to the south–southeast and has a developing bow echo structure not observed in the ensemble runs (Fig. 7). The deficiencies in the ensemble forecasts likely can be attributed to the degraded representation of the remnant cold pool from an earlier MCS over north–central
Ohio as clearly seen in the analyzed 2-m temperature field (Fig. 7a). This cold pool influences the low-level wind field, with generally southerly winds indicated in the observations and southwesterly winds indicated in the ensemble analysis (c.f. Fig. 7a,b). While the 1-h ensemble mean reflectivity forecast maintains the MCS in approximately the correct location and orientation, the forecast degrades quickly after this time (not shown) as the model is not able to develop a sufficiently strong cold pool. The ensemble also
Author's personal copy 10
D.J. Stensrud et al. / Atmospheric Research 123 (2013) 2–16
Fig. 8. (a) Ensemble mean 2-m temperature (color fill every 1 K, legend at bottom of figure), 10-m winds (full barb = 5 m s− 1), and simulated composite reflectivity (contours every 5 dBZ starting at 25 dBZ) valid at the final analysis time of 1900 UTC. (b) Analyzed 2-m temperature and winds and observed composite reflectivity displayed as in (a). (c) As in (a), except the probability of composite reflectivity exceeding 35 dBZ (contours every 10% starting at 10%) for a 60 minute forecast valid at 2000 UTC. (d) As in (b) except valid at 2000 UTC. (e) As in (c) except for a 120 minute forecast valid at 2100 UTC. (f) As in (d) except valid at 2100 UTC. Only a 240 by 300 km area of the inner domain is shown. Lynn County, Texas, is highlighted in green. Colored circles denote differences in temperature between the ensemble mean and surface observations at that location (forecast minus observed) given by the scale at the bottom of the figure. Observed composite reflectivity is derived from the NMQ system (see text for details).
fails to produce a large swath of damaging surface winds as observed. e. 14 June 2010 mesoscale convective system On 14 June 2010, a nearly stationary front stretched from southwest to northeast across west Texas separating cool
relatively dry continental air from warm very moist air that originated over the western Gulf of Mexico. Convection initiated along the front in west Texas around 1800 UTC and developed into a cluster of intense convective cells by 1900 UTC (Fig. 8b). Although severe wind gusts as high as
Author's personal copy D.J. Stensrud et al. / Atmospheric Research 123 (2013) 2–16
37 m s− 1 and brief weak tornadoes were observed with this convection, perhaps the biggest impact from this event was from flash flooding that occurred in Lynn County, Texas
11
(highlighted in green in Fig. 8). A feed of high equivalent potential temperature low-level air, and mid-to-upperlevel flow that was nearly parallel to the front, produced
Fig. 9. Radar reflectivity (dBZ, left) and vertical velocity (m s− 1, right) at 1 km AGL, with storm relative winds (arrows) overlaid, from the truth simulation (top) and from ensemble member analyses using the EnSRF (middle) and LETKF (bottom).
Author's personal copy 12
D.J. Stensrud et al. / Atmospheric Research 123 (2013) 2–16
training of intense convection over this area. The National Mosaic and Multi-sensor Quantitative precipitation estimation (NMQ) system (Vasiloff et al., 2007) estimated that much of Lynn County, Texas, received over 60 mm of precipitation from 1900 to 2200 UTC (not shown).
a. Data assimilation methods The Local Ensemble Transform Kalman Filter (LETKF) is an EnKF variation that does not require observations to be processed serially, allowing for the update of each state
Ensemble mean analyses of composite reflectivity at 1900 UTC 14 June 2010 (Fig. 8a) show a somewhat smooth representation of the observed convection (Fig. 8b), but all ensemble members place the convection at approximately the correct location. In addition, the large-scale temperature and wind discontinuities associated with the front are well positioned. However, after a 1-hour forecast most of the ensemble members develop convection that propagates north and east along the periphery of a strong cold pool (Fig. 8c). The observations show that the original convection moved very little to the east between 1900 and 2000 UTC (cf. Fig. 8b,d), while scattered convection developed further west and in a southwest to northeast oriented line terminating at Lubbock (KLBB). The surface observation at Lubbock at 2000 UTC reveals that the ensemble mean cold pool is too strong at this location, although it may be that the observed convection simply hasn't matured sufficiently to produce downdrafts over Lubbock by this time. By 2100 UTC, the observed convection continues to remain focused over Lynn County, Texas, as convection backbuilds to the southwest along the front (Fig. 8f). The ensemble members, however, continue to propagate convection to the north and east along a strong cold pool (Fig. 8e). Some convection is seen to build to the south and west along the front in the ensemble members, but it is located too far east compared to reality (cf. Fig. 8e, f). The two MCS cases highlight the important interactions between mesoscale and convective-scale features that can strongly influence the success or failure of convective-scale forecasts. The cold pool structures from earlier convection are too weak in the 4 July 2003 case, leading to convection that moves too slowly, whereas the cold pool structures produced in the 14 June 2010 case are too strong, leading to convection that moves too quickly. These results also underscore the sensitivity of convective-scale forecasts to model error, since errors in cold pool structures may be due to errors in the various model parameterization schemes.
4. Progress toward overcoming challenges to a successful Warn-on-Forecast A number of challenges to the success of the Warn-onForecast paradigm are apparent from these early experiments and are now being addressed by the project team. These challenges include—but are not limited to—determining the data assimilation method that produces the best analyses and forecasts for a reasonable computational expense, improving the ensemble analyses of the environmental conditions to include mesoscale features more accurately using radar and satellite remote sensing data, and reducing the effects of model error due to inaccuracies in the physical process parameterization schemes. Examples of current efforts in these areas follow.
Fig. 10. 0350 UTC, 9 May 2007 (a) observed radar reflectivity (shaded, dBZ) and forecast reflectivity (shaded, dBZ) and horizontal wind vectors (m s− 1) for 110-minute deterministic forecasts initialized from (b) 3DVAR and (c) EnKF analyses of CASA and WSR-88D radar data and conventional radar observations. Data are plotted at model vertical grid level 7 (approximately 1 km above the surface). The “L” marks the approximate observed position of the line-end vortex. Panel (b) is reproduced from Fig. 11d of Schenkman et al. (2011).
Author's personal copy D.J. Stensrud et al. / Atmospheric Research 123 (2013) 2–16
variable to be done in parallel (Hunt et al., 2007). This parallelization makes LETKF scale well to high-dimensional systems and large numbers of observations. This may yield a computational advantage over the EnSRF methodology traditionally used for Doppler radar data assimilation, as the EnSRF method requires the observations to be processed one at a time to avoid the computation of matrix square roots. The LETKF has been used for large-scale problems but how well it applies to storm-scale Doppler radar data assimilation is an open question. Thus, the efficacy of the LETKF methodology for storm-scale analysis and forecasting is currently being investigated. An Observing System Simulation Experiment (OSSE) of a supercell storm is used for making comparisons between the analyses produced by the LETKF and EnSRF assimilation. Synthetic observations mimicking the spatial and temporal frequencies of the NWS Doppler radars are objectively analyzed to a 2 km grid and then assimilated every 2 min. The EnKF experiments are run with 1-km horizontal grid spacing and approximately 0.25-km vertical spacing. After 40 min of data assimilation, the EnSRF and LETKF methods produce similar analyses that capture the storm structure with reasonable fidelity (Fig. 9). These initial favorable comparisons indicate that LETKF shows potential for stormscale radar data assimilation. Future work will continue to explore the potential utility and computational expense of the LETKF method compared to the EnSRF and other ensemble and variational data assimilation methods. One such comparison is between deterministic forecasts initialized using either a 3DVAR or EnKF approach. On 9 May 2007, an MCS with an embedded line-end vortex (LEV) moved across portions of Texas and Oklahoma, producing several weak tornadoes in southwestern and central Oklahoma. This MCS was well observed by the experimental
13
network of X-band radars operated by the Center for Collaborative Adaptive Sensing of the Atmosphere (CASA) (McLaughlin et al., 2009), as well as by the NWS Doppler radar network (Crum and Alberty, 1993). Similarlyconfigured data assimilation experiments, assimilating CASA and NWS Doppler radar data on a 2-km horizontal grid, are performed by Schenkman et al. (2011) using 3DVAR with a cloud analysis and by Snook et al. (2012a) using an EnKF data assimilation system. Deterministic forecasts are started from the 3DVAR analysis and the EnKF ensemble mean analysis, both valid at 0200 UTC 9 May 2007, and the resulting forecasts are compared to NWS Doppler radar observations. The Doppler radar observations at 0350 UTC, the time of an observed tornado (Fig. 10a), show a mature MCS with two convective lines: a leading convective line extending to the southeast of the LEV, and a weaker, trailing convective line extending south. Both the 110-minute 3DVAR-based (Fig. 10b) and EnKF-based (Fig. 10c) forecasts valid at 0350 UTC correctly predict a MCS with an embedded LEV. The 3DVAR run places the center of the LEV 10–15 km to the southeast of the observed LEV center, while the EnKF run places the center almost exactly on top of the observed LEV center. Both forecasts predict only a single convective line. The 3DVAR run predicts a relatively intense convective line located between the observed leading and trailing convective lines, while the EnKF forecast predicts a weaker convective line in good agreement with the observed trailing convective line, but does not indicate the presence of the stronger leading convective line. Despite some error, the overall good performance of the 3DVAR- and EnKF-based deterministic forecasts suggests that both systems are capable of producing high-quality 0–2 hour convective-scale forecasts. Results of convective-scale ensemble forecasts of this
Fig. 11. (a) Dewpoint temperature (°C) from AIRS 45 km resolution retrieval centered near 647 hPa at 2000 UTC 10 May 2010 with tornado (red), large hail (green) and severe wind (blue) reports from this event overlaid. (b) Corresponding AIRS 15 km dewpoint temperature retrieval overlaid with hatching indicating ensemble mean dewpoint temperatures b− 20 °C from NO-AIRSP (red) and AIRSP (blue) ensembles. Note that AIRSP correctly raises the dewpoint temperatures in southwestern Oklahoma that are below − 20 °C in the NO-AIRSP ensemble.
Author's personal copy 14
D.J. Stensrud et al. / Atmospheric Research 123 (2013) 2–16
event are found in Snook et al. (in press), while Snook et al. (2012a) show good agreement between the model predicted center of maximum probability of near surface high vorticity and the observed tornado. b. Ensemble analyses Improvements to the ensemble analyses of the mesoscale environment likely will require the expanded and improved use of non-standard observations. One potential new data source is the temperature and mixing ratio profiles from the Atmospheric InfraRed Sounder (AIRS) instrument on board the Aqua EOS satellite. To test the ability of AIRS data to improve environmental analyses, these data are added into an EnKF data assimilation stream from a tornado outbreak occurring in the Southern Plains on 10 May 2010 that already includes surface, marine, radiosonde, and aircraft measurements. One experiment (NO-AIRSP) assimilates only traditional observations, while the second experiment (AIRSP) assimilates traditional observations plus the AIRS temperature and dewpoint profiles from the 1950 UTC 10 May 2010 satellite overpasses. Results indicate that assimilating AIRS data yields notably modified mid-tropospheric moisture profiles over southern Oklahoma and north Texas (Fig. 11). The AIRS observations, from either a 45-km resolution or an independent 15-km resolution retrieval algorithm, show several consistent moisture patterns. In the eastern half of the domain, AIRS dewpoint values are generally greater than −15 °C. Farther west, a relatively narrow swath of drier air (dewpoint b − 20 °C) exists followed by a moist plume just to its west near the Oklahoma–Texas border (corresponding to the region along the dryline where convection is forming). Finally, very dry air (dewpointb− 30 °C) is evident in the far western portions of the domain. While the differences between AIRSP and NO-AIRSP are small in the western portion of the domain, farther east more significant differences are evident. NO-AIRSP (red hatching) generates a narrow dry plume in southwestern Oklahoma that connects to the dry air mass in west Texas, whereas AIRSP (blue hatching) removes this narrow dry plume. Since the dry plume is not seen in the independent 15-km resolution AIRS retrieval, it appears that assimilating AIRS profiles yields a positive impact on the analysis of the mesoscale environment. Further details on this case, and the improved forecasts in AIRSP compared to NO-AIRSP, are found in Jones and Stensrud (in press). c. Model physical process parameterization It is well known that thunderstorm simulations are particularly sensitive to the tunable parameters within single-moment bulk microphysics schemes (Gilmore et al., 2004; Tong and Xue, 2008). Thus, more sophisticated multi-moment bulk or bin microphysics schemes may be needed to reduce the model sensitivity to the treatment of microphysical processes. To explore the need for improved microphysics parameterization, ensemble mean forecasts of the 8 May 2003 tornadic supercell thunderstorm event over Oklahoma City, Oklahoma, from a multi- and single-moment microphysics scheme are compared using the NSSL Collaborative Model for Multiscale Atmospheric Simulation (NCOMMAS). The single-moment scheme predicts the total mass (third moment) of five hydrometeor
Fig. 12. Radar analysis (a) and 22-minute mean forecasts (NCOMMAS 32 members at 1-km resolution) using (b) enhanced multi-moment or (c) typical single-moment bulk microphysics. The valid time is approximately the start of a long-track tornado event. Forecasts are initialized from EnKF analyses at 21:48. The single-moment scheme predicts the total mass (third moment) of five hydrometeor categories (cloud droplets, rain, ice crystals, snow, and graupel) with fixed particle densities and size distribution intercept parameters.
categories (cloud droplets, rain, ice crystals, snow, and graupel) with fixed particle densities and size distribution intercept parameters. The multi-moment scheme adds a separate hail category and predicts the particle number concentration (zeroth moment) of all categories as well as the 6th moments (radar reflectivity) of graupel and rain. In addition, this scheme predicts bulk particle densities of graupel and hail and liquid mass fractions on snow, graupel, and hail. Results show that the multi-moment microphysics
Author's personal copy D.J. Stensrud et al. / Atmospheric Research 123 (2013) 2–16
scheme yields a better depiction of the reflectivity structure, particularly in the southern forward flank and left-split cells (Fig. 12), as well as increased low-level mesocyclone strength (not shown). Similarly, Jung et al. (in press) assimilate radar data using an EnKF system with ARPS together with a double-moment microphysics scheme for a supercell storm, and show that by using a double-moment microphysics scheme the EnKF analysis is able to reproduce reasonable polarimetric radar signatures that match observations quite well; the parallel analysis using a singlemoment microphysics scheme fails to produce reasonable polarimetric radar signatures. These results illustrate the importance of developing improved physical parameterization schemes for convection-allowing models, as many of the currently available parameterizations are not designed for such small horizontal grid spacing (Stensrud, 2007). 5. Discussion The current status and challenges associated with two aspects of Warn-on-Forecast—a numerical model-based probabilistic convective-scale analysis and forecast system to support warning operations within NOAA—have been outlined. These two project aspects are the production of a rapidly-updating assimilation system to incorporate data from multiple radars into a single analysis, and the ability of short-range ensemble forecasts of hazardous convective weather events to provide guidance that could be used to extend warning lead times for tornadoes, hailstorms, damaging windstorms and flash floods. Results indicate that a 3DVAR system to assimilate observations from multiple radars into a single analysis shows utility when evaluated by forecasters in the HWT and may help increase confidence in a warning decision. The five cases selected to explore the ability of a short-range ensemble forecasts to provide guidance that could be used in warning operations also show positive results for individual severe thunderstorm events, while results from the two MCS events are mixed and highlight the important interactions between mesoscale and convective-scale features that can strongly influence the quality of the convective-scale forecasts. While these two research areas are important and key to the success of the project, the project members are also involved in developing improvements to radar data quality control, studying thunderstorm predictability, exploring verification methods for localized high impact events, exploring how to best assimilate satellite observations for high impact weather events, and partnering with social scientists to better understand how severe weather warning information is understood and used by the public. While the results presented suggest that a Warn-on-Forecast paradigm may produce increased warning lead times for a variety of severe weather events, leading the research effort forward to a point where it can be transitioned to operations will take many years and will require the collaborative efforts of researchers and operational forecasters to succeed. Acknowledgments The authors thank our Warn-on-Forecast partners for their support of this program, and the IT staffs of the various institutions for help with computing resources. We also
15
appreciate the helpful and constructive input provided by two anonymous reviewers, which led to improvements in the presentation. This work was performed while co-author CKP held a National Research Council Research Associateship Award at the NOAA/National Severe Storms Laboratory. Funding for some authors was provided by NOAA/Office of Oceanic and Atmospheric Research under NOAA-University of Oklahoma Cooperative Agreement #NA11OAR4320072, U.S. Department of Commerce. References Anderson, J.L., 2001. An ensemble adjustment Kalman filter for data assimilation. Mon. Weather Rev. 129, 2884–2903. Scalable implementations of ensemble filter algorithms for data assimilation. J. Atmos. Oceanic Technol. 24, 1452–1463. Anderson, J.L., Hoar, T., Raeder, K., Liu, H., Collins, N., Torn, R., Avellano, A., 2009. The data assimilation research testbed: a community facility. Bull. Amer. Meteor. Soc. 90, 1283–1296. Benjamin, S.G., Devenyi, D., Weygandt, S.S., Brundage, K.J., Brown, J.M., Grell, G.A., Kim, D., Schwartz, B.E., Smirnova, T.G., Smith, T.L., 2004. An hourly assimilation-forecast cycle: The RUC. Mon. Weather Rev. 132, 495–518. Bluestein, H.B., 2009. The formation and early evolution of the Greensburg, Kansas, tornadic supercell on 4 May 2007. Weather Forecast. 24, 899–920. Brooks, H.E., 2004. Tornado warning performance in the past and future: a perspective from signal detection theory. Bull. Amer. Meteor. Soc. 85, 837–843. Brooks, H.E., Doswell, C.A., 2002. Deaths in the 3 May 1999 Oklahoma City tornado from a historical perspective. Weather Forecast. 17, 354–361. Coniglio, M.C., Stensrud, D.J., Wicker, L.J., 2006. Effects of upper-level shear on the structure and maintenance of strong quasi-linear mesoscale convective systems. J. Atmos. Sci. 63, 1231–1252. Crum, T.D., Alberty, R.L., 1993. The WSR-88D and the WSR-88D operational support facility. Bull. Amer. Meteor. Soc. 74, 1669–1687. Dawson, D.T., Wicker, L.J., Mansell, E.R., Tanamachi, R.L., 2012. Impact of the environmental low-level wind profile on ensemble forecasts of the 4 May 2007 Greensburg, KS tornadic storm and associated mesocyclones. Mon. Weather Rev. 140, 696–716. Elmore, K.L., Stensrud, D.J., Crawford, K.C., 2002. Explicit cloud-scale models for operational forecasts: a note of caution. Weather Forecast. 17, 873–884. Evensen, G., 1994. Sequential data assimilation with a nonlinear quasigeostrophic model using Monte Carlo methods to forecast error statistics. J. Geophys. Res. 99 (C5), 10 143–10 162. Evensen, G., 1997. Advanced data assimilation for strongly nonlinear dynamics. Mon. Weather Rev. 125, 1342–1354. Gao, J., Stensrud, D.J., 2012. Assimilation of reflectivity data in a convectivescale, cycled 3DVAR framework with hydrometeor classification. J. Atmos. Sci. 69, 1054–1065. Gao, J., Xue, M., Brewster, K., Carr, F., Droegemeier, K.K., 2002. New development of a 3DVAR system for a nonhydrostatic NWP model. Preprints, 15th Conf. Num. Wea. Prediction, 19th Conf. Wea. Anal. Forecasting, San Antonio, TX, Amer. Meteor. Soc, pp. 339–341. Gao, J., Xue, M., Brewster, K., Carr, F., 2003. A 3DVAR method for Doppler radar wind assimilation with recursive filter. Preprints, 31st Conf. Radar Meteor., Seatle, WA, Amer. Meteor. Soc., Paper P1C.4. Gao, J., Xue, M., Brewster, K., Droegemeier, K.K., 2004. A three-dimensional variational data assimilation method with recursive filter for singleDoppler radar. J. Atmos. Oceanic. Technol. 21, 457–469. Gilmore, M.S., Straka, J.M., Rasmussen, E.N., 2004. Precipitation uncertainty due to variations in precipitation particle parameters within a simple microphysics scheme. Mon. Weather Rev. 132, 2610–2627. Hu, M., Xue, M., 2007. Impact of configurations of rapid intermittent assimilation of WSR-88D radar data for the 8 May 2003 Oklahoma City tornadic thunderstorm case. Mon. Weather Rev. 135, 507–525. Hu, M., Xue, M., Brewster, Keith, 2006. 3DVAR and cloud analysis with WSR-88D Level-II data for the prediction of the Fort Worth tornadic thunderstorms. Part I: cloud analysis and its impact. Mon. Weather Rev. 134, 675–698. Hunt, B.R., Kostelich, E.J., Szunyogh, I., 2007. Efficient data assimilation for spatiotemporal chaos: a local ensemble transform Kalman filter. Physica D 230, 112–126. Jones, T.A., Stensrud, D.J., in press. Assimilating AIRS temperature and mixing ratio profiles using an Ensemble Kalman Filter approach for convectivescale forecasts. Wea. Forecasting doi:10.1175/WAF–D–11–00090.1. Jung, Y., Xue, M., Tong, M., in press. Ensemble Kalman filter analyses of the 29–30 May 2004 Oklahoma tornadic thunderstorm using one- and two-
Author's personal copy 16
D.J. Stensrud et al. / Atmospheric Research 123 (2013) 2–16
moment bulk microphysics schemes, with verification against polarimetric radar data. Mon. Wea. Rev. doi:10.1175/MWR–D–11–00032.1. Kuhlman, K.M., Smith, T.M., Gao, J., Manross, K.L., Ortega, K.L., Stumpf, G.J., 2012. Real-Time 3DVAR Analyses and Forecaster Evaluation During the 2011 Hazardous Weather Testbed Experimental Warning Program. Preprints, 16th Symp. on Integrated Obs. and Assimilation Systems for the Atmos., Oceans, and Land Surface (IOAS-AOLS), New Orleans, LA., Amer. Meteor. Soc., Paper 3.6. Lakshmanan, V., Smith, T., Stumpf, G., Hondl, K., 2007. The warning decision support system—integrated information. Weather Forecast. 22, 596–612. Lei, T., Xue, M., Yu, T., 2009. Multi-scale analysis and prediction of the 8 May 2003 Oklahoma City tornadic supercell storm assimilating radar and surface network data using EnKF. Extended abstract, 13th Conf. of IOASAOLS, AMS Meetings 2008, Paper 6.4. Lemon, L.R., Umscheid, M., 2008. The Greensburg, KS tornadic storm: a storm of extremes. Extended abstract, 24th Conference on Severe Local Storms, Savannah, Georgia, American Meteorological Society. Martin, W.J., Xue, M., 2006. Initial condition sensitivity analysis of a mesoscale forecast using very-large ensembles. Mon. Weather Rev. 134, 192–207. McLaughlin, D., Pepyne, D., Chandrasekar, V., Philips, B., Kurose, J., Zink, M., Droegemeier, K., Cruz-Pol, S., Junyent, F., Brotzge, J., Westbrook, D., Bharadwaj, N., Wang, Y., Lyons, E., Hondl, K., Liu, Y., Knapp, E., Xue, M., Hopf, A., Kloesel, K., DeFonzo, A., Kollias, P., Brewster, K., Contreras, R., Dolan, B., Djaferis, T., Insanic, E., Frasier, S., Carr, F., 2009. Shortwavelength technology and the potential for distributed networks of small radar systems. Bull. Amer. Meteor. Soc. 90, 1797–1817. Ortega, K.L., Smith, T.M., Manross, K.L., Scharfenberg, K.A., Witt, A., Kolodziej, A.G., Gourley, J.J., 2009. The severe hazards analysis and verification experiment. Bull. Amer. Meteor. Soc. 90, 1519–1530. Pielke, R., Carbone, R.E., 2002. Weather impacts, forecasts, and policy: an integrated perspective. Bull. Amer. Meteor. Soc. 83, 393–403. Potvin, C.K., Shapiro, A., Xue, M., 2012. Impact of a vertical vorticity constraint in variational dual-Doppler wind analysis: tests with real and simulated supercell data. J. Atmos. Oceanic Technol. 29, 32–49. Purser, R.J., Wu, W.-S., Parrish, D., Roberts, N.M., 2003. Numerical aspects of the application of recursive filters to variational statistical analysis. Part II: spatially inhomogeneous and anisotropic general covariances. Mon. Weather Rev. 131, 1536–1548. Romine, G.S., Burgess, D.W., Wilhelmson, R.B., 2008. A dual-polarizationradar-based sssessment of the 8 May 2003 Oklahoma City area tornadic supercell. Mon. Weather Rev. 136, 2849–2870. Schenkman, A., Xue, M., Shapiro, A., Brewster, K., Gao, J., 2011. The analysis and prediction of the 8–9 May 2007 Oklahoma tornadic mesoscale convective system by assimilating WSR-88D and CASA radar data using 3DVAR. Mon. Weather Rev. 139, 224–246. Shapiro, A., Potvin, C.K., Gao, J., 2009. Use of a vertical vorticity equation in variational dual-Doppler wind analysis. J. Atmos. Oceanic Technol. 26, 2089–2106.
Simmons, K.M., Sutter, D., 2005. WSR-88D radar, tornado warnings, and tornado casualties. Weather Forecast. 20, 301–310. Simmons, K.M., Sutter, D., 2011. Economic and societal impacts of tornadoes. Amer. Meteor. Soc. 282 pp. Skamarock, W.C., Klemp, J.B., Dudhia, J., Gill, D.O., Barker, D.M., Duda, M.G., Huang, X.-Y., Wang, W., Powers, J.G., 2008. A description of the Advanced Research WRF version 3. NCAR Tech Note NCAR/TN475+STR. 113 pp. [Available from UCAR Communications, P. O. Box 3000, Boulder, CO 80307.]. Smith, T.S., Kulman, K.M., Ortega, K.L., Manross, K.L., Burgess, D.W., Gao, J., Stensrud, D.J., 2010. A survey of real-time 3DVAR analyses conducted during the 2010 Experimental Warning Program spring experiment. Extended abstract, 25th Conference on Severe Local Storms, Denver, CO, USA, AMS, P5.7. Snook, N., Xue, M., 2008. Effects of microphysical drop size distribution on tornadogenesis in supercell thunderstorms. Geophys. Res. Lett. 35, L24803 doi:10.1029/2008GL035866. Snook, N., Xue, M., Jung, J., 2012. Analysis of a tornadic meoscale convective vortex based on ensemble Kalman filter assimilation of CASA X-band and WSR-88D radar data. Mon. Weather Rev. 139, 3446–3468. Snook, N., Xue, M., Jung, Y., in press. Ensemble probabilistic forecasts of a tornadic mesoscale convective system from ensemble Kalman filter analyses using WSR-88D and CASA radar data. Mon. Wea. Rev. doi:10. 1175/MWRD–11–00117.1. Stensrud, D.J., 2007. Parameterization Schemes: Keys to Understanding Numerical Weather Prediction Models. Cambridge University Press. 459 pp. Stensrud, D.J., Xue, M., Wicker, L.J., Kelleher, K.E., Foster, M.P., Schaefer, J.T., Schneider, R.S., Benjamin, S.G., Weygandt, S.S., Ferree, J.T., Tuell, J.P., 2009. Convective-scale warn on forecast: a vision for 2020. Bull. Amer. Meteor. Soc. 90, 1487–1499. Tong, M., Xue, M., 2005. Ensemble Kalman filter assimilation of Doppler radar data with a compressible nonhydrostatic model: OSS Experiments. Mon. Weather Rev. 133, 1789–1807. Tong, M., Xue, M., 2008. Simultaneous estimation of microphysical parameters and atmospheric state with simulated radar data and ensemble square root Kalman filter. Part I: sensitivity analysis and parameter identifiability. Mon. Weather Rev. 136, 1630–1648. Vasiloff, S.V., Seo, D.J., Howard, K.W., Zhang, J., Kitzmiller, D.H., Mullusky, M.G., Krajewski, W.F., Brandes, E.A., Rabin, R.M., Berkowitz, D.S., Brooks, H.E., McGinley, J.A., Kuligowski, R.J., Brown, B.G., 2007. Improving QPE and very short term QPF: an initiative for a community-wide integrated approach. Bull. Amer. Meteor. Soc. 88, 1899–1911. Whitaker, J.S., Hamill, T.M., 2002. Ensemble data assimilation without perturbed observations. Mon. Weather Rev. 132, 1913–1924. Xue, M., Wang, D.-H., Gao, J.-D., Brewster, K., Droegemeier, K.K., 2003. The Advanced Regional Prediction System (ARPS), storm-scale numerical weather prediction and data assimilation. Meteor. Atmos. Physics 82, 139–170.