Autism/Excel Study Mary Hart Computing Workshop: CS Education for Students with Special Needs 147 Washington St. Pittsburgh, PA 15218 +1 412 414 5344
[email protected] ABSTRACT
Five high school students with ASD (autistic spectrum disorder) participating in the Excel/Autism study were able to demonstrate mastery of a set of Excel topics. The Excel curriculum covered approximately the same topics as are covered in the Excel portion of Computer Business Applications, a class for regular education students at Fox Chapel Area High School, a high school in suburban Pittsburgh. The students with ASD were provided with one-on-one tutoring support. Two of the five ASD participants self-initiated activities and engaged in generative thinking to a substantial degree over the course of the eight instructional sessions for which data was recorded. Two others demonstrated lesser amounts of this behavior, and one participant did not demonstrate any. The ASD experimental participants, as compared to a treatment group of three students with ASD who did not receive instruction in Excel, demonstrated improvement in a multi-step planning task which was significant. Keywords
Autism, spreadsheets, multi-step planning, computer curriculum, generative thinking
adapted
INTRODUCTION
Autism was first identified by Kanner [4]. It has since been described by Wing and Gould [7] in terms of a primary “triad” of differences commonly observed, which include decreased ability to interact in a “normal" way with others in social settings, delay in language acquisition and ongoing difficulties in communication, and impairment in imaginative abilities. Individuals with autism are also likely to display a low tolerance for change, interest in objects rather than in people, and repetitive behaviors. “Islets” of higher functioning may be Permission to make digital or hard copies of all or part of this work for personal or classroom use is granted without fee provided that copies are not made or distributed for profit or commercial advantage and that copies bear this notice and the full citation on the first page. To copy otherwise, republish, to post on servers or to redistribute to lists, requires prior specific permission and/or a fee. ASSETS 05, October 9?12, 2005, Baltimore, Maryland, USA. Copyright 2005 ACM 1-59593-159-7/05/0010...$5.00.
observed in the individuals. The great majority of individuals with ASD (Autism Spectrum Disorder) suffer from mental retardation [2], based upon standardized tests of IQ. Educational expectations are thus likely to be lower for many individuals with autism than they are for the neurotypical student. Many secondary school students with autism are identified as “Life Skills” students in school, where the emphasis in their schooling will not be on higher-level academics or preparation for further schooling. Researchers since Kanner have concentrated on particular areas of functional difference in attempting to provide an account of autism. Baron-Cohen, et al [1] look at the Theory of Mind (ToM), or the ability to make inferences about other’s mental states. There are various levels of ToM, which is thought to be developmental in nature, from the ability to point something out to another individual, through envisioning another’s state of mind, and even the understanding that someone else may hold a mistaken idea. The range of ToM abilities displayed by individuals with autism is thought to be lower than that displayed by neurotypical individuals. ToM provides a possible account for the social difficulties experienced by many individuals with autism. An account which concentrates on a different aspect of autistic difference is one based on executive function [3]. Some of the observed phenomena which might be accounted for in terms of executive function are planning ability and ability to inhibit actions, both of which are problematic for individuals with autism. The “weak central coherence” account [2] addresses the autistic individual’s tendency to see component parts rather than wholes, possibly accounting for superior skills on some visually-presented tasks. Recent work by Minshew and Goldstein [5] provides a more inclusive account that explains a variety of observed differences in terms of capacity for complex information processing. A variety of activities, from planning to envisioning another’s state of mind, require a heavy load of cognitive processing, and the individual with autism is seen as having a lesser capacity
in this area, leading to more difficulty in performing these “computationally heavy” activities. These accounts are compatible with several observations which are commonly made of individuals with autism. The first of these observations is that individuals with autism are likely to be primarily visual thinkers. The verbal or written skills of autistic individuals may be less well developed, although there is tremendous variability in this area. This combination of visual thinking with the possibility of less success in verbal thinking and verbal or written communication has some implications for educators of students with autism. One implication is that instruction should take into account a visual learning style. Another is that traditional assessments, which may be oriented more toward verbal than visual thinking, may fall short of accurately assessing the capabilities of individuals with autism. Using the wrong modality for asking questions may result in underestimating the functional capability of students with autism. To the extent that this happens, students with autism may have their educational opportunities inappropriately limited based upon standardized test scores. A second observation is that individuals with autism have greater difficulty with tasks requiring planning. Different accounts might focus on the cognitive load involved in planning, the factor of inhibition as a necessary component, or the imaginative capacity required to look ahead or envision a different state of affairs, but the various accounts are likely to be in agreement that tasks involving multi-step planning are more difficult for the individual with autism to carry out optimally. Related to the second observation, a third point, which is specifically noted in much of research on autism, is a lack of imaginative capacity or ability to do imaginative thinking. This is seen to be at work in ToM, manifesting itself as the lack of ability to envision, depending upon the level, another mind, the thoughts of the other mind, or the mistaken thoughts of the other mind. Pretend play is posited to be less likely in the child with autism, as is the generative thinking in areas such as mathematics, where neurotypical students are observed seeking alternative solutions to problems already solved, as part of the normal developmental process [6]. A belief that generative thinking is unlikely to be demonstrated by individuals with autism may become a self-fulfilling prophecy in the classroom if the prevailing pedagogy suggests that rote learning is what is within the capabilities of these students. Appropriately adapted instruction, taking into account characteristics such as visual learning style and the notion of cognitive load, may
enable individuals with autism to demonstrate skills not demonstrated in other contexts. The current study is motivated in part by observations from instructional sessions in which individuals with autism received instruction in Excel. Over the course of the instructional sessions, individuals with autism acted in ways which were not consistent with what the literature on autism had led us to expect. One student in particular, JB, regularly exhibited these behaviors, which included attempting to find a novel and alternative solution for a task for which a solution was already known; envisioning and attempting a “shortcut”; verbalizing, “what if I do this?”; and trying something known to be incorrect in order to see “what kind of error message I will get”. Envisioning a possible state of affairs and generating a novel solution strategy appeared to contradict the categorization of the autistic individual which posits less likelihood of imaginative thinking or counterfactual thinking. Observations with other students included instances of a variety of mathematics-related skills being demonstrated for the first time in the context of using Excel. We speculate that Excel (and spreadsheet applications in general) may provide optimal scaffolding for individuals with autism, thus enabling the demonstration of skills that would be found more difficult in other environments. A specific property of Excel that may provide such scaffolding is the graphic/visual nature of the application. The presentation of information in a spreadsheet format not only appears to be appropriate for visual learners, but may also lessen the cognitive load of the individual, providing, in effect, external working memory, and thus freeing up cognitive resources for other processing. An additional factor is that Excel may help with organizing the knowledge at hand, and in providing an ongoing organizational scheme for the user. We report the results of an experimental study examining individuals with autism learning Excel. High school age participants with autism who would not normally have the opportunity to take a class in this area because of their classification within the education system were assigned to either treatment (Excel instruction) or control conditions. We evaluate the learning of the subject matter by the treatment group, answering first the question of whether these students are capable of learning such material. Additionally, we look for examples of generative thinking over the course of instruction for the treatment group. Participants take a pretest and a posttest in which the three types of problems (rule induction, planning, and mathematics) are intended to elicit the behaviors of
interest (generative thinking) and scores are compared to assess transfer to generative thinking tasks.
school. An individual known to the student (parent, teacher, or counselor) administered the test jointly with the experimenter. Participants were permitted as much time as needed to complete the tests.
METHODS
Instruction:
Participants: The study included nine male students with ASD (Autistic Spectrum Disorder, as diagnosed by a physician). Eight of the nine were classified by their school districts as Life Skills students. These participants attended special schools for part or all of the school day, or the Life Skills classroom in a regular school. The remaining participant was a Learning Support student at a regular school. Participants ranged in age from thirteen to nineteen, and had no prior experience with Excel. Referrers were told that participants should be able to understand and follow instructions and be able to engage in a non-preferred activity for a period of approximately twenty minutes. Participants were required to have used a computer before, but no particular level of experience or competence was required. Referrals to the study were based on these criteria. Personnel who referred participants to the study included therapeutic and counseling personnel at schools, a counselor at the State (PA) Office of Vocational Rehabilitation, and a doctor at the University of Pittsburgh Medical Center. Design: Assignment to groups:
All students completed a problem solving pretest and posttest. Pretest scores provided the basis for assignment to treatment and control conditions. Based on numeric scores on the pretest, participants were ranked from highest to lowest score and divided into three groups. From each group, one individual was randomly assigned to the control condition, and the other two were assigned to the treatment condition. This procedure matched controls to treatment participants so that controls were drawn from a distribution of pretest scores. Structure of study: Participants in the treatment condition completed a sequence of eight Excel lessons with individual tutoring support, while controls did not receive any instruction. The same curriculum was used for all students, and covered inputting data, editing data, formatting data, doing arithmetic, graphing data, and using controls. In a separate session following the eighth lesson, students completed a posttest. Procedure: Administration of pretest and posttest: The assessments were administered online. They took place in a location familiar to the participant, at home or at
Sessions consisted of instruction while participants worked through exercises in Excel with feedback from the instructor, and self-directed activities. Participants received encouragement at each session to make use of items of interest to them as data (for instance, one’s collection of CDs or one’s golf scores), but were provided with data if they did not choose to do so. Participants who expressed interest in modifying the task at hand to fit their interests or to engage in another task within the Excel context were encouraged to do so. Participants pursued self-directed tasks in Excel until the participants judged the tasks complete or until they had been engaged in the particular task for 1.5 hours, at which time they were asked to save their work and shut down the computer. Curricular items were covered in the same order by all students. Differences in the speed at which participants worked and in the time spent on self-directed activities resulted in some differences in which session particular topics were covered in. Length of sessions ranged from twenty minutes to slightly over 1.5 hours. Instructional sessions were videotaped. Materials
Pretests and posttests: The tests were presented in an online format using testing software that was developed for the study. The pretest and posttest were identical in structure. Questions were different on the pretest and the posttest, but corresponding questions on the pretest and the posttest were designed to be at a similar level of difficulty. Pre- and posttests consisted of a rule induction test, a planning test, and an arithmetic test. Rule induction and arithmetic test results will be discussed elsewhere. Planning Test
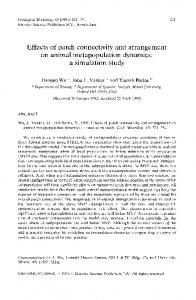
In the second section, participants were presented with a graphic of a set of cars and trucks in a grid which was described as a parking lot (Figure 1). The parking lot had a single exit. Participants were instructed to move their car, which was initially positioned in the center of the lot, to the exit, which was blocked by other vehicles, all of which were positioned horizontally or vertically. Each vehicle could be moved forward or backward by dragging with the mouse, and solution of the puzzle required moving vehicles which were in the way. All moves were logged, providing the number of moves, the number of
optimal moves, number of attempts at making illegal moves, and amount of time spent on the puzzle, as well as whether or not it was correctly solved.
and was assigned to treatment, but dropped out of the study before going any further.
10 treatment 11
control
11.2
treatment
11.2
treatment
11.3
control
11.8
treatment
12
control
12.1
dropped out
13.2
treatment
Table 1. Pretest scores and status. Figure 1. The posttest version of the Planning Test Instructional sessions:
The instructor utilized a syllabus along with individual session-specific lists of topics and exercises. Participants were prompted by the instructor to engage in activities in Excel. Excel worksheets prepared by the instructor were utilized by the participants in conjunction with some topics, and when the student did not provide his own data. RESULTS
One student, who was assigned to the treatment group, took the pretest but dropped out of the study without participating in any Excel sessions or the posttest. The five participants remaining in the treatment condition each completed eight sessions and subsequently took a posttest. Control participants took posttests during the approximate same calendar period as the treatment participants’ pretests. Following are results of pretests and posttests, Excel outcomes, and comparisons of pretest and posttest differences for treatment and control groups. Pretest Assignment:
Pretest and posttest scores are the sum of the points for all questions on the three sections of the test. The original pretest scores were listed in ranked order, as follows, and divided into the three highest scores, the next three scores, and the last three scores. From each group of three, a random assignment was made of two to treatment group, and one to control group. One participant took the pretest
Mastery of Excel topics:
During the course of the Excel sessions, all of the participants in the treatment condition were able to demonstrate some level of mastery of most of the Excel topics as indicated in Table 2 below. Mastery was judged by the experimenter over the course of instruction. The experimenter used a checklist of skills and noted on the checklist whether the participant could demonstrate the use of these skills independently or with one or more prompts. Excel topics:
Participants: T1
T2
T3
T4
T5
items covered: independent mastery
68% 98% 53% 73% 51%
partial mastery
30%
2%
36% 24% 47%
Total:
98% 100% 90% 97% 98%
all curriculum items: independent mastery
68%
98% 54% 59% 41%
partial mastery
30%
2%
Total:
98% 100% 90% 79% 79%
36% 20% 38%
Table 2. Mastery of Excel topics by participants in treatment group.
Comparison with a regular class:
The list of topics covered in the Excel curriculum was compared with the topics covered in the Excel segment of the Computer Business Applications (CBA) class at Fox Chapel Area High School, a high school in the Pittsburgh suburbs. Information regarding the curriculum, as well as the amount of instructional time for the Excel portion of Computer Business Applications was provided by the teacher of the class. Computer Business Applications is a class in the regular curriculum and, as such, would not normally be open to Life Skills students. Students taking CBA work on the computer during the instructional periods. The total amount of time during instructional periods devoted to instruction in Excel is approximately equal to the amount of instructional time for participants in the current study. The students in CBA have some additional lab time during which they work in Excel. Instruction in CBA differs in that it is group instruction, whereas in the Excel study, participants received one-onone tutoring support. The list of Excel topics covered ( in CBA and in the Excel study) was almost identical. Participant-generated data:
Participants were regularly encouraged to generate their own data for use in the sessions. Participants varied in the degree to which they did this, from having difficulty thinking of sources of data and having difficulty in responding to specific suggestions for data sources, to coming up with material of personal interest with apparent ease, to spontaneously generating ideas for data during the sessions. Participants T1 and T2 were most likely to come up with sources of data that were of interest to them with little or no prompting. Participants T3 and T4 were cooperative in coming up with data when prompted, but did not do so without prompting. Participant T5 required substantial prompting in order to generate any data of his own. Examples of participant-generated data include T1’s use of bands and genres of music, and T2’s use of video game system information, day camp menus, and Korean vocabulary words. T4 made use of baseball players and batting averages. Spontaneous engagement in self-directed activities:
Some participants generated activities or tasks of personal interest in spontaneous fashion. By this is meant that the participant designed a task for himself with no prompting from the instructor to design the task or to begin working on the task. Participants normally asked the instructor if they could deviate from the planned materials, and may have asked for assistance during the task, but the choice of tasks described as “spontaneous” was entirely the
participant’s, and was not in response to any prompts from the instructor to design a task. Participant T2 initiated and engaged in self-directed activities during seven sessions, Participant T1 did so during four, and Participant T3 did so during two sessions. Examples of self-directed activities include T1’s use of a worksheet for listing categories of music and bands exemplifying the categories; T2’s incorporation of three dimensional graphic content within a worksheet, and his incorporation of VBA code that would print a series of messages giving the observer the impression that the computer was about to crash; and T3’s use of Excel to calculate expected earnings from a part-time job. Other behaviors of interest observed:
Behaviors which fell outside of the expected range for individuals with autism were noted by the instructor. Behaviors were considered to be outside the expected range for this group if they demonstrated generative thinking or ToM. Participant T2 attempted to find an alternate method for accomplishing a task which had already been completed on several occasions, and regularly attempted, by his own description, to determine how to solve a new problem by comparing the problem to one which he felt was similar, and for which the solution was already known. In response to the instructor’s comment that she was unfamiliar with the bands Participant T1 used as data in session 2, T1 came up with some additional bands that he thought the instructor would know, envisioning the state of the instructor’s knowledge. In later sessions, T1 worked on “genres” of music, sometimes asking family members if they could provide examples of artists in the genre, and sometimes deciding not to ask because he determined that the individual “wouldn’t know” about the genre- specifics will go in table. Pretest and Posttest results:
A z test for the significance of the difference in independent proportions was used to compare four sets of values: total pretest and posttest scores of treatment and control groups, and pretest and posttest scores on the three individual test sections for treatment and control groups. A z score of 1.96 or greater is significant at the .05 level. Looking at the Planning Test, we find that 80% of the treatment group improved, as opposed to 0% of the control group, from pretest to posttest. The z score of 2.19 is above the 1.96, indicating that the improvement of the treatment group in this section can be considered reliable.
Planning Test: Participants:
T1 T2
T3
T4
T5 C1
C2
C3
Pretest:
0
0
0
1
1 0.5
0.5
1
Posttest:
1
1
0.5
1.5
0 0.5
0
0.5
Change:
1
1
0.5
1.5
-1
0 -0.5 -0.5
activities and activities which were self-initiated and selfdirected, some students clearly had the ability to do so, and did when given the opportunity. The students who chose a more constructivist path achieved substantial mastery over the subject matter. This would not be a surprising result in neurotypical individuals, but it is not what the literature of autism and education would lead us to expect. These students also appear to have gotten better at The Planning Test.
Table 3. Pretest and posttest results. DISCUSSION These data present evidence for the ability of individuals with autism to learn the spreadsheet application Excel. This result applies to individuals with autism who attend special schools or the Life Skills classroom in the regular school, as this is where the study population primarily came from. This is an important result, as these students are normally excluded from computing classes, as the unadapted computing class may be seen as, or may be, an inappropriate placement, while adapted computing classes are almost non-existent. This is not meant to suggest that regular computing classes, with no adaptations, are appropriate placements for students like the participants in the Excel/Autism study. The study data, however, strongly suggests that the learning of Excel is well within the cognitive capabilities of individuals with autism, given appropriate adaptations. Anecdotal evidence which, in part, motivated the Excel/Autism study, suggested that Excel may be not just a useful application to learn, but possibly an ideal learning environment. The Excel environment is likely to appeal to the visual learner, presenting relevant information onscreen, providing ongoing visual prompts and helping the user with the function of organization. Further, making all the relevant information available in onscreen may have the effect of lessening the cognitive load required to keep track of that information, thus freeing up cognitive resources for additional or higher-level tasks. While the present study has not provided a definitive answer to the question of whether there is something special about Excel as a learning tool or environment for individuals with autism, behavior outside of what the literature leads us to expect from individuals with autism demonstrated by some study participants over the course of the study suggests that this is an area for future research. In the area of pedagogy, study results suggest that the assumption of rote learning being the best for students with autism is inappropriate. While not all students who received Excel tutoring were able to engage in imaginative
In addition to making computing classes in areas such as Excel available to individuals with Excel, we would advocate an educational approach that recognizes the diversity of learning styles within this population and does not rely solely on the “rote learning” paradigm. Further research is needed to determine whether specific interventions or environments can play a role in increasing abilities such as planning, as well as whether Excel might be such an environment. Results indicating that differences in pretest and posttest performance for treatment and control groups are significant in the planning problem, along with the fact that the greatest gains were seen in the participants who came up with their own data and designed their own tasks suggest two implications. One is that it is possible for individuals with autism to demonstrate an increasing ability to plan. The other is that individuals with autism not only can engage in generative thinking, but that this kind of thinking, as demonstrated in both choosing data and designing tasks, may be tied to increasing ability to plan. The exact nature of the interaction cannot be determined from the current study, and further research is needed in this area. What we can say is that it is appropriate for educators of individuals with autism to consider providing opportunities for generative thinking in the classroom. It is also safe to say that opportunities to learn applications such as Excel are educationally appropriate for individuals with autism. ACKNOWLEDGMENTS
We thank Albert Corbett of Carnegie Mellon University and Jill Lehman of KidAccess, Inc., for their substantial contributions to this research. REFERENCES
1. Baron-Cohen, S., Ring, H., Moriarty, J. Schmitz, B. Costa, D., and Ell, P. (1994). Recognition of mental state terms: Clinical findings in children with autism and a functional neuroimaging study of normal adults. British Journal of Psychiatry, 165, 640-649. 2. Frith, U. (1992). Autism: Explaining the Enigma. Oxford: Blackwell. 3. Griffin, E.M., Pennington, B.F., Wehner, E.A., and Rogers, S.T. (1999). Executive function in young
children with autism. 832.
Child Development, 70, 817-
4. Kanner, L. (1943) Autistic disturbances of affective contact. Nervous Child, 2, pp. 217-250.
6. Siegler, R.S. (1996). How Children Generate New Ways of Thinking. In R.S. Seigler, Emerging Minds: The Process of Change in Children’s Thinking. Oxford: Oxford University Press.
5. Minshew, N.J, & Goldstein, G. Autism as a Disorder of Complex Information Processing. Mental Retardation and Developmental Disabilities Research Reviews, 4, 129-135, 1998.
7. Wing, L., and Gould, J. (1979): Severe impairments of social interaction and associated abnormalities in children: epidemiology and classification. Journal of Autism and Developmental Disorders, 9, pp. 11-29.