Biomed Eng Lett (2011) 1:180-187 DOI 10.1007/s13534-011-0029-4
ORIGINAL ARTICLE
Auto-detection of R Wave in ECG (electrocardiography) for PatchType ECG Remote Monitoring System Min Soo Kim, Young Chang Cho, Suk-Tae Seo, Chang-Sik Son and Yoon-Nyun Kim
Received: 14 June 2011 / Revised: 18 August 2011 / Accepted: 22 August 2011 © The Korean Society of Medical & Biological Engineering and Springer 2011
Abstract Purpose Analytic methods associated with P, QRS, and T waves in electrocardiography (ECG) are important in the diagnosis of cardiac disease. Many methods have been proposed to enhance the robustness and accuracy of automatic detection and analysis methods. Recently, remote monitoring with a mobile personal ECG using a patch-type electrode ECG remote monitoring system has been used in a variety of conditions. Therefore, a new, simple and easily implemented method for R wave detection from mobile ECG signals is needed. Methods The proposed method is able to detect R waves and R-R interval calculation in the ECG even when the signal includes in arrhythmia, baseline draft and abnormal signals. We evaluated the algorithm using the data acquired from patch-type electrode for validation purposes. Results The results show the strong possibility of the autodetection of R waves in QRS through a difference operation from an ECG source signal. The proposed algorithm provides good performance of a 99.8% sensitivity using patch-type electrode ECG databases. These results obtained are verified in relation to efficient R-wave detection algorithms. Conclusions The results of this study offer useful technology for experts who interpret ECG signals based on an on-line uMin Soo Kim, Suk-Tae Seo Biomedical Information Technology Center, Keimyung University, 194 Dongsan dong, Jung-Gu, Daegu 700-712, Korea Young Chang Cho Department of Information and Communication, Kyungwoon University Chang-Sik Son Department of Medical Informatics, School of Medicine, Keimyung University, 194 Dongsan dong, Jung-Gu, Daegu 700-712, Korea Yoon-Nyun Kim ( ) Department of Internal Medicine, School of Medicine, Keimyung University, 194 Dongsan dong, Jung-Gu, Daegu 700-712, Korea Tel : +82-53-580-3744 / Fax : +82-53-580-3745 E-mail :
[email protected]
health service. In the future, additional algorithms can be created that can detect and discriminate the symptoms of other cardiovascular diseases as needed for the purposes of u-healthcare. Keywords Patch-type electrode, Difference operation, R-R interval, Electrocardiogram (ECG), Arrhythmia, U-healthcare
INTRODUCTION The important of ECG analysis comes from the fact that it can discover cardiac diseases [1] such as ventricular fibrillation, arrhythmia, atria abnormality, and cardiac infarction. The characteristics of the P value, the QRS complex and the T wave as ECG signal components represent the clinical status of cardiac disease, and among these, the R wave properties are more significant. Among the many analysis algorithms, nonlinear and morphological algorithms have been proposed to detect the QRS complex [2-6]. Algorithms for detecting the R wave in the QRS complex of ECG signal have many applications including R-R interval analysis [7] of heart rate variability, ST-segment examinations, ECG compression. The time-varying morphology of ECG signal, the physiological variability of the QRS complex, and signal artifacts arise from various sources (i.e poor electrode contact, muscle contraction, patient movement artifacts and baseline wandering due to the respiration and saturation of the amplifiers) which makes difficulty to detect QRS complex [8]. Therefore, in an effort to improve the accuracy of the QRS complex detection, many different approaches have been reported, i.e., the use of a moving average filter [9], the use of digital fractional order operators [10], or the use of the wavelet family. Wavelet transform (WT) [11] is capable of processing stationary and non-stationary signals in both the time and frequency domains. The choice of the wavelet usually entails
Biomed Eng Lett (2011) 1:180-187
181
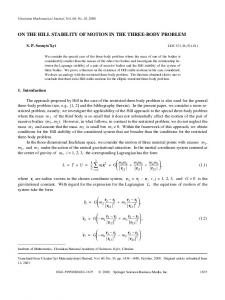
Fig. 1. Components of patch-type wireless ECG acquisition device, a personal server and a remote medical server.
the selection of a family, such as the Daubechies (db), Symlet (sym) of Coiflet (coif) families of wavelets, as well as an order within the chosen family [12]. In a prior study, researchers have been evaluated for ECG signals against the MIT BIH arrhythmia database [13-16]. In recent years, there’s been a growing interest in the development of uhealthcare systems [17, 18] for patient monitoring. The successful u-healthcare in hospital systems may enable medical teams to remotely monitor the patients conditions based on the ECG data transmitted over wireless or wired networks. In the present work, a single channel ECG monitor has been developed that successfully extracts ECG wave in a simple, wireless and cost effective manner. Patch-type electrode in this research is transmitted wirelessly as a means of patient monitoring via mobile service. The necessary hardware is small, and the overall devices are compact and portable. There are many differences as there are between signal properties of standard method and u-health environment. In this study of cardiovascular patients, ECG anlayses were carrying out via experiments using ECG data from patch-type electrode ECG remote monitoring system. In R wave detection method, the original ECG signal is firstly differentiated to emphasize the large slope of R wave and is filtered in order to reduce noisy signal components using mean filter. Comparing the results of our method with the results of a difference operation method and the use of a wavelet method shows the superior performance of the proposed method in R peak detection.
effectively prevent and control their health condition. ECG system is composed of a patch-type wireless ECG acquisition device, a personal server and a remote medical server, as shown in Fig. 1. Although there are some methods to detect cardiac arrhythmias like 25-hours holter monitoring or event recorder, long-term monitoring especially for the patients who have a very rate event has many limitations. Recently, advancement of mobile network systems has lead to development of wireless mobile cardiac monitoring system. From 2010 to 2011, a total of 15 patients who could not be diagnosed with conventional monitoring system 24hours holter monitoring were enrolled in this study. The ECG signals were transmitted to mobile phone by wireless system. The electrocardiograms recorded by mobile systems were transmitted to a web server of mobile center, and all the recordings were saved and evaluated. Of the 15 patients, 5 patients were diagnosed as ventricular tachycardia and treated by medication successfully. 5 patients were diagnosed with supraventricular tachycardia and received radiofrequency catheter ablation. There were also 5 patients who diagnosed as symptomatic premature ventricular contraction (PVC) and treated with medication successfully. Auto-detection programming of the ECG signal has been self-developed using Visual C++ software. Tests of the
MATERIALS AND METHODS For the elderly and chronic patients with cardiovascular disease who live alone, it is necessary to constantly monitor their physiological parameters, especially the ECG, to
Fig. 2. Experimental scene using patch-type electrode system and display of a sample test of ECG signal monitoring in subject.
182
Biomed Eng Lett (2011) 1:180-187
The threshold level λ is given in Eq. (5)
λ = µλ − rαλ
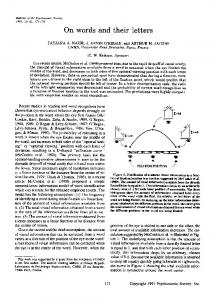
Fig. 3. The standard ECG are included in P, QRS complex and T wave.
algorithm on the ECG signals of arrhythmia patients proved its capability to detect R waves in a noisy ECG signal. Fig. 2, shows images of the patch-type ECG remote monitoring system. The standard ECG beat is shown in Fig. 3. The signal was sampled at rate of f = 300 Hz. Difference operation algorithm The proposed difference operation method is one of the most important ways in R wave detection. The R-wave of the ECG assessed for auto-detection using a difference operation, filter technology, and proper thresholding algorithms to find the accurate R position. The proposed difference operation algorithm is capable of rapid caluations and detection. Moreover, it has a robust structre. Therefore, a large number of signals can be assessed during an experiments. The detction algorithm is composed of four steps. The steps of this detection experiment for the R position are explained in below. In the equation, x[n] is the original ECG signal, 0 ≤ n ≤ N, and N is the total number of signal samples. Step-1: Obtain the difference signal xd by (1) xd[n] = x[n] − x[n − 1]
(1)
Step-2: Removing the high-frequency noisy signal components using a mean filter with a length of 5. xF[n] = xd[n] * m[n]
(2)
The * operator refers to a the 1D convolution operation. ⎧ 1 ⎫ ⎪ -------------- , –k ≤ n ≤ k ⎪ m[n] = ⎨ 2k + 1 ⎬ ⎪ 0, otherwise⎪⎭ ⎩
max
xw [ n ] = max [ xw [ k ], n ≤ k ≤ n + L ]
(4)
(6)
x
xw[n] is the weighted signal between the original signal and the difference signal as follows. xw[n] = wsx[n] + wdxd[n]
(7)
In Eq. (7), ws and wd are the weights between Eq. (1) x[n] and xd[n], given as follow. max
x ws = 1 – -----------------------max max x + xd
(8)
max
xd wd = 1 – -----------------------max max x + xd R position nR is determined as follows.
(9)
max
nR = max [ xˆ w [ k ], n ≤ k ≤ n + L ]
(10)
k
xˆ max w [n] is the signal after applying the threshold process max to xw [ n ] as follows. max ⎧ xmax w [ n ], if λ lower ≤ x w [ n ] ≤ λ upper xˆ max [n] = (11) ⎨ w 0, otherwise ⎩ λlower and λupper are threshold levels given in the Eq. (12) max
λlower = µw
max
Where m[n] is a filter mask. Step-3: Thresholding xF[n] with threshold level λ, as follows. ⎧ xF [ n ], if xF [ n ] > λ ⎫ xT[n] = ⎨ ⎬ ⎩0, otherwise ⎭
Here, µλ and αλ are calculated from the local maxima for each interval throughout the entire signal. r is an integer. When r is 1, the value of λ preserves about 84% of the high values of the signal, including the values at the R wave position. Step- 4: Finding the R positions from xT[n] The duration of each R-R interval is about 0.6~0.75 (182~227(samples)) second at a sampling frequency of 300 Hz. We will get the local maximum in every interval started from n at which xT[n] is greater than 0. L is an interval length. By default, L is selected 90 samples which is the half of the least number of samples in R-R interval.
λupper = µw (3)
(5)
max
µw
(12)
max
and αw
max
+ r' αw
(13) max
are calculated from the signal xw [ n ] .
RESULTS Patch-type electrode monitoring system is able to carry out a long-term monitoring on the elder’s or the chronic patient’s condition and is equipped with an emergency rescue to
Biomed Eng Lett (2011) 1:180-187
183
Fig. 5. (a) The R wave detected of ECG signal in patch-type electrode ECG database (b) The signal after difference signal. (c) The filtered signal. (d) The threshold signal.
Fig. 4. Flowchart included in control of weight value with difference operation algorithms for R wave detection.
mobile phone. Using patch-type electrode, the distances between electrodes are very short and this affects the morphology of ECG waveform. U-healthcare environment, the ECG can be interpreted include in many noise, it is often difficult to come to an exact decision. We have developed a new detection algorithm for easily analysis in ECG to overcome this kind of situation. We proposed algorithms for R wave auto-detection using a difference operation from ECG source signals. The existing study has R wave detection problem because difference of P wave or T wave signal are bigger than R wave variation rate by difference operation. The applied weight value R wave detection method proposed in this paper is possible to increase the detection rate by considering both characteristics of signal such as difference and the biggest signal amplitude value when difference of P wave or T wave signal are bigger than R wave. A flowchart of the R wave detection algorithm was including the ECG signal load, difference operation, mean filtering, threshold, extract R wave positions and R-R interval calculation is shown in Fig. 4. The algorithm requires a four-step process. Fig. 5a, b, c and d shows in original signal, differenced signal, filtered signal, threshold signal. Fig. 6 show in the result of R-R interval calculation.
Fig. 6. The result of R-R interval calculation.
In this paper, a filter method and a rapidly calculated algorithm termed the difference equation for detecting the R wave shown were used. The detection method involves finding the R position by applying the difference operation to the abnormal signals and any arrhythmia signals. Fig. 7a, b, c, d, e and f have show the detectability of the R wave, including the change in the QRS amplitude, PVC (premature ventricular contraction), supraventricular tachycardia and the extreme baseline draft through control of weight value and the difference operation algorithms. An analysis of the R wave of the PVC, supraventricular tachycardia and the arrhythmia signals provides very important clinical criteria for diagnoses of patients. This algorithm shows good performance for a patch-type electrode ECG database acquired from clinical patients. The heart rate is easy to compute with the R-R interval information. The performance of a particular run of the program, or a particular reading by
184
Biomed Eng Lett (2011) 1:180-187
a
b
c
d
Fig. 7. Using a difference operation, the R wave is detected at a location. This is an example of R wave detecion in a true ECG signal with baseline drift and a change in the QRS amplitude. (a) Original signal; with O showing the detection of the R wave. (b) The ECG signal of a patient acquired from the patch type electrode. One can observe the perfect detection of the R wave in the original signal. (c) An ECG signal with extreme baseline drift. (d) An ECG signal acquired from a cardiovascular patient. (e) Original signal; with O showing the detection of the R wave with baseline dtrift. (f) The ECG obtained from data data a patient with cardiovascular illness.
Biomed Eng Lett (2011) 1:180-187
185
e
f
Fig. 7. Continued.
an expert was evaluated in terms of detection error rate and sensitivity, where; Eq. (14) and Eq. (15). The algorithms were compared by calculating the number of false positives (FP), true positives (TP) and false negatives (FN) for each record. Here TP stands for true positive which is the total no
of peaks correctly detected by the detector. The detection error rate and sensitivity (se) of each method was calculated. FP + FN Detection Error rate = --------------------------------- × 100 Total of beats
(14)
Table 1. Comparison of the performance of the difference operation algorithm when applied to subjects from the acquired ECG database using the patch-type ECG remote monitoring system. Subjects
Total (beats)
FP
FN
FP+FN
FP + FN Detection Error rate = --------------------------------- × 100 Total of beats
TP Sensitivity Se = -------------------- × 100 TP + FN
A B C D E F G H I J K L M N O Average
2300 2311 1998 2459 2277 2166 2375 2199 2347 2266 2344 2155 2433 2164 2219 2267.5
1 2 2 3 1 4 1 1 3 0 2 5 3 2 1 2.13
0 4 3 2 0 2 2 2 0 3 4 4 2 4 1 2.20
1 6 5 5 1 6 3 5 0 5 9 6 5 6 2 4.33
0.04 0.26 0.25 0.20 0.04 0.28 0.13 0.23 0.00 0.22 0.38 0.28 0.21 0.28 0.09 0.19
100 99.7 99.7 99.8 100 99.7 99.9 99.7 100 99.7 99.6 99.7 99.7 99.7 100 99.8
186
Biomed Eng Lett (2011) 1:180-187
Table 2. Comparison of the proposed algorithm with other R wave detection method tested using the patch-type electrode ECG database. Comparison criterion
Proposed algorithm Hamilton-Tomkins
Detection error rate (%)
0.19
0.65
Sensitivity (%)
99.8
98.2
TP Sensitivity(se) = -------------------- × 100 TP + FN
(15)
Eq. (7) and Eq. (8) describe the ability of the difference operation algorithm and weight value to find the correct position number of the R wave from the ECG source signal. Most existing algorithms have shown R detection already achieves near 99% accuracy and sensitivity and specificity. However, if ECG signals measurement systems are used in simple calculation, fast, robust and efficient algorithms in R detection are so important. The difference or derivative of the QRS hence yields a larger value than that of the remainder of the signal. A squaring operation exploits this feature by amplifying the larger differences more than smaller differences, yet doing so in an exponential fashion. This method is easy to perform and does not need the long processing time. In this paper, digital difference bases algorithm for detecting R wave in QRS complex of ECG is developed. This algorism is reduces various noises present in ECG signals and generates peaks corresponding to the ECG parts with high slopes. Table 1 indicates the detection error rates and sensitivity. The average detection error rate is found to be 0.19%. Sensitivity is calculated to be 99.8% which shows the method has a good efficiency. A comparison of the performance of the proposed algorithm with the Hamilton-Tomkins detection [19] methods for the same patch-type electrode ECG database is given in Table 2. The performance of the methods compares favorably with the R wave detection and analysis method. Although the detection error rate and sensitivity are a little difference between the two methods, the proposed method, with its rapid calculation and simple theory method, a new direction in the area of ECG signal processing. We developed the new algorithm using a difference operation for the detection of R waves from a mobile personal ECG using a patch-type electrode. The proposed algorithm is suitable for the automatic detection of the ECG signals in u-health environment.
CONCLUSIONS In this paper, we proposed an algorithm that determines the exact position of the R wave in an ECG signal using the patch-type electrode ECG database. We applied a very simple developed algorithm and control of weight value which allows the detection of R-waves in ECG signals even if they are highly non-stationary and if the shape of the QRS
complex changes during clinical or experimental intervention. The R detection method is easy to use, and this operation and does not require complex equation calculations. Thus, a simple, fast, robust and reliable ECG detection method can be performed. Quantitative and qualitative analyses of the results were obtained from an analysis of ECG signals by difficult environment in the u-health system. The obtained results show a good trade-off between accuracy and speed. The methodology will be beneficial in analyses of various cardiovascular diseases. In this paper, ECG data were not numerous, as this study involved relatively few subjects. In our future research, the patch-type electrode ECG database is expected to attain excellent accuracy for ECG detection methods and the construction of an arrhythmia database for Koreans in the cardiovascular field can be accomplished.
ACKNOWLEDGMENTS This research was supported by a grant No. RTI04-01-01 from the Regional Technology Innovation Program of the Ministry of Knowledge Economy (MKE).
REFERENCE [1] Jhang K, Lee S, Seo D, Park J. Mechanical circulatory support to control medically intractable arrhythmias in pediatric patients after cardiac surgery. Korean Circ J. 2010; 40:471-4. [2] Pan J, Tompkins W. A real-time QRS detection algorithm. IEEE T Bio-Med Eng. 1985; 32:230-6. [3] Hamilton P, Tompkins W. Quantitative investigation of QRS detection rules using the MIT/BIH arrhythmia database. IEEE T Bio-Med Eng. 1986; 33:1157-65. [4] Kohler B, Henning C, Orglmeister R. The principles of software QRS detection. IEEE Eng Med Biol. 2002; 21:42-7. [5] Mehta S, Lingayat N. Development of entropy based algorithm for cardiac beat detection in 12-lead electrocardiogram. Signal Process. 2007; 87:3190-201. [6] Fard J, Moradi M, Tajvidi M. A novel approach in R peak detection using hybrid complex wavelet. Int J Cardiol. 2008; 124:250-3. [7] Christov I. Real-time electrocardiogram QRS detection using combined adaptive threshold. Biomed Eng. 2004; 32:8. [8] Friesen GM, Jannett TC, Jadallah MA,Yates SL, Quint HT, Nagle HT. A comparison of the noise sensitivity of nine QRS detection algorithms. IEEE T Bio-Med Eng. 1990; 7:85-98. [9] Chen S, Chen H, Chan H. A real-time QRS method based on moving-averaging incorporating with wavelet denoising. Comput Meth Prog Bio. 2006; 82:187-95. [10] Benmalek M, Charef A. Digital fractional order operators for R wave detection in ECG signal. IET Signal Process. 2009; 5:38191. [11] Li C, Zheng C, Tai C. Detection of ECG characteristic points using wavelet transforms. IEEE T Bio-Med Eng. 1995; 42:21-8. [12] Groswarmi J, Chan A. Fundamentals of wavelets: Theory, Algorithms and Applications, John Wiley & Sons, Inc., New
Biomed Eng Lett (2011) 1:180-187
York, 1999. [13] MIT-BIH Database Distribution, Massachusetts Institute of Technology. Cambridge: MA; 1998. [14] Moody G, Mark R. The impact of the MIT-BIH arrhythmia database. IEEE Eng Med Biol Mag. 2001; 20:45-50. [15] Yaghouby F, Ayatollahi A, Soleimani R. Classification of cardiac abnormalities using reduced features of heart rate variability signal. World Appl Sciences J. 2009; 6:1547-54. [16] Yeh Y, Wang W. QRS complex detection for ECG signal.
187
Comput Meth Prog Bio. 2008; 91:245-54. [17] Sneha S, Vashney U. Enabling ubiquitous patient monitoring. Decis Support Syst. 2009; 46:606-19. [18] Chung W, Lee S, Toh S. WSN Based mobile u-healthcare system with ECG, blood pressure measurement function: IEEE EMBS Conf. 2008:20-4. [19] Hamilton P, Tompkins W. Quantitative investigation of QRS detection rules using the MIT/BIH arrhythmia database. IEEE T Bio-Med Eng. 1986; 33:1157-65.