Journal of Network and Computer Applications 95 (2017) 26–41
Contents lists available at ScienceDirect
Journal of Network and Computer Applications journal homepage: www.elsevier.com/locate/jnca
Auto-scaling web applications in clouds: A cost-aware approach a,⁎
b,⁎
MARK c
Mohammad Sadegh Aslanpour , Mostafa Ghobaei-Arani , Adel Nadjaran Toosi a b c
Department of Computer Engineering, Jahrom Branch, Islamic Azad University, Jahrom, Iran Department of Computer Engineering, Qom Branch, Islamic Azad University, Qom, Iran Cloud Computing and Distributed Systems Laboratory, School of Computing and Information Systems, The University of Melbourne, Australia
A R T I C L E I N F O
A BS T RAC T
Keywords: Auto-scaling Resource provisioning Cloud resource Cost-aware Web application Service level agreement (SLA)
The elasticity feature of cloud computing and its pay-per-use pricing entice application providers to use cloud application hosting. One of the most valuable methods, an application provider can use in order to reduce costs is resource auto-scaling. Resource auto-scaling for the purpose of preventing resource over-provisioning or under-provisioning is a widely investigated topic in cloud environments. The Auto-scaling process is often implemented based on the four phases of MAPE loop: Monitoring (M), Analysis (A), Planning (P) and Execution (E). Hence, researchers seek to improve the performance of this mechanism with different solutions for each phase. However, the solutions in this area are generally focused on the improvement of the performance in the three phases of the monitoring, analysis, and planning, while the execution phase is considered less often. This paper provides a cost saving super professional executor which shows the importance and effectiveness of this phase of the controlling cycle. Unlike common executors, the proposed solution executes scale-down commands via aware selection of surplus virtual machines; moreover, with its novel features, surplus virtual machines are kept quarantined for the rest of their billing period in order to maximize the cost efficiency. Simulation results show that the proposed executor reduces the cost of renting virtual machines by 7% while improves the final service level agreement of the application provider and controls the mechanism's oscillation in decision-making.
1. Introduction With the rapid development of cloud computing, nowadays, instead of purchasing computing infrastructure, many application providers (APs) tend to host their applications on cloud resources offered by cloud providers (CPs). Cloud providers such as Amazon EC2 (EC2) offer resources to the AP in the form of Virtual Machines (VMs) with the scalability feature and pay-per-use charging model (Lorido-Botran et al., 2014; Coutinho et al., 2015; Qu et al., 2016). The AP, the application, and application users can be a webmaster, online store website, and end users, respectively. Since the AP, in particular, the Web application provider is aware of the dynamics of the Web environment and end users requests, static resource provisioning is not efficient. The reason is that in static resource provisioning, with increased rate of incoming user requests, resource under-provisioning occurs which consequently results in interruption or delayed response to user requests. On the other hand, in the period of reduced traffic, the issue of resource over-provisioning occurs and as a result increased AP costs arise (Qu et al., 2016; Arani and Shamsi, 2015). Therefore, considering the various pricing models
⁎
in the cloud (Qu et al., 2016; Shen et al., 2014), the AP usually prepays a minimum number of resources for its permanent and long-term needs to receive a discount for this type of rental (for example, reserved instances in EC2 receive a discount of up to 75%). Consequently, with load fluctuations, the AP seeks to use the short-term rental model to cover its temporary needs (for example on-demand machines in the form of pay per hourly use). However, this approach is not enough as it requires a mechanism capable of automatically determining the capacity and the number of rented on-demand resources proportional to the incoming load (Amiri and Mohammad-Khanli, 2017). Presentation of an efficient auto-scaling mechanism is a research topic which is mainly faced with the challenge of maintaining a balance between cost reduction and the Service Level Agreement (SLA). IBM proposes a model for autonomous management of auto-scaling mechanism in the form of MAPE (Monitor-Analyze-Plan-Execute) loop as a reference model (Computing, 2006). The MAPE loop model can be applied to implement a cloud web application system which knows its state and reacts to its changes. Therefore, the majority of auto-scaling mechanisms are based on the MAPE loop (Lorido-Botran et al., 2014; Qu et al., 2016; Mohamed et al., 2014; Ghobaei-Arani et al., 2016;
Corresponding authors. E-mail addresses:
[email protected] (M.S. Aslanpour),
[email protected],
[email protected] (M. Ghobaei-Arani),
[email protected] (A. Nadjaran Toosi). http://dx.doi.org/10.1016/j.jnca.2017.07.012 Received 18 February 2017; Received in revised form 13 July 2017; Accepted 17 July 2017 Available online 18 July 2017 1084-8045/ © 2017 Elsevier Ltd. All rights reserved.
Journal of Network and Computer Applications 95 (2017) 26–41
M.S. Aslanpour et al.
scaling or applying cooling time in the execution of the commands as the method for overcoming this challenge (Qu et al., 2016). This paper presents a scaling mechanism equipped with a super professional executor (Suprex) with a cost-aware approach. We seek to show that the execution phase of the MAPE cycle can play an effective role in cost saving. We explain all four phases as they are required for the full implementation of the auto-scaling mechanism. This is also required for better understanding of the paper. The auto-scaling mechanism offered in this research is different from others where the focus is mainly on improving the mechanism's performance in the monitoring, analysis, and planning phases rather than the execution phase. The reason why the execution phase was overlooked lies in the fact the actions are often considered under the control of the CP and the CP is considered as a black box. However, by applying an architecture with full control (Casalicchio and Silvestri, 2013) from the AP's perspective, the power is granted to the AP in the execution of all scaling commands. The main contributions of this research are as follows:
Weingärtner et al., 2015). MAPE-based mechanisms constantly repeat the four general processes of the monitoring, analysis, planning, and execution, in a way that a monitor iteratively gathers information about resources, for example, the status of resource utilization. After monitoring, the auto-scaling mechanism indicates the analysis process (Qu et al., 2016) to start which can be simple or complicated; simple analysis is the use of raw information obtained by the monitor, while complex analysis discovers knowledge from information using methods such as artificial intelligence or machine learning (Amiri and Mohammad-Khanli, 2017; Ghobaei-Arani et al., 2017a). Afterward, by matching obtained analyses to a series of rules predefined by the AP, the planner makes scale-up or down decisions (rule-based planner (Qu et al., 2016)). The final phase of the MAPE cycle is the execution of the decision by the executor. This is when the auto-scaling mechanism needs to send a request for instantiation of a new VM or release of the one of the VMs previously rented from the CP. This research focuses on improving the performance of the executor in the resource auto-scaling mechanism with a cost-aware approach. The motivation behind the improvement of the executor's performance lies in the following: Thanks to the possibility of selecting different types of VMs with various capacities, APs can rent a large number of VMs of different types simultaneously; considering the intense workload fluctuation in the Web environment, this is highly possible to happen (Singh and Chana, 2016). That said, if the autoscaling mechanism makes a scale-down decision, the executor needs to select from a diverse set of rented VMs and release one. The basic question posed here is whether it matters which VM is selected? If the answer is yes, what policy is the best to be used for this selection? Unlike Amazon's auto-scaling policy that always selects the oldest VM for release (as default executor) and according to the dark spots seen in related research (Ghobaei-Arani et al., 2016; Islam et al., 2012; Huang et al., 2012; Bankole and Ajila, 2013; Ajila and Bankole, 2013; Herbst et al., 2014; Qavami et al., 2014; García et al., 2014; Singh and Chana, 2015; Fallah et al., 2015; de Assunção et al., 2016), this selection should be made cautiously and rigorously. This is because, firstly, the CP calculates partial billing as full billing (billing cycle) (Moldovan et al., 2016; Li et al., 2015). For example, in the EC2 service, billing is carried out on an hourly basis and the release of a VM for a duration of 4 h and 1 min would result in billing for 5 h. Therefore, policy making for minimizing the minutes wasted in the release of surplus VMs is an important economic matter for the AP. Secondly, due to unresolved load balancing challenges (Khan and Ahmad, 2016), candidate VMs are probably processing different workloads and the influence of releasing each VM on the SLA would vary. Hence, the first purpose of the present research is to employ novel policies, especially cost saving ones, in the selection of surplus VMs (professional executor). A research gap can be still seen after the selection of the surplus VM and before its release. On the one hand, it is likely that the selector did not manage to find a VM with exactly X hours of use. In this situation, the release of that VM would impose extra costs. On the other hand, a scale-up decision may be made immediately after the release of the surplus VM; in this case, the delayed startup of the new VM is a challenge which negatively affects SLA (Lorido-Botran et al., 2014; Coutinho et al., 2015; Qu et al., 2016). Due to the unpredictability of the Web environment (Panneerselvam et al., 2014; Gholami and Arani, 2015) or maladjustment of scaling rules (Qu et al., 2016), it is highly likely that the mechanism to be affected by contradictory actions when the mechanism is in an oscillation condition (Lorido-Botran et al., 2014; Qu et al., 2016). As a result, the following hypothesis is put forward: If the selected surplus VM stays rented by the AP until the last minute of the bill, it can possibly be used for the improvement of the scaling mechanism's performance. Therefore, the other goal of this research is to offer an executor with the ability to quarantine the surplus VM until the billed hour is completed in order to resolve the challenge of delayed VM startup (super professional executor - Suprex). This is while to date, researchers merely considered benefits of vertical
1. We designed an auto-scaling mechanism based on the MAPE concept for Web applications, 2. We enhanced the effectiveness of the execution phase of the control MAPE loop with a cost-aware approach, 3. We provided an innovative solution for overcoming the challenges of delayed VM startup, 4. We designed an executor in order to mitigate oscillation and increase the stability of the mechanism, and 5. We conducted a series of experiments to evaluate the performance of proposed approach under real-world workload traces for different metrics. The rest of the article is organized as follows: Section 2 provides the necessary background. Section 3 includes related work; Section 4 fully explains the proposed approach. Section 5 simulates and evaluates the performance of the Suprex executor. Section 6 discusses the experimental results in details. Finally, Section 7 presents conclusions and future work. 2. Background This section provides a brief overview of autonomic computing and application adaptation. 2.1. Autonomic computing The increasing complexity of computer systems makes it essential to handle them autonomically. IBM's Autonomic Computing Initiative has helped to define the four properties of autonomic systems: selfconfiguration, self-optimization, self-healing, and self-protection (Computing, 2006). Cloud computing providers manage their data centers in an efficient way, taking cues from well-established autonomic computing practices. Particularly, tasks like VM provisioning, disaster recovery, capacity management, etc. are performed autonomically (Dhingra, 2014). To effectively manage cloud deployed web applications, we need to react to regularly occurring or anticipated events in the system (Ghobaei-Arani et al., 2017b). In (Computing, 2006), IBM proposes a model for autonomous management in the form of an autonomic MAPE-K loop as a reference model. The MAPE-K loop model can be applied to implement a cloud web application system which knows its state and reacts to changes in it. This model details different components that allow an autonomic manager to self-manage properties, namely Monitor, Analyze, Plan, Execute and Knowledge (Rheddane, 2015). The MAPE-K loop model is depicted in Fig. 1 and discussed in the remaining part of this section. The MAPE-K loop model is applied to auto-scaling of web applications in the cloud environment. The auto-scaling process of web 27
Journal of Network and Computer Applications 95 (2017) 26–41
M.S. Aslanpour et al.
horizontal scaling capabilities. The workload of cloud web applications is continuously changing over time and unexpected peaks of requests can happen which makes the system incapable of responding to these unpredicted changes. For this reason, the autonomic adaptation is an emerging solution to automatically adapt the resources allocated to the application according to the incoming traffic, CPU-utilization, and other metrics (STEBLIUK, 2016). In this paper, we apply the MAPE-K loop model to the autonomic adaptation of cloud web applications. A concrete example of automatic infrastructure management is Amazon's Auto Scaling (Amazon, 2015), which manages when and how an application's resources should be dynamically increased or decreased. Furthermore, this paper focuses specifically on the Execution phase. In other words, the system is monitored, analyzed and the adaptation plan is produced that is executed by a super professional executor (Suprex) with a cost-aware approach.
Fig. 1. The control MAPE-K loop.
3. Related works
applications matches the MAPE-K loop model, which dynamically adapt the resources assigned to the web applications, depending on the input workload (Qu et al., 2016; Huebscher and McCann, 2008). The autonomic manager interacts with the managed element (e.g., web application resources) through two interfaces that are the sensors and effectors to supervise and act on the system, respectively The MAPE-K loop model consists of four phases: Monitoring (M), Analysis (A), Planning (P) and Execution (E). Monitoring phase involves capturing properties of the managed element that can be software or hardware components used to perform monitoring; they are called sensors. The monitor component is responsible for collecting information about the metrics of the low-level metrics (e.g., CPU utilization, memory usage, and network traffic, etc.) and high-level metrics (e.g., rate of request arrival, type of requests, size of requests, etc.) during the monitoring phase. These different sets of monitoring parameters are stored in a knowledge base for use by other components. The knowledge base in the MAPE-K loop model shares data between the actual MAPE phases. The analysis phase is responsible for processing the information gathered directly from the monitoring phase. During the analysis phase, the system determines whether it is necessary to perform scaling actions based on the monitored information. The planning phase is responsible for the estimation of the total number of resources to be provisioned/de-provisioned in the coming scaling action. It follows rules that can be as simple as an eventcondition-action policy, which is easy to implement and fast to compute, or take the form of utility functions, which try to optimize a given property of the managed systems. The execution phase is responsible for executing the actions decided in the planning phase. It can be implemented by the automation APIs (i.e., effectors) available for the environment and the runtime configurability of the cloud web application.
This section is an overview of related works in the field of autoscaling for web applications. It is centered on the studies focused on each MAPE phase and applied techniques. Note that research is considered to be focused on the analysis phase if it benefits from complex analysis, e.g., neural networks; research is considered to be focused on the planning phase if planning regarding the capacity and the number of resources is conducted based on several scaling indicators. In the analysis phase, the analysis is carried out with reactive or proactive policies. In the planning phase, the decisions are made by two categories of scaling indicators: (1) low-level scaling indicators, at the hypervisor/physical level; (2) high-level scaling indicators, which are related to the application criteria. For scaling decision-making in the planning phase, different techniques such as rule-based decisions, analytical modelling, and machine learning are often used for resource estimation. Moreover, in the execution phase, scaling is done with horizontal and vertical methods which work with replication-based and resizing-based techniques, respectively. 3.1. Works focused on the analysis phase of MAPE Focusing on the analysis of resource utilization using the neural network and linear regression, Islam et al. (2012) studied the issue of resource provisioning. Huang et al. (2012) also paid attention to proactive analysis of scaling indicators and took advantage of Double Exponential Smoothing to predict resource utilization. Bankole and Ajila (2013) and Ajila and Bankole (2013) focused on the analysis of indicators with several neural networks. Moreover, other than utilization, they considered the scaling indicators of throughput and response time. In another work, Kaur and Chana (Kaur and Chana, 2014) sought to focus on analysis and planning phases (with more effort in the analysis phase). They offered a complete analysis of effective indicators and conducted resource capacity planning using a decision tree. Mohamed et al. (2014) investigated a MAPE cycle-based scaling mechanism with a purely reactive policy using the scaling indicator of the response time. Because their method is reactive, it faces challenges at the time of reconfiguration. Herbst et al. (2014) analyzed the workload in a way that in each monitoring stage, a prediction method is selected with the least errors (proactive policy); the categorization of prediction methods from simple to complex is an important contribution of this study. In a different work, with a focus on the analysis of workload properties, Singh and Chana (Singh and Chana, 2015) conducted a study on workload clustering and its distribution between resources considering the QoS features of each workload. de Assunção et al. (2016) analyzed user patience on autoscaling with a proactive policy. Toosi et al. (2017) propose a reactive auto-scaling mechanism working based on threshold-based rules to help their load balancing approach for utilization of renewable energy.
2.2. Application adaptation The migration of existing applications to the cloud environment requires adapting them to a new computing paradigm (Baker et al., 2013). Many applications are not ready to be moved to cloud because the environment is not mature enough for this type of applications (Andrikopoulos et al., 2013; Cavalcante et al., 2013). The focus of most existing works is on migration of the entire application to the cloud environment based on virtualization technology and using of VMs as the means for migration and running it in the cloud environment. This way, the adaptation of the application is limited to the method that the application manages its resources (Baker et al., 2013). Application adaptation in this domain is designated to how to manage a dynamic amount of VMs in trade-off with the cost of resources. Nowadays, the cloud web applications are often deployed and executed on a cloud infrastructure which provides a convenient on-demand approach for renting resources and easy-to-use 28
Journal of Network and Computer Applications 95 (2017) 26–41
M.S. Aslanpour et al.
Table 1 Overview of related works in the field of auto-scaling. Study (Research)
Approach
Focused Phase Monitoring
Islam et al. (2012) Huang et al. (2012) Bankole and Ajila (2013) Ajila and Bankole (2013) Casalicchio and Silvestri (2013) Mohamed et al. (2014) Herbst et al. (2014) García et al. (2014) Qavami et al. (2014) Singh and Chana (2015) Fallah et al. (2015) Kaur and Chana (2014) Beltrán (2015) Ghobaei-Arani et al. (2016) de Assunção et al. (2016) Moldovan et al. (2016) Moltó et al. (2016) Aslanpour and Dashti (2016, 2017) Toosi et al. (2017) Proposed
Load prediction Resource-aware Resource-aware Resource-aware Resource-aware SLA-aware Load prediction SLA-aware Resource-aware SLA-aware Resource-aware SLA-aware Resource-aware Resource-aware Load prediction Cost-aware Resource-aware SLA-aware Resource-aware Cost-aware
Analysis
Technique Planning
Execution
✓ ✓ ✓ ✓ ✓ ✓ ✓ ✓ ✓ ✓ ✓ ✓ ✓ ✓ ✓ ✓ ✓ ✓ ✓ ✓
Policy
Scaling Indicator
Resource Estimation
Scaling Method
Proactive Proactive Proactive Proactive Reactive
Low level Low level Hybrid Hybrid Hybrid
Machine learning Machine learning Machine learning Machine learning Rule-based
Horizontal Horizontal Horizontal Horizontal Horizontal
Reactive Proactive Reactive Proactive Proactive Hybrid Hybrid Reactive Proactive Proactive Proactive Reactive Hybrid
High level High level High level Low level Hybrid Low level Hybrid High level Low level Hybrid Low level Low level Hybrid
Rule-based Rule-based Rule-based Machine learning Analytical modelling Machine learning Analytical modelling Analytical modelling Machine learning Rule-based Rule-based Analytical modelling Rule-based
Horizontal Horizontal Horizontal Horizontal Horizontal Horizontal Horizontal Hybrid Horizontal Horizontal Horizontal Hybrid Horizontal
Reactive Hybrid
Low level Hybrid
Rule-based Rule-based
Horizontal Horizontal
Casalicchio and Silvestri (Casalicchio and Silvestri, 2013) were the only ones who considers the execution of scale-down commands according to the status of the last hour. Moltó et al. (2016) executed scale-up commands using the unused capacity of other VMs with an oversubscription policy. In studies by Aslanpour and Dashti (Aslanpour and Dashti, 2016), Aslanpour and Dashti (Aslanpour and Dashti, 2017), and Moldovan et al. (2016), scale-down decisions are executed by selecting the surplus VM with Last Up First Down (LUFD or the youngest VM), First Up First Down (FUFD or the oldest VM), and cost-aware methods, respectively. Table 1 shows a summary of related works according to their proposed approaches, the extent of their focus on the four phases of MAPE, and used techniques.
3.2. Works focused on the planning phase of MAPE Casalicchio and Silvestri (Casalicchio and Silvestri, 2013) focused on both analysis and planning phases (with more focus on the planning phase) and studied the performance of different architectures by presenting 5 scaling rules (rule-based resource estimation). García et al. (2014) tried to improve the planner to reduce the cost and maximize QoS with a reactive SLA-aware policy. Qavami et al. (2014) also tried to improve the planner, but they used a resource-aware approach utilizing machine learning. Focusing on the analysis of resource capacity, Fallah et al. (2015) used learning automata and conducted resource planning with a reactive and proactive method. Beltrán (Beltrán, 2015) considered planning for vertical and horizontal scaling; he provided an automated resource provisioning framework for multi-tier cloud applications with an approach to the realization of user needs and reducing AP costs. Moltó et al. (2016) conducted scaling planning with the possibility of horizontal and vertical scaling. They improved planning using oversubscription and live migration techniques. In another effort, Ghobaei-Arani et al. (2016) provided a resource provisioning framework based on the MAPE concept; their focus was on the planning phase where they predicted the future of resource utilization with the help of a learning automata. Aslanpour and Dashti (Aslanpour and Dashti, 2016, 2017) sought to improve the mechanism's performance with two-sided planning based on resource utilization and SLA status with a combined reactive and proactive policy. Lastly, Moldovan et al. (2016) analyzed cost and cost-aware decision-making for releasing surplus VMs based on cost saving, while none of the other indicators effective in decision-making, such as resource utilization or user response time were considered. In general, the majority of research investigate scaling indicators (Islam et al., 2012; Huang et al., 2012; Bankole and Ajila, 2013; Ajila and Bankole, 2013; Herbst et al., 2014; Singh and Chana, 2015; Fallah et al., 2015; de Assunção et al., 2016), most others improve the planner (Mohamed et al., 2014; Ghobaei-Arani et al., 2016; Qavami et al., 2014; García et al., 2014; Beltrán, 2015; Moltó et al., 2016; Aslanpour and Dashti, 2016, 2017), and some improve both phases (Casalicchio and Silvestri, 2013; Kaur and Chana, 2014). Since the monitoring phase is merely the collection of information for other steps, it cannot be considered as a research focus. Anyway, solutions are rarely provided for the improvement of the executor.
4. Proposed approach This section details the proposed scaling mechanism equipped with a Suprex executor. This mechanism conducts its operation based on the MAPE concept with an approach to cost-saving and exploitation of surplus resources. Afterward, the problem formulation is explained and the algorithm needed for the implementation of the proposed mechanism is presented. 4.1. Auto-scaling mechanism An overview architecture of cloud-based web applications can be seen in Fig. 2. In this architecture, the three entities of the end user, AP, and CP interact with each other using a top-down strategy. The end users send their request to the Web application via devices connected to the Internet. The AP forwards the incoming request to the VM provisioned for the application tier via the load balancer. The web application has a three-tier architecture and an independent VM is generally provisioned for each tier. User requests can have access to different tiers for response. After processing, VMs deliver the appropriate response to the user. The AP has an auto-scaling mechanism by which it determines the number of required VMs considering the fluctuation in the incoming load. The contribution of this research lies in the improvement of the auto-scaling mechanism in the execution phase. CP is in the lowest layer of the cloud environment architecture and provides the AP with computational resources in the form of VMs with the pay per use charging model. 29
Journal of Network and Computer Applications 95 (2017) 26–41
M.S. Aslanpour et al.
4.1.2. Professional executor Through an aware selection of surplus VMs while executing scaledown commands, the Professional executor fills the gap in the behavior of the Default executor. Thus, as it can be seen in Fig. 3b, this executor benefits from an internal part called surplusVMSelector for aware selection of surplus VMs. This is important from two aspects: Since CPs consider partial billing cycles for rented VMs as a full billing cycle (Moldovan et al., 2016), why not select the VM with greater use of its last billing cycle? This fact and the attempt to minimize wasted minutes lays the groundwork for providing a costaware surplus VM selection policy. There are VMs with unequal loads, the release of each has a different impact on the SLA. This is inevitable for two reasons: firstly, load balancing challenges in the cloud (Khan and Ahmad, 2016), and secondly three-tiers architecture of Web applications which requires a different service time for each tier (Qu et al., 2016; Kaur and Chana, 2014). This issue lays the groundwork for the load-aware surplus VM selection policy. Therefore, aware selection of surplus VMs is realized with costaware and load-aware policies in the proposed Professional executor. 4.1.3. Super professional executor In the surplus VM selection policy, the Professional executor aims to select the VM with the greatest utilization of the last hour of use. Since it is possible that none of the candidate VMs have exactly X hours of use (according to the Amazon's pattern) (Moldovan et al., 2016), waste of cost is still possible for the AP. The solution for this issue and turning it into an opportunity is to quarantine the surplus VM for the AP until the invoice period is completed (see Fig. 3c). Therefore, other than applying specific policies in surplus VM selection, Suprex sends surplus VMs to quarantine (rather than immediate release). The advantage of quarantining surplus VMs is that if, for example, the elapsed time of renting the VM is 5 h and 20 min, by quarantining it during the remaining 40 min before the release deadline, it can be utilized if the planner makes a scale-up decision during this 40 min (due to the intensity of the incoming load, maladjusted rules, or contradictory actions in the mechanism), this VM can be restored and utilized. In order to manage quarantined VMs, Suprex requires an updater to check the release deadline of quarantined VMs every minute and release them on the due time. The updater is placed at the end of the MAPE cycle so that if scale-up decisions and the release deadline of a VM coincide, the VM is restored before it is released (Fig. 3c). This can prevent SLA violation caused by the startup of a new VM through a timely restore of the quarantined VM. Thus, Suprex overcomes the challenge of delayed startup of a new VM. How and why are surplus VMs quarantined? In the EC2 service, VMs experience different statuses throughout their life cycle (see Fig. 4). They are first requested by the AP, and then put in the Pending (Startup) status. Depending on the time of the day, the
Fig. 2. An overview architecture of cloud-based web applications.
Cloud Resource Auto-scaling is constantly possible within four phases of MAPE (see Fig. 2). If the planner's interpretation of the analyses is resource under-provisioning, the executor acts on adding a new VM. On the other hand, if the planner's interpretation of the analyses is resource over-provisioning, the executor acts on releasing a VM by selecting a VM from on-demand VMs and releasing it. This section continues with the explanation of the innovative aspects of the proposed mechanism - the improvement of the execution of scaling commands by Suprex. In order to differentiate the novel features of Suprex, the common (default) executor in auto-scaling mechanisms is first shown. Afterward, the aware surplus VM selection feature in the execution of scale-down commands is added to it for cost saving purposes (professional executor). Finally, the proposed Suprex executor is completed by adding the surplus VM quarantine feature in order to overcome the challenge of delayed startup of new VMs. 4.1.1. Default executor The common executor in research adopts the scaling commands from the planner without applying any specific policy (see Fig. 3a). However, the most important drawback of this approach is that selection of surplus VMs for release happens without specific strategy; that is, in the Default executor, the selection is conducted randomly or in a better case, with LUFD (Aslanpour and Dashti, 2016) or FUFD (Aslanpour and Dashti, 2017) policies.
Fig. 3. The executing component in the MAPE-based auto-scaling mechanism; part a) is the Default executor, part b) is the Professional executor, and part c) is the Super Professional executor.
30
Journal of Network and Computer Applications 95 (2017) 26–41
M.S. Aslanpour et al.
Fig. 4. The Life Cycle of a virtual machine after adding the quarantine status. AL
number of requested VMs, operating system, VM size, and the server's geographical location, this status can take up several minutes (Mao et al., 2012). After Startup, the VM is put in the InService status and is able to receive the load sent by the load balancer and process it; this means that from this time onwards, the AP can leave end user requests to the VM for processing. By default, if the AP intends to quarantine the VM in a way that it is out of reach of the load balance, it has to change its status to Stopped or Standby. Nonetheless, restoring the VM from these statuses to the InService status is faced with difficulties such as:
Miu =
(2)
AL
In this equation, the utilization of all VMs is calculated and divided by the total number of all rented VMs (AL). Eq. (3) is also used to calculate the utilization of each VM separately at time i. CurrentCloudlets
VMi Utilization =
(1) Restoring VMs from Standby and Stopped statuses requires going through the delayed startup. (2) When a stopped VM wants to be restored, it is likely that CP uses another available host for the resource allocation. This can cause more delay in the VM startup. (3) Restoring the VM from the Stopped status results in billing for the AP. (4) If the VM in the Stopped status becomes unhealthy, this problem remains hidden from Amazon until the AP requests switching the VM status to InService. In this condition, Amazon starts an alternative VM for the AP that leads to the deletion of the data on it which would probably result in further delay in VM startup.
∑ j =1
(CloudletPEsj*CloudletLengthj ) PEs*MIPS
(3)
where CurrentCloudlets is the number of requests (tasks) being executed by the VM, CloudletPEs is the number of processors required for a request, and CloudletLength is the number of instructions of a running request. Moreover, PEs is the number of the VM's processing elements and MIPS (Million Instructions Per Second) is the processing power of each element. On the other hand, the mean response time in minute i is monitored and stored according to (4). Here, the response time means the latency in the response to user requests. Req answered
Mirt =
Therefore, the mechanism is faced with the issue of delayed startup after switching to Standby and Stopped statuses (Fig. 4). These problems encouraged us to propose a new status in the system: Quarantined. VMs in the Quarantined status are in operational conditions, but they are free from workload (Fig. 4). Since switching from InService to Quarantined status does not make the VM inaccessible for the AP, it would still be possible for the AP to continue to manage it.
∑ j =1
Req
Wj
answered
(4)
The total waiting time Wj of answered requests (Req answered ) in minute i is measured and then divided by the number of answered requests. The waiting time of each request is calculated according to (5).
WJ = (FinishTimej − ArrivalTimej ) − ServiceTimej
(5)
Here, ArrivalTimej and FinishTimej are the times the request is received from user i and the time the response is received by its VM, respectively. ServiceTimej is also the estimated service time required by the incoming user request which is calculated according to (6). If the time between ArrivalTimej and FinishTimej is larger than ServiceTimej , there has been latency in the response to the user request.
4.2. Problem formulation This section explains the notations used in our proposed approach (see Table 2). Rented VMs are divided into three categories: Requested VMs that have not been started (PL), In-service VMs (SL) and VMs switched to the Quarantined status by Suprex (QL). In addition, all VMs under the rental of the AP are in the AL list (list of all VMs) (see (1)).
AL = PL + SL + QL
∑ j =1 VMj Utilization
ServiceTime =
cloudletLength*cloudletPEs VM . getNumberOfPEs*Vm. getMIPS
(6)
In the monitoring phase, other parameters are determined for the measurement of performance criteria; such as T as the throughput which, according to (7), shows the ratio of answered requests (Reqianswered ) to received ones (Reqireceived ) during minute i.
(1)
The auto-scaling mechanism is regularly run every minute for the monitoring phase while it is run at specific time intervals (Δt) for analysis, planning, and execution phases (except for the updater component of the executor). In the monitoring phase, the scaling indicators of resource utilization (Miu ) and response time (Mirt ) are measured every minute (i). The mean resource utilization at time i is calculated based on (2).
T=
Reqianswered Reqireceived
(7)
Requests experiencing the response time (W) of more than the desired limit (DRT) are considered as SLA violations. According to (8), the sum of these seconds in hours (here ‘%’ is the modulus operator) is considered as the hours of SLA violation (SLAV hour ). 31
Journal of Network and Computer Applications 95 (2017) 26–41
M.S. Aslanpour et al.
Table 2 Summary of the notations used in this article.
totaluserRequests
SLAV hour = SumSLAViolation(inhour ) = (
∑
and the variable PT shows this period as one of the attributes of any VM. Finally, MinPT and MaxPT show the minimum and maximum elapsed times since the last hour of use among VMs, respectively.
Wj − DRT )%anHour
j =1
(8) In the analysis phase, the analyzer takes actions to analyze the scaling indicators (resource utilization and response time), the result of which is presented in the form of Aiu and Airt . Afterward, the planner makes the scaling decision (D) by matching the utilization analysis ( Aiu ) with the upper threshold (U up_thr ) and lower threshold (U low_thr ) as well as the analysis of response time ( Airt ) with the upper threshold (RT up_thr ) and lower threshold (RT low_thr ). The planner's decision is sent to the executor and could be ScaleUp, ScaleDown, or DoNothing. In the execution of the command, the executor is connected to a few variables including: MaxVM which is the maximum number of VMs allowed to be rented from the CP. MaxVM is used to avoid the imposition of heavy costs on the AP in conditions of confusion in the mechanism. The variable SU, according to the time recorded for the startup of a VM, shows whether or not it had been started before (Started VMs have the value of −1). SU is checked when restoring the VM from QL to SL. The α variable determines the surplus VM selection policy in the execution of scale-down decisions which can be FUFD, LUFD, load-aware, or cost-aware. Moreover, some of these policies may need the elapsed time from the last billing cycle in their selection,
4.3. Proposed algorithm Although the main focus of the proposed approach is the execution phase, in this section, we describe other algorithms required to fully implement the auto-scaling mechanism. All of the operations of the auto-scaling mechanism are controlled by Algorithm 1 (see Fig. 5), which manages the MAPE cycle. Algorithm 1 is responsible for controlling the chronological order upon calling each MAPE phase, each of which is implemented with an independent algorithm. Fig. 5 shows how these algorithms work with each other and the chronological order of their execution. Algorithm 1 shows an overview of the algorithm's operations in a way that it carries out monitoring (line 2) continuously (every minute) while performs analysis, g, and execution (lines 4–6) at specified intervals (Δt). Therefore, every time Clock % Δt = 0, it is the turn to perform analysis, planning, and execution. Similar to monitoring, the updating component of quarantined VMs is recalled every minute (line 8). This section provides a detailed explanation of the algorithm for every MAPE phase. 32
Journal of Network and Computer Applications 95 (2017) 26–41
M.S. Aslanpour et al.
4.3.2. Analysis phase With a Hybrid method (Coutinho et al., 2015) consisting of proactive and reactive methods, the analyzer analyzes the two scaling indicators of resource utilization ( Au ) and response time ( Art ), respectively (see Algorithm 3). Au analyzes utilization during the last minutes after the previous management period (from i – Δt to i) by calculating the weighted moving average (WMA) (lines 5– 12). The Fibonacci numbers technique (Vajda, 2007) is used in weighing the observations so that recent observations are given more weight compared to previous observations (line 7). The variables defined in line 3 are used for the purpose of WMA calculations. In addition, the analysis of Art is taken from the latest observation (line 14). These two analyses are sent to the planner so that it can plan the capacity control (line 15). Algorithm 3. The analysis phase of the MAPE cycle
1. 2. 3.
4. 5. 6.
10. 11. 12. 13. 14.
Weight ← fiboNumberA + fiboNumberB fiboNumberA ← fiboNumberB; fiboNumberB ← weight weightedMoving ← weightedMoving + (cpuUtilization × weight) totalWeight ← totalWeight + weight end for Au ← weightedMoving / totalWeight // Reactive section Art ← Mirt
15.
return Au and Art
7. 8. 9.
Fig. 5. Algorithms used to implement the proposed auto-scaling mechanism.
Algorithm 1. Auto-scaling mechanism (Main)
1. 2. 3. 4. 5. 6. 7. 8. 9.
repeat every 1 min (while there is an end user request) Monitoring (); // Stores history of metrics if Clock % Δt = 0 then Analysis (history of M u , history of M rt ); Planning ( Au , Art ); Execution (D); // Main component of Suprex end if Update Quarantined VMs // Suprex's Surplus VM updater component end repeat
4.3.3. Planning The planner makes decisions with a rule-based method and step sizes (Qu et al., 2016) equivalent to one. According to Algorithm 4, the obtained analysis compares the resource utilization ( Au ) and the response time ( Art ) with the thresholds defined for each. In the event of upper thresholds violation with both analyses (line 3), a ScaleUp decision is made (line 4), and if both violate the lower thresholds (line 5), a ScaleDown decision (line 6) is made; otherwise, DoNothing decision is made (line 8). In the end, the planner's decision is sent to the executor (line 10).
4.3.1. Monitoring phase According to Algorithm 2, the monitor continuously collects and stores information about low-level parameters (infrastructure level) and high-level parameters (application level) (Qu et al., 2016) during the last minute. Low-level parameters include utilization and the number of resources (line 2), and high-level parameters include categories related to the end user and the SLA, lines 4 and 5, respectively.
Algorithm 4. 3The planning phase of the MAPE cycle
Algorithm 2. The monitoring phase of the MAPE cycle
1. 2. 3.
/* Low Level Parameters */ Store Miu , PL, SL, QL, AL // VM parameters /* High Level Parameters */
4.
Store Reqireceived // End users parameters
5.
Store Mirt , Reqianswered , T, // SLA parameters
Input: M u (during the past Δt minutes), M rt for the last minute Output: Au and Art Variable: double cpuUtilization ←0, weight ←0, weightedMoving ←0, totalWeight ←0, fiboNumberA ←0, fiboNumberB ←1 // Proactive section for j ←0 to j < Δt do cpuUtilization ← Miu− j −∆ t
1. 2.
Input: Au , Art , U low_thr , U up_thr , RT low_thr , RT up_thr Output: D
3. 4.
if Au > U up_thr and Art > RT up_thr then D = ScaleUp
5. else if Au < U low_thr and Art < RT low_thr then 6. D = ScaleDown 7. else 8. D = DoNothing 9. end if 10. return D
33
Journal of Network and Computer Applications 95 (2017) 26–41
M.S. Aslanpour et al.
4.3.4. Execution The methods of the proposed executor can be seen in Fig. 6. Suprex is comprised of two components: the main component and the quarantined VM updater component. The main component takes the following actions:
•
•
Scale-up: In the event of scale-up decision (1), the restoration technique for quarantined VMs is sought. If there is a quarantined VM (2), the VM with the most remaining number of minutes to the completion of the last hour of use is selected (3). In the case of multiple VMs with equal conditions (VM.getPT = MinPT), the one in the operational status is restored (in order to avoid restoring the VM quarantined before startup). Afterward, the VM status is switched
from quarantine and is moved to the list of operational VMs (SL or PL) (4). On the other hand, if there is no quarantined VM (5) and not faced with resource provisioning restrictions (6) the CP takes measures to request a new VM (7). Scale-down: In the case of the scale-down decision (8), if there is a candidate VM (PL + SL > 0) (9) then according to policy α, the surplusVMselector selects a surplus VM (10) and moves it to quarantined mode (11).
The updater component of quarantined VMs (Fig. 6) checks every minute to see if the deadline for the release (VM.getPT = 60 min) of a VM is reached so that it can be released (12). At this time, if there are Cloudlets running in the VM, the updater cancels them and sends them
Fig. 6. The proposed executor (Suprex), the main component for the execution of the scaling commands, and the updater component updating quarantined VMs.
34
Journal of Network and Computer Applications 95 (2017) 26–41
M.S. Aslanpour et al.
10.
to the load balancer again for redistribution, as opposed to the work of Beltrán (Beltrán, 2015) in which the canceled task is left without a response (see Fig. 6) In the rest of this section, we introduce cost-aware and load-aware policies (α) for the selection of the surplus VM by surplusVMselector.
•
11. 12. 13.
Cost-Aware surplus VM selection policy This policy (Algorithm 5) calculates the elapsed time of the last billing hour (PT) (lines 5–7) for each VM. The VM has the highest selection priority (lines 8–10) if it is exactly at the end of the last hour (for example exactly 3 h). Afterward, the VM with the greatest PT compared to other studied VMs (i.e., the VM with the greatest utilization of the last hour of its life cycle) is selected as the surplus VM (lines 11–14).
14. 15. 16. 17. 18. 19. 20. 21. 22.
Algorithm 5. Cost-Aware policy in the selection of surplus VM
1. 2. 3. 4. 5. 6. 7. 8. 9. 10. 11. 12. 13. 14. 15. 16.
•
Input: On-Demand Vm List (PL + SL ) Output: surplusVM Parameters: maxPT ←MIN_VALUE, availableTime for vm in on-Demand VmLis do PT ← null; availableTime ← Clock - VM.getRequestTime(); PT ← availabletime % anHour; // % = modulus operation if PT = 0 then PT ← anHour; end if if PT > maxPT then maxPT ← PT; surplusVm ←vm; end if end for return surplusVm;
ranTime ←Clock cloudlet.getFirstSubmissionTime(); remainedServiceTime ←length - (ranTime × (vm.getMips()× vm.getNumberOfPes()); if vm.getNumberOfPes() > cloudlet.getNumberOfPes() then remainedServiceTime ←length - (ranTime × (vm.getMips()× cloudlet.getNumberOfPes())); end if vmRemainedLoad ← vmRemainedLoad + remainedServiceTime; end for if vmRemainedLoad < minLoad then minLoad ←vmRemainedLoad; surplusVm ←vm; end if end for return surplusVm;
5. Performance evaluation This section explains experiments conducted to evaluate the performance of Suprex in CloudSim Simulator (Buyya et al., 2009). The experiment scenario is as follows: the AP rents a limited number of VMs from the CP for hosting a Web application. Afterward, the users start sending their requests to the application. Meanwhile, the scaling mechanism automatically prevents resource under-provisioning and over-provisioning by employing on-demand VMs. The purpose of the mechanism is cost saving and maintaining end user satisfaction. In each experiment, one of the following executors is used: Default (common in research (Aslanpour and Dashti, 2016, 2017)), Professional (improved), and Suprex (proposed). Other parameters (parameters related to monitoring, analysis and planning phases) stay fixed so that the performance of the executors is evaluated fairly.
Load-aware surplus VM selection policy The load-aware policy is responsible for considering the VM load at the time of selection. According to Algorithm 6, for every VM, the remaining service time of the load in the VM is estimated through an inquiry from its scheduler (entitled vmRemainedLoad) (lines 5–16). The remaining service time of any VM is calculated from the total remaining service time of its cloudlets. The remaining service time of any cloudlet is also estimated by deducting the amount processing already performed from its total service time (lines 8–11). Since in our desired system processing a cloudlet with an X-core processing requirement on a VM with a X+1-core processing requirement would not speed up the process, this issue has also been taken into consideration (lines 12–14). Finally, if the VM has a lower load compared to other studied VMs, it is selected as surplus VM (lines 17–20).
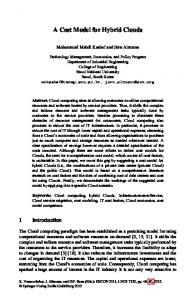
5.1. Experiment setup Each experiment is comprised of end user, AP, and CP, the detail of which shall be presented in the following subsections (see Fig. 2). 5.1.1. End user entity We used NASA workload (Arlitt and Williamson, 1997) as the emulator of Web users requests to the AP (see Fig. 7). The NASA workload is very common for the performance evaluation of web application auto-scaling (Li et al., 2015; Liu et al., 2015; Messias et al., 2016; Feng and Buyya, 2016; Kumar and Singh, 2016). This workload represents realistic load variations over time that makes the
Algorithm 6. Load-Aware policy in the selection of surplus VM
1. 2. 3.
4. 5. 6. 7. 8. 9.
Input: On-Demand Vm List (PL + SL ) Output: surplusVm Parameters: minLoad ←MAX_VALUE, vmRemainedLoad, length, ranTime, remainedServiceTime cloudletList ←new ArrayList < Cloudlet > () for vm in onDemandVmList do vmRemainedLoad ←0; cloudletList ←vm.getScheduler().getCloudletList(); for cloudlet in cloudletList do remainedServiceTime ← 0 length ←cloudlet.getLength()× cloudlet.getNumberOfPes();
Fig. 7. User requests to NASA Kennedy Space Center WWW server in Florida on July 6th, 1995.
35
Journal of Network and Computer Applications 95 (2017) 26–41
M.S. Aslanpour et al.
Value NASA traces
of scale-up and scale-down operations (Qu et al., 2016) can also be added to this equation which are omitted here for the sake of brevity. We also consider the delay for releasing a VM to be zero since it is negligible (de Assunção et al., 2016; Mao et al., 2012).
U low_thr = 20% and U up_thr = 80%
VM Delay = BASE + VMConfig + TimeOfTheDay
RT low_thr = 200ms and RT up_thr = 1000ms Δt = 10 min DRT = 1000ms = 1 s Round-Robin t2.medium and t2. Large (More information about the configuration in Aslanpour and Dashti (2016) maxVM = 10 VM
5.1.3. CP entity The CP entity potentially exists in CloudSim, but features need to be added to VM class for cost management and issuance of resource rental bills. Task scheduling and resource scheduling were both time-shared (similar to (Aslanpour and Dashti, 2016, 2017)).
Table 3 Values determined for experiment parameters. Parameter Workload Resource Utilization Thresholds Response Time Thresholds Scaling Interval Desired Response Time Load Balancing Policy Configuration of VMs Maximum On-demand VM Limitation Task and Resources Scheduling policy
Time-Shared
(9)
5.2. Performance criteria Evaluation criteria are presented in eight categories which are as follows: 1. The cost of renting on-demand machines as the most important criteria. According to CPs’ policy (Moldovan et al., 2016), the cost is calculated by rounding up the rented hours of all VMs. Lines 5–7 of Algorithm 5 show how this calculation is performed. 2. Response time: Based on studies (Aslanpour and Dashti, 2016), the desired Web application response time of 1 s was agreed upon (DRT = 1 s). This is obtained by calculating the average of all observed M rt . It is desirable to see that the mechanism's performance fulfils this agreement. The standard deviation (SD) of response time is also measured; the lower SD shows timely decisions and prevention of serious delays in responses. 3. The rate of SLA violation: the total length of time (in hours) of delayed response to user request, which is calculated according to (8). 4. Resource utilization: Mean percentage of the utilization of resources used obtained by calculating the average of all M u . The SD of resource utilization is also measured; the lower SD indicates that the VMs are not surprised by the load (Aslanpour and Dashti, 2016). 5. Oscillation mitigation or mechanism overload control which is evaluated by measuring the number of VMs provisioned and de-provisioned by the executor. Fewer decisions are indicative of higher accuracy. 6. Time to adaptation: If the planner discovers disturbance of desirable conditions for resource utilization and response time, it recognizes the application as maladapted. In this situation, the executor considered more efficient if it makes the scale-up decision in a way that the time for the re-establishment of application adaptability is minimized; in other words, the one which establishes desirable conditions for resource utilization and response time. Therefore, this metric shows how long it takes on average (in seconds) to re-establish adaptability after each scale-up decision in the mechanisms. 7. VM Minutes: The average length of time VMs are rented by the AP, i.e., the period of time from demand to release of a VM. The higher amount of this criterion is indicative of the stability in resource provisioning (Beltrán, 2015). 8. Contradictory Scaling Actions (CSA): Provision and release of a VM in a short period of time (for example, in two consecutive scaling intervals), or vice versa, which results in increased cost and SLA violation (Qu et al., 2016). Efficient executors must be able to avoid CSA.
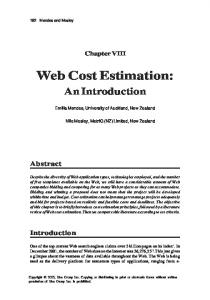
results and conclusions more realistic and reliable to be used in real environments. The workload comprises 100960 user requests sent to NASA Web servers during a day. Extreme fluctuations in this workload can trigger a realistic experiment for the scaling mechanism. Research shows that the pattern of user request arrivals to many Websites complies with the similar pattern of this workload. In other words, the majority of websites experience reduced incoming load during early hours of the day, increased incoming load with the start of office hours, significant fluctuations at the end of office hours, and a decreasing pattern during the closing hours of the night (Wang et al., 2005, 2015). 5.1.2. AP entity In this system, the AP hosts the application by renting two reserved machines with the size of t2.large. Then, with the help of the autoscaling mechanism, on-demand VMs with the size of t2.medium are used to control incoming load fluctuations (more details on VM configuration in Aslanpour and Dashti (2016)). A number of parameters can be seen in Table 3. Note that the delayed startup of on-demand VMs is a fundamental issue in research based on cloud simulation environment. In simulations, some researchers determine this delay as a fixed number (Aslanpour and Dashti, 2016, 2017; Antonescu and Braun, 2015) or even better as normal distribution (de Assunção et al., 2016). Nonetheless, an interesting study by Mao and Humphrey (Mao et al., 2012) has shown that this delay depends on factors such as VM size, VM request time (time of day), etc. In Eq. (9), we study this issue with more details. In Eq. (9) where BASE is a fixed minimum amount (equivalent to 5 min) which is added to the total of delay dependent on VMSIZE and TimeOfTheDay in accordance with Fig. 8 to calculate the delay in VM startup. According to Fig. 8, the larger the VM size, the longer the startup delay is. The VM startup is also affected by the time of the day the VM is requested as the rise in the number of VM requests by CP clients in working hours will increase the delay. It should be noted other factors such as servers’ geographical location and step sizes
5.3. Experimental results According to Table 4, there are three scenarios for experiments; the parameters of the three phases of monitoring, analysis, and planning are fixed in all three experiments but different executors are used in the scaling mechanism. The experiments were carried out as follows: The
Fig. 8. The effect of VM size and time of VM request on the delay in VM startup.
36
Journal of Network and Computer Applications 95 (2017) 26–41
M.S. Aslanpour et al.
Table 4 The scenario of discussed experiments. Scenario
Auto-scaling parameters (based on MAPE loop phases) Monitoring
Scenario 1 Scenario 2 Scenario 3
Algorithm 2 Algorithm 2 Algorithm 2
Analysis
Hybrid (Algorithm 3) Hybrid (Algorithm 3) Hybrid (Algorithm 3)
Planning
Rule-based (Algorithm 4) Rule-based (Algorithm 4) Rule-based (Algorithm 4)
Execution Type
Feature
Default Professional Suprex (Proposed)
LUFD and FUFD surplus VM selection Cost-Aware and Load-Aware surplus VM selection Cost-Aware and Load-Aware surplus VM selection + VM Quarantining
first experiment used the Default executor for the execution of scaling decisions. This executor makes decisions by adapting unaware LUFD (Aslanpour and Dashti, 2016) or FUFD (Aslanpour and Dashti, 2017) policies in the selection of the surplus VM for the execution of scaledown decisions. A Professional executor was used in the second experiment to observe the effectiveness of aware selection of the surplus VM in scaling decisions; the Professional one utilizes two heuristic cost-aware and load-aware policies. The proposed executor Suprex was used in the third experiment. In this experiment, instead of immediately releasing the selected surplus VM, the executor sends it to quarantined status to be restored if the need arises. First we conducted a preliminary study to check if the proposed mechanism yields a desirable overall performance. There are two signs in preliminary results that determined the performance of the mechanism was desirable; (1) the study of the mechanism's throughput indicated that despite severe incoming load fluctuations, the throughput was effectively close to 100% (mean of 100%) (Fig. 9); (2) the comparison between the pattern of incoming user requests and the pattern of VMs provisioned by the mechanism shows that the mechanism carries out VM provisioning appropriately (Fig. 10).
From now on, the number of VMs is the total number of reserved and on-demand VMs unless otherwise mentioned. The results obtained from the evaluation of the three executors are as follows. The most important criterion for verifying the effectiveness of executors is their influence on cost. Fig. 11 illustrates that after adding each feature to the executor, there was a considerable cost saving. In addition, Fig. 12 shows that although Default and Professional executors were able to maintain the response time at the desired level, according to the SLA (DRT < 1 s), Suprex managed to improve this criterion. Response time SD in this experiment reached 1.69 using the Suprex executor, while this figure was 1.96 in other experiments. Improvement in the response time SD by the Suprex executor is indicative of timely decisions and prevention of serious delays in responses. Also, as a result of improved response time, SLA violation decreased by 5% (Fig. 13). On the other hand, the percentage of resource utilization decreased in the mechanism equipped with Suprex executor (Fig. 14). The reason is that with the possibility of restoring quarantined VMs without any delay requests are not accumulated on resources and this technique results in lower utilization in some situations. The other reason for decreased utilization is the fact
Fig. 11. Comparison between the costs of renting VMs after using each of the executors in the mechanism. Fig. 9. Throughput in the mechanism equipped with the Default executor.
Fig. 10. The appropriateness of the pattern of the incoming load and provisioned VMs in the mechanism equipped with the Default executor.
Fig. 12. Comparison between the mean response times after using each of the executors in the mechanism.
37
Journal of Network and Computer Applications 95 (2017) 26–41
M.S. Aslanpour et al.
Fig. 16. Comparison of time to adaptation after using each of the executors in the mechanism.
Fig. 13. Comparison between the rates of SLA violation after using each of the executors in the mechanism.
scaling decisions, application adaptation is delayed by the startup of a new VM and its effect in the processing of user requests. In overall, the Professional executor is only efficient in cost saving but Suprex in addition to cost shows more efficiency in meeting SLA. The reason behind this performance improvement by Suprex is its aware selection techniques and quarantining surplus VMs. 6. Discussion With a closer look, this section studies how the two features of aware selection and quarantining surplus VMs influence the proposed Suprex executor. The results show that by adding a cost-aware selection of surplus VMs, the Professional executor managed to decrease the imposed cost relative to the Default executor ($5.76 to $5.52). Note that whenever the figure witnessed a fall, a scaling down decision is made and a VM is released. According to Fig. 17, the number and time of these decisions were similar in the experiments. A total of 17 decisions are taken but in only 8 of them, both executors make the same selection (s = same). The reason why selections from the beginning of the simulation until 7 A.M. are similar is that in the selection of surplus on-demand VMs, the executors are only faced with one release option. Moreover, in the same period, they fail to take actions for scale-down decisions twice (no-ac = no action) because there are no on-demand VMs at that time. However, in 6 of the 7 remaining selections, the Professional executor selects the VM with longer elapsed minutes compared to the Default executor (longer MaxPT) equipped with the cost-aware surplus VM selection policy. In two cases of selection by the Professional executor, the surplus VM with exactly X hours of use is selected; this choice prevented the mechanism from the addition of another hour to the billing of the VM. These savings in the time of surplus VM selection result in the reduction of total cost imposed by the Professional executor for renting resources compared to the Default executor. In regards to the technique for quarantining and restoring surplus VMs, the results in Fig. 11 show that the Suprex executor is more effective than the Professional executor in cost reduction (reduction from 5.52 to 5.36). This happens since after the selection of the surplus VM, the Professional executor immediately releases it (see Fig. 18) while after the selection of a surplus VM, Suprex moves the VM to the quarantined status. Yellow circles in Fig. 18 show when Suprex has done so. The green lines connected to the circles show how long the VM remained in quarantined status. Black triangles show the times that the mechanism restored quarantined VMs (5 times) in the execution of scale-up decisions, as a result of which the request of a new VM was avoided. Interestingly, the Suprex executor reduces the cost compared to the Professional executor while a greater number of VMs are rented by the AP. This fact as well as avoidance of provisioning new VMs confirms the mechanism's stability. Although quarantined VMs are not available to the load balancer, the AP do not have to wait for VM
Fig. 14. Comparison between the percentages of resource utilization after using each of the executors in the mechanism.
that quarantined VMs that do not receive any load is included in the calculation of utilization. The SD of resource utilization improved by applying Suprex executor to the mechanism. Improvement in the SD of utilization by applying Suprex reveals that VMs are less often surprised by the incoming load when Suprex is exploited. The comparison between the amount of oscillation mitigation (or scaling overload control) shows the system's stability after applying Suprex (Fig. 15). The reason is that Suprex's rate of provisioning and releasing VMs was 24% less than the Default executor. Finally, the time to adaptation metric for the mechanism taking advantage of the Suprex executor is almost half of the rest (Fig. 16). The reason for Suprex's faster application adaptation is that this executor overcomes the challenge of delayed startup of a new VM. Default and Professional executors increase adaptation time since in their method for the execution of
Fig. 15. Comparison between the oscillation mitigation of the mechanism (or overload control) after using each of the executors in the mechanism.
38
Journal of Network and Computer Applications 95 (2017) 26–41
M.S. Aslanpour et al.
Fig. 17. Comparison between the performance of Default and Professional executors in the selection of the surplus VM, s = same, no-ac = no action, def = default, pro = professional. For example, pro = 40 means the professional executor selected a VM with the 40-min use of the last hour.
Fig. 18. Comparison between the performance of Professional and Suprex executors in the execution of scale-down and scale-up decisions. (For interpretation of the references to color in this figure, the reader is referred to the web version of this article.)
as a result of similar reaction to the planner's decisions. In the mechanism taking advantage of these two executors, the longest duration the number of VMs remained constant was 100 min; between hours 08:50 to 10:30, while the same duration was 140 min for the Suprex executor. In addition, Suprex had 120-min (twice) and 110-min stability. This shows a better performance compared to the Default and Professional executors (see Fig. 19). More importantly, Suprex makes the mechanism more stable exactly when the incoming load has the
startup, and user requests are responded quickly given the possibility of restoring them in scale-up decisions. Figs. 17 and 18 show that the proposed techniques in the selection of surplus VMs and quarantining them results in more stable VM provisioning. Fig. 19 compares the performance of the mechanism regarding the VM Minutes metric as an indicator of stability for each of the three executors. According to Fig. 19, pattern of changes in the number of VMs for both Default and Professional executors is similar
Fig. 19. Comparison between the performance of executors regarding the VM Minutes criteria.
39
Journal of Network and Computer Applications 95 (2017) 26–41
M.S. Aslanpour et al.
Fig. 20. Comparison between the performance of executors in the face of contradictory scaling decisions by the planner.
highest fluctuations while the Default and Professional executors fail to do so due to their inability in controlling contradictory scaling decisions (CSD) of the planner; for example, the period between 13:50 to 15:50 when a peak happens in the incoming load. On average, the VM Minutes metric for Default and Professional executors was 204 while this figure was 287 min for the Suprex executor which shows that Suprex's is 40% more effective in keeping the mechanism stable. Study of the VM Minutes metrics also showed that one of the main reasons for the poor stability is failure in controlling the CSD of the planner (this is when scale-down decision and immediate scale-up decision happen consecutively). Fig. 20 shows the CSD of the planner and the performance of executors in this situation. During each experiment, the planner made 4 contradictory scaling decisions. As shown in Fig. 20, both Default and Professional executors had 4 CSAs where a VM (↓) is released and immediately a new one (↑) is provisioned upon the next scaling interval. These contradictory actions never reported when the Suprex executor is exploited; because instead of provisioning a new VM, Suprex covers the scale-up command by restoring a quarantined VM. As a result, excessive costs and violation of the SLA is prevented. It is worth mentioning that all these improvements are attained only by applying a different executor in the mechanism, not a completely different scaling mechanism. The fundamental differences between these two techniques are the aware selection and quarantining the surplus VMs. We conclude that the techniques presented in this research can significantly improve the effectiveness of the auto-scaling mechanisms.
work can be the investigation of using resources from multiple cloud environments in the auto-scaling mechanism. References Amazon, 2015. 12, 12). Amazon Auto Scaling. Available: 〈https://aws.amazon.com/ autoscaling/〉. Amiri, M., Mohammad-Khanli, L., 2017. Survey on prediction models of applications for resources provisioning in cloud. J. Netw. Comput. Appl.. Andrikopoulos, V., Binz, T., Leymann, F., Strauch, S., 2013. How to adapt applications for the Cloud environment. Computing 95, 493–535. Antonescu, A.-F., Braun, T., 2015. Simulation of SLA-based VM-scaling algorithms for cloud-distributed applications. Future Gener. Comput. Syst.. Arlitt, M.F., Williamson, C.L., 1997. Internet web servers: workload characterization and performance implications. IEEE/ACM Transactions on Networking (ToN), vol. 5, pp. 631–645. Aslanpour, M.S., Dashti, S.E., 2016. SLA-aware resource allocation for application service providers in the cloud. In: 2016 s International Conference on Web Research (ICWR), pp. 31–42. Aslanpour, M.S., Dashti, S.E., 2017. Proactive Auto-Scaling Algorithm (PASA) for cloud application. Int. J. Grid High. Perform. Comput. 9, 1–16. de Assunção, M.D., Cardonha, C.H., Netto, M.A., Cunha, R.L., 2016. Impact of user patience on auto-scaling resource capacity for cloud services. Future Gener. Comput. Syst. 55, 41–50. Baker, T., Mackay, M., Randles, M., Taleb-Bendiab, A., 2013. Intention-oriented programming support for runtime adaptive autonomic cloud-based applications. Comput. Electr. Eng. 39, 2400–2412. Bankole, A.A., 2013. Cloud client prediction models using machine learning techniques. In: Computer Software and Applications Conference (COMPSAC), 2013 IEEE 37th Annual, pp. 134–142. Bankole, A.A., Ajila, S.A., 2013. Cloud client prediction models for cloud resource provisioning in a multitier web application environment. In: 2013 IEEE 7th International Symposium on Service Oriented System Engineering (SOSE), pp. 156-161. Bankole, A.A., Ajila, S.A., 2013. Cloud client prediction models for cloud resource provisioning in a multitier web application environment. In: Service Oriented System Engineering (SOSE), 2013 IEEE Proceedings of the 7th International Symposium on, pp. 156–161. Beltrán, M., 2015. Automatic provisioning of multi-tier applications in cloud computing environments. J. Supercomput. 71, 2221–2250. Buyya, R., Ranjan, R., Calheiros, R.N., 2009. Modeling and simulation of scalable Cloud computing environments and the CloudSim toolkit: Challenges and opportunities. In: High Performance Computing & Simulation, 2009. HPCS'09. International Conference on, pp. 1–11. Casalicchio, E., Silvestri, L., 2013. Mechanisms for SLA provisioning in cloud-based service providers. Comput. Netw. 57, 795–810. Cavalcante, E., Batista, T., Lopes, F., Almeida, A., de Moura, A.L., Rodriguez, N., 2013. , et al., Autonomous adaptation of cloud applications. In: IFIP International Conference on Distributed Applications and Interoperable Systems, pp. 175–180. Computing, A., 2006. An architectural blueprint for autonomic computing. IBM White Pap. 31. Coutinho, E.F., de Carvalho, F.R. Sousa, Rego, P.A.L., Gomes, D.G., de Souza, J.N., 2015. Elasticity in cloud computing: a survey. Annals of Telecommunications-Annales Des Télécommunications, vol. 70, pp. 289–309. Dhingra, M., 2014. Elasticity in IaaS Cloud, preserving performance SLAs (Master’s thesis), Indian Institute of Science. EC2. Elastic Compute Cloud. Available: 〈http://aws.amazon.com/ec2/〉. Fallah, M., Arani, M.G., Maeen, M., 2015. NASLA: novel auto scaling approach based on learning automata for web application in cloud computing environment. Int. J. Comput. Appl. 117, 18–23. Feng, G., Buyya, R., 2016. Maximum revenue-oriented resource allocation in cloud. Int. J. Grid Util. Comput. 7, 12–21.
7. Conclusion In this paper, we proposed Suprex, an executor for the cost-aware auto-scaling mechanism. Suprex benefits from two heuristic features: (1) aware selection of surplus VMs during the execution of scale-down commands and (2) quarantining and immediate restore of surplus VMs (as opposed to immediate release). Simulation results show that Suprex can achieve a 7% reduction in resource rental costs for the AP while improving response time by up to 5% and decreasing SLA violation and the mechanism's oscillation overload by 5% and 24%, respectively. Suprex overcomes the challenge of delayed startup for new VMs without the help of cool-down time or vertical scaling. Finally, with respect to the close relationship between Suprex features and the payper-use rental model, APs can take advantage of Suprex in their autoscaling mechanisms. For future work, we plan to explore the impact of making quarantined VMs accessible by the load balancer to redirect load to them and evaluate Suprex's performance against an executor with the feature of vertical scaling. We also will investigate utilization of Spot instances offered by CPs such as Amazon to save cost. Another future 40
Journal of Network and Computer Applications 95 (2017) 26–41
M.S. Aslanpour et al.
Singh, S., Chana, I., 2015. Q-aware: quality of service based cloud resource provisioning. Comput. Electr. Eng. 47, 138–160. Singh, S., Chana, I., 2016. Resource provisioning and scheduling in clouds: qos perspective. J. Supercomput. 72, 926–960. STEBLIUK, D., 2016. Fine grained adaptation of Cloud applications with containers. Toosi, A.N., Qu, C., de Assunção, M.D., Buyya, R., 2017. Renewable-aware geographical load balancing of web applications for sustainable data centers. J. Netw. Comput. Appl.. Vajda, S., 2007. Fibonacci and Lucas numbers, and the golden section: theory and applications: Courier Corporation. Wang, H., Xu, F., Li, Y., Zhang, P., Jin, D., 2015. Understanding mobile traffic patterns of large scale cellular towers in urban environment. In: Proceedings of the 2015 ACM Conference on Internet Measurement Conference, pp. 225–238. Wang, X., Abraham, A., Smith, K.A., 2005. Intelligent web traffic mining and analysis. J. Netw. Comput. Appl. 28, 147–165. Weingärtner, R., Bräscher, G.B., Westphall, C.B., 2015. Cloud resource management: a survey on forecasting and profiling models. J. Netw. Comput. Appl. 47, 99–106.
García, A.G., Espert, I.B., García, V.H., 2014. SLA-driven dynamic cloud resource management. Future Gener. Comput. Syst. 31, 1–11. Ghobaei-Arani, M., Shamsi, M., 2015. An Extended approach for efficient data storage in cloud computing environment. Int. J. Comput. Netw. Inf. Secur. 7, 30. Ghobaei-Arani, M., Jabbehdari, S., Pourmina, M.A., 2016. An autonomic approach for resource provisioning of cloud services. Clust. Comput., 1–20. Ghobaei-Arani, M., Shamsi, M., Rahmanian, A.A., 2017a. An efficient approach for improving virtual machine placement in cloud computing environment. J. Exp. Theor. Artif. Intell., 1–23. Ghobaei-Arani, M., Jabbehdari, S., Pourmina, M.A., 2017b. An autonomic resource provisioning approach for service-based cloud applications: a hybrid approach. Future Gener. Comput. Syst.. Gholami, A., Arani, M.G., 2015. A trust model based on quality of service in cloud computing environment. Int. J. Database Theory Appl. 8, 161–170. Herbst, N.R., Huber, N., Kounev, S., Amrehn, E., 2014. Self‐adaptive workload classification and forecasting for proactive resource provisioning. Concurr. Comput.: Pract. Exp. 26, 2053–2078. Huang, J., Li, C., Yu, J., 2012. Resource prediction based on double exponential smoothing in cloud computing. In: Consumer Electronics, Communications and Networks (CECNet), 2012 2nd International Conference on, pp. 2056–2060. Huebscher, M.C., McCann, J.A., 2008. A survey of autonomic computing—degrees, models, and applications. ACM Comput. Surv. (CSUR) 40, 7. Islam, S., Keung, J., Lee, K., Liu, A., 2012. Empirical prediction models for adaptive resource provisioning in the cloud. Future Gener. Comput. Syst. 28, 155–162. Kaur, P.D., Chana, I., 2014. A resource elasticity framework for QoS-aware execution of cloud applications. Future Gener. Comput. Syst. 37, 14–25. Khan, R.Z., Ahmad, M.O., 2016. Load balancing challenges in cloud computing: a survey. In: Proceedings of the International Conference on Signal, Networks, Computing, and Systems, pp. 25–32. Kumar, J., Singh, A.K., 2016. Dynamic resource scaling in cloud using neural network and black hole algorithm. In: Eco-friendly Computing and Communication Systems (ICECCS), 2016 Proceedings of the Fifth International Conference on, pp. 63–67. Li, J., Su, S., Cheng, X., Song, M., Ma, L., Wang, J., 2015. Cost-efficient coordinated scheduling for leasing cloud resources on hybrid workloads. Parallel Comput. 44, 1–17. Liu, J., Zhang, Y., Zhou, Y., Zhang, D., Liu, H., 2015. Aggressive resource provisioning for ensuring QoS in virtualized environments. IEEE Trans. Cloud Comput. 3, 119–131. Lorido-Botran, T., Miguel-Alonso, J., Lozano, J.A., 2014. A review of auto-scaling techniques for elastic applications in cloud environments. J. Grid Comput. 12, 559–592. Mao, M., Humphrey, M., 2012. A performance study on the vm startup time in the cloud. In: Cloud Computing (CLOUD) IEEE 5th International Conference on, pp. 423–430. Messias, V.R., Estrella, J.C., Ehlers, R., Santana, M.J., Santana, R.C., Reiff-Marganiec, S., 2016. Combining time series prediction models using genetic algorithm to autoscaling Web applications hosted in the cloud infrastructure. Neural Comput. Appl. 27, 2383–2406. Mohamed, M., Amziani, M., Belaïd, D., Tata, S., Melliti, T., 2014. An autonomic approach to manage elasticity of business processes in the cloud. Future Gener. Comput. Syst.. Moldovan, D., Truong, H.L., Dustdar, S., 2016. Cost-Aware Scalability of Applications in Public Clouds. In: 2016 IEEE International Conference on Cloud Engineering (IC2E), pp. 79–88. Moltó, G., Caballer, M., de Alfonso, C., 2016. Automatic memory-based vertical elasticity and oversubscription on cloud platforms. Future Gener. Comput. Syst. 56, 1–10. Panneerselvam, J., Liu, L., Antonopoulos, N., Bo, Y., 2014. Workload analysis for the scope of user demand prediction model evaluations in cloud environments. In: Utility and Cloud Computing (UCC), 2014 IEEE/ACM Proceedings of the 7th International Conference on, pp. 883–889. Qavami, H.R., Jamali, S., Akbari, M.K., Javadi, B., 2014. Dynamic Resource provisioning in cloud computing: a heuristic markovian approach. In: Cloud Computing, ed: Springer, pp. 102–111. Qu, C., Calheiros, R.N., Buyya, R., 2016. Auto-scaling Web Applications in Clouds: A Taxonomy and Survey. arXiv preprint arXiv:1609.09224. Rheddane, A.El, 2015. Elasticity in the Cloud. Université Grenoble Alpes. Shen, Y., Chen, H., Shen, L., Mei, C., Pu, X., 2014. Cost-optimized resource provision for cloud applications. In: High Performance Computing and Communications, 2014 IEEE Proceedings of the 6th International Symp on Cyberspace Safety and Security, 2014 IEEE 11th International Conference on Embedded Software and Syst (HPCC, CSS, ICESS), 2014 IEEE International Conference on, pp. 1060–1067.
Mohammad Sadegh Aslanpour received the BSc degree in Computer Engineering from Andisheh University, Jahrom, Iran, in 2012 and MSc degree from Azad University of Sirjan, Iran, in 2016. Since 2011, he has also been working in the IT Department of the municipality of Jahrom, Iran as Software Engineer. His current research interests include Cloud Computing (specifically resource management) and scalability of cloud applications. He investigated the use of Service Level Agreements and Artificial Intelligence in cloud environments for scaling distributed infrastructures. He is a member of the Open Community of Cloud Computing (OCCC) research group.
Mostafa Ghobaei-Arani received the B.Sc. degree in Software Engineering from Kashan University, Iran in 2009, and M.Sc degree from Azad University of Tehran, Iran in 2011, respectively. He was honored Ph.D. degree Software Engineering from Islamic Azad University, Science and Research Branch, Tehran, Iran in 2016. His current research interests are Distributed Systems, Cloud Computing, Pervasive Computing, Big Data, and IoT.
Adel Nadjaran Toosi is a Post-doctoral Research Fellow at the Cloud Computing and Distributed Systems (CLOUDS) Laboratory, School of Computing and Information Systems (CIS), the University of Melbourne, Australia. He received his BSc degree in 2003 and his MSc degree in 2006 both in Computer Science and Software Engineering from Ferdowsi University of Mashhad, Iran. He has done his PhD, supported by International Research Scholarship (MIRS) and Melbourne International Fee Remission Scholarship (MIFRS), at the CIS department of the University of Melbourne. Adel’s thesis was nominated for CORE John Makepeace Bennett Award for the Australasian Distinguished Doctoral Dissertation and John Melvin Memorial Scholarship for the Best PhD Thesis in Engineering. His current hindex is 14 based on the Google scholar Citations. His research interests include scheduling and resource provisioning mechanisms for distributed systems. Currently he is working on data-intensive application resource provisioning and scheduling in cloud environments. Please visit his homepage: http://adelnadjarantoosi.info
41


![Autoscaling Web Services on Amazon EC2 - People [PDF]](https://m.moam.info/img/260x300/autoscaling-web-services-on-amazon-ec2-people-pdf_6483423d098a9e5e078b458a.jpg)