Journal of Electronic Imaging 16(3), 033015 (Jul–Sep 2007)
Automated algorithm for the identification of artifacts in mottled and noisy images Onome Augustine Ugbeme Eli Saber Rochester Institute of Technology Department of Electrical Engineering Rochester, New York 14623 E-mail:
[email protected] Wencheng Wu Xerox Corporation 800 Phillips Road Webster, New York 14580 Kartheek Chandu Rochester Institute of Technology Department of Electrical Engineering Rochester, New York 14623
Abstract. We describe a method for automatically classifying image-quality defects on printed documents. The proposed approach accepts a scanned image where the defect has been localized a priori and performs several appropriate image processing steps to reveal the region of interest. A mask is then created from the exposed region to identify bright outliers. Morphological reconstruction techniques are then applied to emphasize relevant local attributes. The classification of the defects is accomplished via a customized tree classifier that utilizes size or shape attributes at corresponding nodes to yield appropriate binary decisions. Applications of this process include automated/assisted diagnosis and repair of printers/copiers in the field in a timely fashion. The proposed technique was tested on a database of 276 images of synthetic and real-life defects with 94.95% accuracy. © 2007 SPIE and IS&T. 关DOI: 10.1117/1.2761920兴
1 Introduction Image quality stands among one of the most important attributes of image acquisition and printing devices. In the past decade, we have seen a tremendous improvement in the quality of printed documents due to significant technological advances in non-impact printing. Present-day print engines are required to meet consistent and stable imagequality requirements as measured by various metrics and ultimately evaluated by customers. The current marketplace demands the best image quality at competitive costs with minimum downtime. Hence, the ability for print engine vendors to reliably achieve the highest levels of quality will ensure them a leadership role in the printing industry. Even though the quality of printed documents has imPaper 06126RR received Jul. 22, 2006; revised manuscript received Mar. 21, 2007; accepted for publication Apr. 21, 2007; published online Aug. 13, 2007. 1017-9909/2007/16共3兲/033015/11/$25.00 © 2007 SPIE and IS&T.
Journal of Electronic Imaging
proved significantly over the past decade, current print engines still produce a variety of image defects and artifacts. Figure 1 illustrates sample defects that often result from faults or degradations in the underlying image development and electrophotographic processes. These artifacts are manifested in a variety of ways and can occur in different locations on the printed document. Therefore, current print environments 共e.g., Print shops兲 utilize trained quality assurance personnel 共QAP兲 to visually inspect a subset of the output documents to “ensure” that customer hard copies are free of defects. Once a defect has been spotted, the QAP is required to render an initial classification 共i.e., deletion, spot, debris centered deletion 共DCD兲, etc.兲. This is usually done in a visual fashion and as such is prone to errors and subjective judgments. Based on the QAP’s assessment, the artifact’s signature is then utilized to search the diagnostic documents for potential corrective actions 共i.e., clean the charge devices, replace the developer, etc.兲. This is expensive, and time-consuming and occasionally results in false actions due to incorrect assessments. Hence, algorithms that are capable of identifying artifacts in an objective fashion in order to render appropriate actions by QAPs or less experienced operators are needed. One approach for tackling this problem is by utilizing Content-Based Information Retrieval 共CBIR兲 techniques. In an effort to subdue manual annotations of large image databases, research interests in this area have abounded since the early 1990s.1,2 CBIR employs visual properties of a query image—color, shape, texture, frequency, and regions of interest (ROI)—to traverse image databases according to user’s interests. This is achieved by utilizing highly descriptive multidimensional feature vectors that can be extracted from global or local positions within the image us-
033015-1
Jul–Sep 2007/Vol. 16(3)
Ugbeme et al.: Automated algorithm for the identification of artifacts…
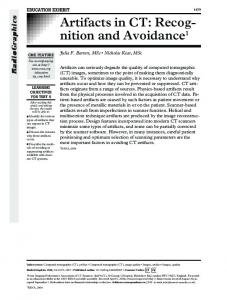
Fig. 1 A sample manifestation of defects of interest: 共a兲 and 共b兲 deletion; 共c兲 and 共d兲 debris centered deletion; 共e兲 and 共f兲 debrismissing DCD; 共g兲 and 共h兲 mottle.
ing one or more of the above visual content properties. Some applications require features that are minimally sensitive to changes—affine, reflections, perspective, deformations, or luminance3—in the image. For instance, shape features can be represented with moment invariants,4 Fourier descriptors,5 or chain-codes.6 Similarity measures between the feature vector of a query sample and archived features corresponding to database images are then computed using distance metrics such as Euclidean,6,7 Minkowski,8 Mahalanobis,9 and Kullback–Leibler 共KL兲 divergence.10 The decision of a “matched” image is achieved by searching through the similarity values. This can be performed using an exhaustive search or more efficiently via indexing schemes. Popular indexing schemes include R*-trees,11 quad-trees,12 or self-organizing maps 共SOMs兲.13,14 Thus, an automatic defect identification system can be devised to compare a defective sample with images in an already existing online database from which top matches can be selected. Additionally, the system can be designed to dynamically perform updates when new defects are encountered. Some systems counteract the defect recognition problem via a series of image processing and pattern classification steps. Iivarinen and Visa14 employed unsupervised SOMs for the classification of base paper surface defects such as Journal of Electronic Imaging
holes and spots. Their classification is based on features extracted from the internal structure, shape, and texture traits of the defective areas. Segmentation and morphological operations are among the preprocessing steps carried out prior to feature extraction and classification. Additionally, weld defect detection has been accomplished by Li and Liao15 via Gaussian distribution functions of horizontal line profiles from the defect images. They also employ background removal, dark image enhancement, and image normalization before properties of the profiles are exploited as features. Mery and Berti16 used textural features from co-occurrence matrices and two-dimensional Gabor functions. Prior to the feature extraction stage, they explore Laplacian of Gaussian edge detection to segment “key” defective areas. More recently, Ng17 proposed a novel histogrambased thresholding scheme to assist in the segmentation of “smallsized” sheet metal defects. In general, the algorithms described above are designed to handle defects that possess a high-level contrast to the surrounding background and are not well suited for recognition of artifacts in printed documents. In this paper, we propose a new classification algorithm for identifying artifacts resident on scanned copies of printed documents. The proposed algorithm utilizes primarily size-, shape-, and/or region-based features to effectively classify local artifacts. These artifacts tend to have large intraclass variations, possess low contrast, and/or exhibit illumination non-uniformities. The classes of interest 关see Figs. 1共a兲–1共h兲兴 include deletions, DCDs, debrismissing DCD, and mottle. Hence, our proposed technique employs appropriately designed image processing steps such as de-screening, gray-scale conversion, and local normalization to ensure uniformity among samples of the same class and to facilitate subsequent shape, size, and region feature analysis. The effectiveness of our algorithm is demonstrated on a large database of scanned electrophotographic and synthetic images. These images possess significant variations within each class that serve to thoroughly test the sensitivity of the method to intraclass differences. The advantages of our proposed algorithm lie in its ability to objectively classify a given artifact, once localized by a QAP or more importantly a less experienced operator in a practical print shop environment. To this effect, once a defect has been visually detected, the operator/QAP scans the region of interest and proceeds to classify/identify the defect using our proposed algorithm. Once identified, a set of correctives actions is subsequently followed to eliminate the culprit and place the device back into operation as quickly as possible, thereby minimizing downtime and maximizing profits. The remainder of this paper is organized as follows. Section 2 provides a brief description of the defects. Section 3 describes the proposed artifact analysis and classification algorithm. Experimental results are presented in Section 4, and conclusions are drawn in Section 5. 2 Overview of Image-Quality Defects Image defects are undesirable qualities of an electrophotographic copy produced by a printer or copier. Even though print engines have been thoroughly tested during the manufacturing process, the occurrences of defects remain inevitable due to the volume and diversity of printed material.
033015-2
Jul–Sep 2007/Vol. 16(3)
Ugbeme et al.: Automated algorithm for the identification of artifacts…
Among the most common are deletions, mottle, DCD, streaks, bands, and moiré patterns. Deletions 关Figs. 1共a兲 and 1共b兲兴 are usually manifested as elliptical regions containing a localized group of pixels lighter than the uniform background and are, in general, a result of an error in the charging process. DCDs 关Figs. 1共c兲 and 1共d兲兴, on the other hand, resemble a deletion with the added presence of a centralized collection of localized dark pixels 共called debris兲. A special case of DCDs exists, where the debris is missing due to accidental “rub off” by the electrophotographic process revealing the paper color 关see Figs. 1共e兲 and 1共f兲兴. This yields abnormally bright gray-level values compared to its immediate neighboring pixels. Mottle defects 关Figs. 1共g兲 and 1共h兲兴 refer to non-uniformity in the perceived print density 共i.e., reflectance兲 and can be gauged by the relationship between light and dark regions. The ISO-13660 standard18,19 defines mottle as non-uniformity occurring on a spatial scale between 1.27 mm and 12.7 mm. It characterizes it as large-area print-quality attributes possessing aperiodic fluctuations of density at a spatial frequency less than 0.4 cycles per millimeter in all directions. Even though mottle has received quite a bit of attention in the industry, a quantifiable universal measure has yet to be developed. The best achieved benchmark so far has been introduced in the ISO-19751 image-quality standards for systems.20,21 Other image defects 共e.g., streaks and bands兲 are certainly of significant interest but are not handled in this paper, since their shape properties differ greatly from the elliptical shapes identified by the proposed method. Proposed Artifact Analysis and Classification Algorithm Our proposed method is summarized in Fig. 2. It is composed of two major steps: image preprocessing for descreening and normalization, and ROI identification and classification. The input to the algorithm is a scanned color sample 共i.e., digital image兲 containing the defect. The flowchart, shown in Fig. 2, represents a classification approach based on the expected statistics of the ROI in the images. It depicts five leaf nodes and four decision nodes that are used to represent the classes and decisions, respectively. Each of the decision nodes employs size and/or shape features to classify the defect by utilizing empirically selected thresholds. These procedures are described in the following subsections, starting with the preprocessing steps.
presence of significant energy at high frequencies. This information is then utilized for scanner or copier recalibrations in order to produce a high-fidelity document with minimal screens. We adopt the same general frequency-domain descreening approach to minimize the effect of the screens on the classification process. In particular, we analyze the image power spectrum to determine the existence of pertinent high-frequency energy content that represents the signature of the underlying halftone screens. The peaks corresponding to the halftone structure are quite distinguishable in the Fourier domain. Hence, the effect of the screen is significantly reduced via a repetitive “notch” frequency-domain filtering operation to yield a sufficiently smooth image for further analysis. In every iteration, the high energy content in the frequency domain is located and filtered out. This process is performed individually on each channel for a predefined number of iterations using a Butterworth notch filter5 of order n = 15 given by Fnotch =
Journal of Electronic Imaging
D20 1+ D1共u, v兲D2共u, v兲
册
共1兲
n,
where • D0⫽radius of filter,
• D1共u , v兲 = 冑共u − M / 2 − u0兲2 + 共v − N / 2 − v0兲2,
• D2共u , v兲 = 冑共u − M / 2 + u0兲2 + 共v − N / 2 + v0兲2.
3
3.1 Image Preprocessing Locating ROIs involves applying a segmentation routine to separate the image into foreground and background segments. The foreground region consists of pixels that represent the defective areas. However, direct thresholding of the images without preprocessing generally leads to inaccurate ROI selections. Scanned images tend to contain halftone screens 共or marking screens兲 used to produce the image on the substrate during the electrophotographic, ink-jet, or lithographic marking process. Researchers have developed de-screening procedures to counteract this problem. Dunn and Mathew22 treated the halftone screens as textures capable of being extracted using a single circularly symmetric filter. Sharma23 developed a process responsible for determining the identity of the underlying marking process by analyzing the power spectra of a digital image for the
冋
1
The variables u and v are the frequency-domain coordinates. The origin of Fnotch has been shifted to the center frequency coordinates 关i.e., Fnotch共0 , 0兲 is located at u = M / 2 and v = N / 2兴. Thus, the notch locations are symmetrically located at 共u0 , v0兲 and 共−u0 , −v0兲. The radius of the notch filter is chosen, through empirical testing, as the minimum of 共M / 5 , N / 5兲. The order is selected as n = 15 in order to preserve the contrast of debris pixels in DCD and debris missing samples. An illustration of this application on a DCD image is shown in Fig. 3. Figure 3共a兲 shows a halftone scanned image that contains a DCD. The frequency spectrum 关Fig. 3共b兲兴 shows significant energy 共outlined by the boxes兲 at high frequencies that correspond to the halftone screens. The black spots 关Figs. 3共c兲–3共e兲兴 are indications of successive frequency-domain filtering operations. The final descreened image shown in Fig. 3共f兲 is thus obtained from the inverse Fourier transform of the filtered versions of all three channels. Special instances arise where the “debris” is only visible in one channel. Hence, multiple channel processing 共i.e., 3-channel processing of the image兲 is not desirable due to the added computational complexity and potential for inaccurate results. We therefore transform the image to a single gray-scale channel. There are numerous RGB to gray-scale methods used in the computer vision literature. Some simply employ the average of the RGB channels as a corresponding gray-scale image. A better approximation of the brightness can be derived by summing weighted versions of the R, G, and B channels.24 Other methods handle the problem via de-saturation,25 i.e., removal of the saturation infor-
033015-3
Jul–Sep 2007/Vol. 16(3)
Ugbeme et al.: Automated algorithm for the identification of artifacts…
Fig. 2 Defect detection and identification framework.
mation of the image. In particular, Matlab’s26 gray-scale conversion 共rgb2gray兲 computes a gray-scale image by summing weighted versions of the R, G, and B channels using the coefficients 0.2989, 0.5870, and 0.1140, respectively. For our data set, these conventional methods often fail to preserve the saliency of the centered debris. Rather, they tend to be successful when applied to normal images 共e.g., portraits, landscape scenes, road scenes, etc.兲 that have an appreciable contrast and exhibit a multimodal histogram property. To avoid this limitation, we perform a principal component 共PC兲 analysis on the RGB image in order to convert it to a single channel in an optimum fashion. Figure 4 illustrates the advantages of utilizing a PCJournal of Electronic Imaging
based conversion versus a weighted standard summation26 of channels. The DCD image 关Fig. 4共a兲兴 bears “questionable” debris, which is only visible in the blue channel 关Fig. 4共d兲兴, and is more appropriately “highlighted” in the first principal component 关see Fig. 4共f兲兴 as compared to a standard RGB-to-gray conversion 关see Fig. 4共e兲兴. Principal component analysis27 is a linear data reduction approach that optimally projects a d-dimensional data set onto a lower-dimensional subspace in a mean-squared error sense. It does this by performing a coordinate rotation that aligns the transformed axes with the directions of maximum variance of the data. Let ⌿1 , ⌿2, and ⌿3 represent the
033015-4
Jul–Sep 2007/Vol. 16(3)
Ugbeme et al.: Automated algorithm for the identification of artifacts…
Fig. 3 De-screening process: 共a兲 original scanned document; 共b兲 frequency spectrum of red channel showing presence of abnormally high energy at high frequencies; 共c兲–共e兲 successive notch filtering; 共f兲 de-screened version of Fig. 3共a兲.
R, G, and B channels in lexicographic ordering and ⌿ = 关⌿1 ⌿2 ⌿3兴T be the corresponding 3 ⫻ MN concatenation. The mean vector m = 关m1 m2 m3兴T and covariance matrix C are computed as follows: MN
2 ⌿ k
1 = E关共⌿k − mk兲 兴 = 兺 共⌿k共l兲 − mk兲2 , MN − 1 l=1 2
冤
2 ⌿ 1
C = ⌿2 ⌿1
⌿1 ⌿2 ⌿1 ⌿3 2 ⌿ 2
2 ⌿3
冥
共3兲
where MN
2 = E关共⌿k − mk兲2兴 = 1 / MN − 1 兺 共⌿k共l兲 − mk兲2, and • ⌿ k
l=1
•
⌿ j⌿k = E关共⌿ j − m j兲共⌿k − mk兲T兴 =
1 MN 兺 共⌿ 共l兲 − m j兲共⌿k共l兲 − mk兲. MN − 1 l=1 j
C is a real, symmetric matrix that can be expressed as Journal of Electronic Imaging
C = U⌳UT ,
共4兲
where U is a 3 ⫻ 3 orthonormal matrix of eigenvectors corresponding to the ordered eigenvalues 1 ⱖ 2 ⱖ 3 contained in the diagonal matrix ⌳ = diag共1 , 2 , 3兲. The principal components of ⌿ are calculated by Y = UT⌿ = 关Y 1 Y 2 Y 3兴T .
⌿2 ⌿3 ,
⌿3 ⌿1 ⌿3 ⌿2
共2兲
Fig. 4 Comparison of PCs with alternative gray-scale method: 共a兲 original DCD image with “invisible” debris; 共b兲–共d兲 corresponding R, G, and B channels, respectively; 共e兲 Matlab’s rgb2gray procedure; 共f兲 first PC; 共g兲 second PC, 共h兲 third PC.
共5兲
Hence, the variance of the original information is distributed among the eigenvalues, with the first eigenvalue 共1兲 representing the largest variance along the corresponding PC Y 1. The first PC is selected as the medium for classification under the hypothesis that the corresponding eigenvalues bears more than 75% of the overall variance. In the rare cases where this is not true, the channel with the highest variance is chosen. Sample re-ordered versions of Y 1, Y 2, and Y 3 are shown in Figs. 4共f兲–4共h兲. Once a high-contrast gray-scale image has been obtained, a local normalization 共LN兲 procedure is employed to compensate for non-uniform background situations. The LN process is designed to handle large illumination variations 关see Figs. 5共a兲 and 5共c兲兴 characteristic of a number of samples in the database. This approach is given by
033015-5
Jul–Sep 2007/Vol. 16(3)
Ugbeme et al.: Automated algorithm for the identification of artifacts…
Fig. 7 ROI feature extraction for 共a兲–共c兲 deletion, DCD, and mottle images, respectively; 共d兲–共f兲 respective morphologically opened images. Fig. 5 Local normalization: 共a兲 non-uniform background sample; 共b兲 local normalized version of Fig. 5共a兲; 共c兲 binarized result of Fig. 5共a兲; and 共d兲 binarized result of Fig. 5共b兲.
g共i, j兲 =
f共i, j兲 − m f 共i, j兲 , f 共i, j兲
共6兲
where • • • •
f共i , j兲 is the selected/transformed gray-scale image, m f 共i , j兲 is an estimation of the local mean of f共i , j兲, f 共i , j兲 is an estimation of the local standard deviation, g共i , j兲 is the output image.
The above-outlined approach efficiently removes variations in the image 关see Fig. 5共b兲兴. The block diagram in Fig. 6 depicts the implementation of the LN procedure. An estimation of the image’s local mean is obtained by filtering with a 70⫻ 70 spatial Gaussian low-pass filter, h1共i , j兲 of standard deviation, 1 = 21. The 关·兴2 and 冑关·兴 symbols 共see Fig. 6兲 represent the “square” and “square root” operations, respectively, and are used to complete the computation of the standard deviation. The second smoothing filter, h2共i , j兲 is equivalent to h1共i , j兲. 3.2 ROI Identification and Defect Classification 3.2.1 ROI identification We process g共i , j兲 by utilizing a median-based thresholding approach to select the ROIs. Other thresholding schemes tend to immediately separate the debris without providing any deletion boundary. The median threshold was observed to be more robust to noise and outliers within the image
Fig. 6 Local normalization block diagram. Journal of Electronic Imaging
when compared to a mean-based thresholding. If the median is given by TM , then the binary image b共i , j兲 is computed as b共i, j兲 =
再
1,
if g共i, j兲 ⱖ TM ,
0,
if g共i, j兲 ⱕ TM .
共7兲
The images in Figs. 5共c兲 and 5共d兲 were obtained by utilizing Eq. 共7兲. An opening morphology operation28 is then employed to remove noisy objects from the binary image, b共i , j兲. Figure 7 depicts a comparison of typical morphologically “opened” images obtained from a deletion, DCD, and mottle images, respectively. The opening morphological operations yield a binary image, where the pixels that differ from the specified shape and size of the 2 ⫻ 2 structural element are assigned the value of 1 and are displayed as “white.” The corresponding largest group of connected white pixels is selected as the ROI. The relationship between the largest region and its neighbors is employed as a discriminatory feature. Note that the size of the largest region is not necessarily equivalent to the area of the defect but is utilized to provide its corresponding location for classification purposes. Specifically, the ratio of the root mean square 共RMS兲 of the largest ROI to the RMS of other ROIs is employed as the feature of interest. This feature is thereafter compared to an empirically determined threshold T0 to yield class decisions 共at the first decision node兲 between mottle and deletion-type 共or non-mottle兲 images. Figure 8 shows typical distributions of the number of pixels in each region for a mottle type and a non-mottle type. If the signal of interest is given by the major ROI, then we expect a large signal-to-noise ratio 共SNR兲 for the non-mottle image and a low SNR for a mottle image. In order to ensure that only defects bearing a deletiontype signature are considered for further processing, we impose a shape contour test by utilizing the Hausdorff distance.29 In particular, the contour of the major ROI is compared to a fitted ellipse’s contour, which is created using a similar approach to that found in Saber et al.30 Additionally, the rectangularity31 of the major ROI measured by the ratio of the area of the region to the area of its minimum bounding rectangle 共MBR兲 is employed as another feature.
033015-6
Jul–Sep 2007/Vol. 16(3)
Ugbeme et al.: Automated algorithm for the identification of artifacts…
Fig. 9 Missing debris identification procedure.
The desired threshold can thus be obtained as RT = 兵R1:RD ⬎ 其,
Outlier threshold = min兵RT其,
共9兲
where = 5 共i.e., minimum number of pixels兲 for our purpose. To avoid conflicts 共i.e., two or more bright outlier regions兲, the largest region is simply chosen. An outlier factor 共OF兲 共i.e., a measurement of how significantly a group of pixels deviates from other neighboring pixels兲 is compared with a threshold T3 as OF ⱖ T3 Fig. 8 Study of SNR of 共a兲 typical mottled image; 共b兲 typical nonmottle type.
These two features 共i.e., Hausdorff distance and rectangularity兲 ensure that only defects exhibiting an elliptical shape configuration are regarded for further processing. They are compared with the thresholds T1 and T2 to separate unknown defects from deletion-type samples. This completes the second decision node. 3.2.2 Outlier processing (deletion vs. DCD) The first step toward processing only deletion-type images utilizes the convex hull of the major ROI as a mask 关Fig. 9共a兲兴 for the replacement of potential missing debris pixels. To obtain these pixels, a threshold is automatically computed and applied to the masked region. Let p represent a given gray level. This threshold is obtained by first generating the histogram h共p兲 for pmin ⱕ p ⱕ pmax, as shown in Fig. 9共b兲. Then, the set containing possible bright outlier pixels within the mask is defined by R1 = 兵p:h共p兲 ⬎ 0
and
p ⬎ pmin + 0 . 75*共pmax − pmin兲其, 共8兲
where the constraint p ⬎ pmin + 0 . 75*共pmax − pmin兲 is designed to limit the desired threshold to only 25% of the bright pixel values. Let RD be a new set of elements, which are backward differences between adjacent elements of R1. Journal of Electronic Imaging
and
OF = median兵OG其 − median兵N P其,
共10兲
where OG⫽potential outlier group and N P⫽neighborhood pixels contained in a bounding box around OG. This helps to quantify the outlier measure of the region in question in order to determine its significance to its neighbors. Figure 9 shows a successful identification of the missing pixels, where the OG region 关Figs. 9共c兲 and 9共d兲兴 has been obtained via thresholding with the desired outlier threshold value. The N P region 关Fig. 9共d兲兴 is created from a 1-pixel boundary around OG. To efficiently differentiate between deletion and DCD defects, we exploit the major difference—the presence of a group of dark pixels in an approximate center of the elliptical region. This is a difficult task, as demonstrated in our previous procedure,32 wherein information from the histogram was utilized to devise a threshold that localizes possible debris pixels. Due to the noisy nature of deletion samples, additional steps involving the acceptance or rejection of segmented dark pixels are needed. For the lowcontrast DCD images, the debris pixels are not successfully identified after thresholding. Figure 10 shows intermediate results obtained by applying several thresholding mechanisms to pixels within the created mask 关Fig. 10共b兲兴 for a DCD sample. The best result 关Fig. 10共e兲兴 is achieved by a hole-emphasizing routine, which utilizes morphological reconstruction to “fill holes” in the image and thereafter compute a difference image. This was shown to provide superior results when compared with standard thresholding techniques such as Otsu’s method,33 as illustrated in Figs. 10 and 11. Otsu’s method 关Fig. 10共c兲兴 does not provide a desirable outcome, while the modified Otsu’s approach17,33 关Fig. 10共d兲兴 is close to the ground-truth result but is noisier
033015-7
Jul–Sep 2007/Vol. 16(3)
Ugbeme et al.: Automated algorithm for the identification of artifacts…
Fig. 12 Difference images: 共a兲 DCD, SNR= 22 dB; 共b兲 deletion, SNR= 15 dB.
Fig. 10 Within-mask segmentation: 共a兲 original image; 共b兲 masked image; 共c兲 Otsu’s thresholding; 共d兲 modified Otsu’s thresholding;17,24 共e兲 morphological reconstruction approach.
compared to the morphological reconstruction approach. Figure 11 illustrates a similar situation with a noisy deletion image. The “fill-hole” process is a special morphological transformation28 共called a geodesic transformation兲 that accepts two images—a marker and a mask. The mask is used to restrict the growth 共or decay兲 of the marker image during
Fig. 11 Within-mask segmentation for noisy image: 共a兲 original image; 共b兲 masked image; 共c兲 Otsu’s thresholding; 共d兲 modified Otsu’s thresholding; 共e兲 morphological reconstruction approach. Journal of Electronic Imaging
regular morphological operations. For this process, the marker is set to the maximum value of the image except along its border, where the values of the original image are kept, while the mask is represented by the image itself. An erosion of the marker is then iteratively performed until a stable result is achieved. The final eroded marker constitutes the filled image, and the holes can be obtained by subtracting the input image from the filled one 共see Ref. 28 for a detailed explanation兲. This morphological reconstruction ensures only prominent dark pixels are emphasized, as shown in Fig. 12. The gray-scale SNR of the difference image is used to quantify the disparity between DCD and deletion samples. If the peak points denote the debris of interest, then the DCD are expected to possess a higher SNR level when compared to the deletion. A low SNR is an indication that no further processing is required and therefore that no prominent outliers exists. The number of pixels representing the debris is utilized as the discriminating feature between deletion and DCD samples. The Mahalanobis distance,8 in a normalized range 关0,100兴 of the segmented debris from the center of the mask 关i.e., convex hull of major ROI as in Fig. 9共a兲兴, is employed for classification between DCDs and deletions. This results in a final classification of the artifact into one of five possible categories. 4 Experimental Results We tested the performance of our proposed algorithm on a database of 276 images of artifacts 共see Fig. 1 for a representative sample兲 that consists 共1兲 264 scanned images of RGB format provided by Xerox Corporation with accompanying ground-truth labels provided by a QAP, and 共2兲 12 non-defective and synthetic images 共Fig. 13兲 comprising logos and “rectangular” shape defects. The scanned images were comprised of 68 DCDs, 23 debris-missing DCDs, 80 deletions, and 93 mottle images 共see Table 1兲. The synthetic images were introduced to test the algorithm’s robustness and to ensure that only regions satisfying the “elliptical” ROI property are processed as deletion-type defects. The region of interest portraying the artifacts is scanned at 600 dots per inch 共dpi兲 using a flat-bed scanner typical to the one available at any print shop to ensure high quality and sufficient pixel detail. The thresholds utilized in our classi-
033015-8
Jul–Sep 2007/Vol. 16(3)
Ugbeme et al.: Automated algorithm for the identification of artifacts…
Fig. 13 Synthetic samples: 共a兲 DCD; 共b兲 deletion; 共c兲 and 共d兲 logos.
Fig. 14 Misclassified samples: 共a兲 DCD with low contrast; 共b兲 DCD with an invisible bead; 共c兲 and 共d兲 deletions with possible debrismissing regions.
fication were T1 = 25, T2 = 0.8, and T3 = 0.158. These were obtained by empirical testing. Of the 23 debris missing DCD images, a few samples exist that are very challenging, due to their manifestation, and as such can easily be misclassified as deletions by an operator or QAP. The performance of our proposed algorithm is documented in Table 1. The classification accuracy of the DCD class is 86.76%. The misclassified samples are a result of low-contrast images 关see Figs. 14共a兲 and 14共b兲兴, where the bead is barely visible or missing entirely, resulting in a low signal-to-noise ratio. Given the lack of contrast, it is entirely possible that these samples would also be misclassified by operators and/or QAPs in a production-type environment. Deletion classification yields 97.5% accuracy. Misclassified samples appear to possess a potential missing debris group of pixels 关Figs. 14共c兲 and 14共d兲兴 and thereby are classified as debris-missing DCDs by our proposed algorithm. Once again, this misclassification can be attributed to potential confusion from the ground-truth information. The results for the remaining categories are also shown in Table 1, where the mottle and arbitrary images were classified with 99% and 100% accuracy, respectively. The total cor-
rect classification rate is 94.95%, which is obtained from a weighted average of the given individual accuracies. The effectiveness of the principal component transformation for gray-scale conversion is also demonstrated. Table 2 shows the resultant classification obtained using a standard RGB-to-gray conversion, similar to the one found in Matlab26 共see rgb2gray function兲. It can be seen from Table 2 that the Matlab rgb2gray function results in lower classification accuracy especially for the case of debrismissing DCDs. The robustness of the algorithm against varying degrees of random Gaussian noise was tested. First, the noise present in the normal images was quantified by selecting random samples and extracting arbitrary-sized cropped regions from various locations in the image. We found the images to have an intrinsic noise level with standard deviation ⬇ 0.04; thus, any additional noise tends to further deplete the contrast. Repeated tests with white Gaussian noise 共 = 0.01, 0.02, and 0.05兲 are summarized in Fig. 15, from which it can easily be seen that the classification accuracy is inversely proportional to the level of noise added, due to a significant drop in contrast. Mottle tends to hold up
Table 1 Classification results using our proposed method. Classification results Number of Images
DCD
Debris Missing DCD
Deletion
Mottle
DCD
68
59
3
5
1
Debris-missing DCD
23
2
21
Deletion
80
2
Mottle
93
Other
12
True Class
Journal of Electronic Imaging
Unknown
Accuracy DCD 86.76% 91.3%
78 1
97.5% 92
99% 12
033015-9
100%
Jul–Sep 2007/Vol. 16(3)
Ugbeme et al.: Automated algorithm for the identification of artifacts… Table 2 Classification results using Matlab’s rgb2gray approach. Classification Results Number of Images
DCD
Debris Missing DCD
Deletion
DCD
68
51
1
13
3
75%
Debris missing DCD
23
1
3
18
1
13%
Deletion
80
3
Mottle
93
Other
12
True Class
Unknown
77
100% 12
5 Conclusions In this paper, an algorithm for automatically classifying a specific set of image-quality defects in printed documents is proposed. The algorithm accepts scanned versions of defected printed media, where the defect has been localized a priori by a customer service engineer, and provides accurate classifications of defect type 共deletion, DCD, debrismissing DCD, or mottle兲. Due to large variations between elements of the same class, several preprocessing techniques were carried out on each image to attain some level of uniformity among the samples. Using a custom tree classifier, binary decisions were made by employing simple shape and size constraints at each node. The use of principal component analysis to obtain a gray-scale image preserves the contrast of the original RGB sample. Additionally, the use of local normalization procedures helps to
Fig. 15 Addition of increasing levels of Gaussian noise and resulting performance.
Accuracy
96.25% 93
well against the noise due to its inherently noisy nature. The misclassified deletion images are classified as Mottle and tend to worsen with increasing noise. As the level of noise is increased from = 0.01, 0.02, and 0.05, the total classification 共average of all the classifications兲 is reduced from 93.51%, 86.22%, and 78.68%. Since the acquisition of the images will normally take place under non-noisy conditions, this does not represent a major limitation of the algorithm.
Journal of Electronic Imaging
Mottle
100%
avoid misclassifications by making the background illumination uniform wherever possible. An accuracy of 94.95% was still attained despite the noisy nature and low contrast of several samples. However, this accuracy tends to depreciate with increasing noise levels. Since this procedure has proved to be quite successful, the next step involves an automation of the defect localization process by possibly incorporating the original electronic document along with an online scan of the printed output to help in automatically localizing and classifying the artifact. Acknowledgments This research was funded in part by the Center for Electronic Imaging Systems 共CEIS兲, a NYSTAR-designated Center for Advanced Technology, Xerox Corporation, and the Electrical Engineering Department at the Rochester Institute of Technology. The authors wish to thank Dr. Daniel Phillips and Dr. Sohail Dianat for their helpful comments. References 1. Y. Rui, T. S. Huang, and S. Chang, “Image retrieval: Current techniques, promising directions, and open issues,” J. Visual Commun. Image Represent 10共1兲, 39–62 共1999兲. 2. A. M. W. Smeulders, M. Worring, S. Santini, A. Gupta, and R. Jain, “Content-based image retrieval at the end of the early years,” IEEE Trans. Pattern Anal. Mach. Intell. 22共12兲, 1349–1380 共2000兲. 3. H. Burkhardt and S. Siggelkow, “Invariant features for discriminating between equivalence classes.” In Nonlinear Model-based Image/ Video Processing and Analysis, John Wiley and Sons, New York 共2000兲. 4. M. K. Hu, “Visual pattern recognition by moment invariants,” IRE Trans. Inf. Theory IT-8, 179–187 共1962兲. 5. R. C. Gonzalez and R. E. Woods, Digital Image Processing, 2nd ed., Prentice Hall, Englewood Cliff, NJ 共2002兲. 6. B. M. Mehtre, M. Kankanhalli, and W. F. Lee, “Shape measures for content based image retrieval: A comparison,” Inform. Process. & Manage. 33共3兲, 共1997兲. 7. Y. Rui, T. S. Huang, and S. Mehrotra, “Content-based image retrieval with relevance feedback in MARS,” Proc. of IEEE Int. Conf. Image Process., Vol. 2, pp. 815–818, 共1997兲. 8. W. Y. Ma and B. S. Manjunath, “Netra: A toolbox for navigating large image databases,” Multimedia Syst. 7共3兲, 184–198 共1999兲. 9. R. O. Duda, P. E. Hart, and D. G. Stork, Pattern Classification, 2nd ed., John Wiley and Sons, New York 共2001兲. 10. N. Vasconcelos, “On the complexity of probabilistic image retrieval,” IEEE Int. Conf. Comp. Vis. Patt. Recog., Vol. 2, pp. 400–407 共2001兲. 11. N. Beckmann, H. Kriegel, R. Schneider, and B. Seeger, “The R*-tree: An efficient robust access method for points and rectangles,” ACM SIGMOD Int. Conf. Mange. of Data, Atlantic City, NJ 共1990兲. 12. H. Samet, “The quadtree and related hierarchical data structures,”
033015-10
Jul–Sep 2007/Vol. 16(3)
Ugbeme et al.: Automated algorithm for the identification of artifacts… ACM Comput. Surv. 16共2兲, 187–260 共1984兲. 13. H. J. Zhang and D. Zhong, “A scheme for visual feature-based image indexing,” Proc. of SPIE Conf. on Storage and Retrieval for Image and Video Databases III, pp. 36–46, San Jose, CA 共1995兲. 14. J. Iivarinen and A. Visa, “An adaptive texture and shape-based defect classification,” Proc. of the 14th Int. Conf. Patt. Rec., Vol. 1, pp. 117–122 共1998兲. 15. Y. Li and T. W. Liao, “Weld defect detection based on Gaussian curve,” IEEE Proc. 28th Southeastern Symp., pp. 227–231 共1996兲. 16. D. Mery and M. A. Berti, “Automatic detection of welding defects using texture features,” Insight 45共10兲, 676–681 共2003兲. 17. H. Ng, “Automatic thresholding for defect detection,” Proc. 3rd Int. Conf. Image and Graphics, pp. 532–535 共2004兲. 18. J. C. Briggs, D. J. Forrest, A. H. Klein, and M. Tse, “Living with ISO-13660: Pleasures and perils,” Proc. IS&T’s NIP15, Int. Conf. Digital Printing Tech., Orlando, FL 共1999兲. 19. ISO/IEC DIS 13660 Draft International Standard, “Office equipment—Measurement of image quality attributes for hardcopy output—Binary monochrome text and graphic images,” Int. Org. for Standardization, ISO/IEC JTC1 SC28 共1996兲. 20. D. R. Rasmussen, K. D. Donohue, Y. S. Ng, W. C. Kress, F. Gaykema, and S. Zoltner, “ISO 19751 macro-uniformity,” Image Quality and System Performance III, Vol. 6059 共2006兲. 21. S. P. Farnand, E. N. Dalal, and Y. S. Ng, “Recent progress in the development of ISO 19751,” Image Quality and System Performance III, Vol. 6059 共2006兲. 22. D. F. Dunn and N. E. Mathew, “Extracting color halftones from printed documents using texture analysis,” Proc. Int. Conf. Image Process., Vol. 1, pp. 787–790 共1997兲. 23. G. Sharma, “Methods and apparatus for identifying marking process and modifying image data based on image spatial characteristics,” U.S. Patent #6353675B1 共2002兲. 24. W. K. Pratt, Digital Image Processing, John Wiley & Sons, New York 共1991兲. 25. C. Bunks, Grokking the GIMP, 1st ed., New Riders Publishing, New York 共2000兲. 26. R. C. Gonzalez, R. E. Woods, and S. L. Eddins, Digital Image Processing Using MATLAB, 1st ed., Prentice Hall, Englewood Cliffs, NJ 共2003兲. 27. J. E. Jackson, A User’s Guide to Principal Components, 1st ed., John Wiley & Sons, New York 共1991兲. 28. P. Soille, Morphological Image Analysis: Principles and Applications, Springer-Verlag TELOS, New York 共1999兲. 29. D. Huttenlocker, G. Klanderman, and W. Rucklidge, “Comparing images using the Hausdorff distance,” IEEE Trans. Pattern Anal. Mach. Intell. 15共9兲, 850–863, 共1993兲. 30. E. Saber and A. M. Tekalp, “Frontal-view face detection and facial feature extraction using color, shape and symmetry based cost functions,” Pattern Recogn. Lett. 19, 669–680, 共1998兲. 31. P. L. Rosin, “Measuring shape: Ellipticity, rectangularity, and triangularity,” Proc. 15th Int. Conf. on Patt. Recog. 共2000兲. 32. O. A. Ugbeme, E. Saber, and W. Wu, “An automated defect classification algorithm for printed documents,” Proc. International Cong. Imaging Science, pp. 317–320 共2006兲. 33. N. Otsu, “A threshold selection method from gray-level histogram,” IEEE Trans. Syst. Man Cybern. SMC-8, 62–66 共1978兲.
Eli Saber is an associate professor in the Electrical Engineering Department at the Rochester Institute of Technology 共RIT兲. Prior to that, he worked for Xerox Corporation from 1988 until 2004 in a variety of positions, ending as product development scientist and manager at the Business Group Operations Unit. He received his BS degree in electrical and computer Engineering from the University of Buffalo in 1988 and his MS and PhD degrees in the same discipline from the University of Rochester in 1992 and 1996, respectively. From 1997 until 2004, he was an adjunct faculty member at the Electrical Engineering Department of RIT and at the Electrical & Computer Engineering Department of the University of Rochester. His research interests are in the areas of digital image and video processing, including video segmentation, object tracking, contentbased video analysis and summarization, multicamera surveillance video processing, and image understanding. He is an associate editor for the IEEE Transactions on Image Processing, the Journal of Electronic Imaging, the IEEE Signal Processing Magazine Applications Column, and guest editor for the special issue on color image processing for the IEEE Signal Processing Magazine. He is currently serving as the chair of the IEEE Technical Committee 共TC兲 on Industry DSP Technology and is a member of the Image and Multidimensional Digital Signal Processing TC. Wencheng Wu received his PhD degree in electrical engineering from Purdue University, Indiana, in 2000. He is currently a member of Wilson Center for Research and Technology at Xerox Corporation working on the development of print quality metrics, image simulation, and modeling for print quality evaluation, etc. He is a member of the Institute of Electrical and Electronic Engineers 共IEEE兲, the Phi Tau Phi Scholastic Honor Society, and the Imaging Science and Technology Society. He is also the current section chair of IEEE Signal Processing Society, Rochester, NY.
Onome Augustine Ugbeme received his MS degree in electrical engineering from the Rochester Institute of Technology 共RIT兲, Rochester, NY, in 2006 with a focus in image and video processing. He received his BS degree in electrical engineering from the University of New Orleans, Louisiana, in 2004. He is currently an audio/video software engineer at Advanced Micro Devices 共AMD兲 Digital TV unit. He is a member of the IEEE, the National Society of Black Engineers 共NSBE兲, and the Tau Beta Pi and Eta Kappa Nu Honor Societies.
Journal of Electronic Imaging
033015-11
Kartheek Chandu is currently pursuing his MS degree in electrical engineering at the Rochester Institute of Technology 共RIT兲, Rochester, NY. He obtained his BS degree in electronics and communication engineering from the Nagarjuna University, A.P., India, in 2005. He is a member of the IEEE. At the Rochester Institute of Technology, he is a research assistant working on online defect analysis.
Jul–Sep 2007/Vol. 16(3)