Enterprise Systems and Software Laboratory. HP Labs. Palo Alto, USA. {yuan.chen, dejan.milojicic}hp.com. AbstractâPolicy-driven service management helps ...
Automated Availability Management Driven by Business Policies Zhongtang Cai1, Yuan Chen2, Vibhore Kumar1, Dejan Milojicic2, Karsten Schwan1 1
2
College of Computing Georgia Institute of Technology Atlanta, USA {ztcai, schwan, vibhore}@cc.gatech.edu Abstract—Policy-driven service management helps reduce IT management cost and it keeps the service management aligned with business objectives. While most of the previous research focuses on performance/resource managements, little has been researched in the area of availability management driven by business policies. This is a critically important task in enterprise IT, because a single failure in enterprise IT could cause huge business loss. It is still unclear how we can automate the availability management in a highly dynamic and complex system according to business level objectives for performance and risk attitude/preference. As a consequence, users can not manage the availability/performance ratio to match their risk tolerance. In this paper, we propose a policy-driven approach to automate run-time availability management in IT systems, according to high level availability and performance objectives. We further apply von Neumann-Morgenstern utility theory to deal with users' risk attitude and preference. Based on the proposed approach, we implement an automated decision engine for availability management. The initial evaluation of the solution illustrates the significance of the policy-driven approach and it demonstrates its applicability for availability management in complex IT environments. This way IT users can customize their availability to the risks tolerable by business objectives. Keywords: availability management; automated; business policy; utility function; risk attitude; preference structure
I.
INTRODUCTION
As businesses are increasingly dependent on their IT environment for critical business function, IT service management solution driven by business policies is taking on a crucial role. In IT service management driven by business policies, the underlying IT systems are designed to maximize the business values of the services offered by IT and to continuously change as business needs change. A key goal of the IT service management driven by business policies is to use business policy to guide resource management and allocation in the IT infrastructures used to carry out business tasks. In the datacenter environment, for instance, business policy has been shown important for guiding
Enterprise Systems and Software Laboratory HP Labs Palo Alto, USA {yuan.chen, dejan.milojicic}hp.com
provisioning for the different applications that share the center’s computing resources [1]. In the high performance domain, batch schedulers routinely use high level policies to determine the allocation of parallel machines to applications [2]. In the operational information systems, tradeoffs exist with respect to the performance vs. reliability of business applications, recovery time (MTTR) being a key metric. The research presented in this paper makes several contributions to the domain of IT management driven by business policies: •
Rigorous methods and an associated management framework relate business objectives to the IT services that implement certain business tasks and to the performance implications of provisioning changes for IT services - performance model and availability model;
•
An automated decision engine continuously optimizes IT availability management and controls service provisioning based on expected utility value in order to maximize high level business objectives;
•
A new risk-based formulation of business policy combines the Service Level Agreements (SLAs) used in prior work with notions of risk tolerance to better capture current operational needs and requirements; and
•
Novel management methods based on risk tolerance and SLAs are shown useful for runtime guidance and control of performance/reliability tradeoffs in two different business environments: (1) multi-tier business applications and (2) operational information systems.
Our focus on reliability is driven by multiple facts. First, failures are a key threat to enterprise systems, since they can result in unacceptable levels of service unavailability and lead to substantial revenue loss [3]. Second, handling failure manually is both a difficult and error-prone task, constituting a strong motivation for automating system management. This complexity is evident both for the datacenter environment [4] evaluated in this paper and the complex, distributed service-based systems now being developed and deployed in industry [5]. The complexity derives from several factors. First, modern enterprise services typically comprise multiple systems and sub services, and often interact with other services. In addition to this complexity, the growing scale of modern enterprise service (e.g., tens of thousands of services instances running in HP
1
consolidated data center) cause manual availability management almost impossible. At the same time, the business objectives or policies are diverse and complicated, and often involve performance, availability, security and other aspects. While the operational policies are the actual policies used in practice to manage IT services, instead of business policy, it is hard to assess the business value of the service management using operational policies, and align them to high level business objectives and policies. Finally, fault tolerance mechanisms (e.g., active standby and passive standby) themselves are complex and different mechanisms are applicable under different situations since they may offer different levels of reliability, recovery times, as well incur different overhead or performance penalty. Third, there are some well-known causes of failures, one being increased failure rates under high loads, another being failures caused by external interventions such as the application of system patches or change of configurations [13]. They occur very frequently in large-scale enterprise data center and automated management to improve service availability in these situations is highly demanded. Fourth, it is possible to directly relate managerial attitudes concerning failures to different levels of risk tolerance. Given the tradeoff between performance and downtime, low risk tolerance might choose lower downtime values, whereas high risk tolerance might choose higher performance. For example, policy may directly prohibit patching under conditions of high load - i.e., low risk tolerance. More generally, in the operational information systems run by one of our industry partners [6], risk tolerance is an approximation of a combination of factors, including peak vs. non-peak operational time, proximity to delivery time for certain subsystem output, and others. Risk tolerance, therefore, is an aggregate measure of managerial policy. Specific research results presented in this paper use risk tolerance to adjust system performance/reliability characteristics in response to system changes. One case considers patch application or service replacement for multi-tier web services. Another case considers the aforementioned aggregate measure of risk. Results demonstrate entirely different tradeoffs made for riskaverse vs. risk-tolerant scenarios. They also show the effects of different risk vs. utility curves. The remainder of this paper is organized as follows. The next section motivates the paper, emphasizing importance of availability management in enterprise computing. In Section III, we present our approach, including the framework, models and automated decision engine. Section IV discusses how to apply utility theory to deal with users' risk attitude. Experimental evaluations, related work, and lessons learned, are given in Section V, VI, and VII, followed by conclusion. II.
MOTIVATION EXAMPLE
Failures in enterprise systems [4, 6] can result in substantial revenue loss. For example, it is reported that the average cost per hour of downtime for financial organizations can be up to 6.5 million US dollars, and for retail systems such as the home shopping industry, the cost can be up to 113 thousand US
dollars per hour of downtime [3]. The continued growth in scale and complexity of these applications and their IT infrastructures, however, makes it difficult, if not impossible for human end users to continuously maintain and improve their availability. Factors contributing to this difficulty include the diverse and complex business objectives and policies, and changing run-time environments as well as changing demand behaviors. An important goal, therefore, is to automate availability management in large enterprise systems, both to provide higher levels of availability and performance and to reduce management cost [7]. Availability management must consider risk and risk attitude policies [8]. One intuitive example of risk attitude policies given in [8] is, “given a choice between good performance and mediocre downtime, or mediocre performance and good downtime, I’d pick the second one (or some other customers will pick the first one).” Consider the Operational Information System (OIS) run by one of our industrial partners, a major U.S. airline. OIS is responsible for a wide array of tasks that range from facilitating passengers check-in, to baggage handling, to flight updates, and even supporting the website that allows online check-in, and ticket sales. From an operational point of view, different components of the OIS exhibit different levels of risk. A flight positioning subsystem, using FAA inputs, for example, can tolerate some loss of state since the FAA feed periodically updates each flight’s positions [6]. Conversely, the subsystem performing passenger check-in must be highly reliable. At the same time, risk is not a static quantity. An OIS sub-component providing services to a flight ready to depart in 5 minutes is more critical, i.e., it is less risk-tolerant, than the sub-component serving a flight that is preparing for departure in 50 minutes, for instance. Quantifying such runtime changes in risk (criticality) would allow an enterprise to allocate more resources to a subcomponent that is currently at a higher level of risk. Service dependency Component/standby
Business Objective/Policies Service Model Policy Decision Engine
Utility Policies
Service Level Policies
Util($)
Performance Profiles
10 Policy Enforcement
5
Ud() =
dM −+
Ke 1e+ −+dM
Response Time d (ms)
0 0
20
40
60
Figure 1.Availability Management Framework Knowledge about risk can guide management of subsystems as well as that of individual components. An OIS example is perceived risk for the web server used to book flights, perform check-ins, etc. The two important attributes for this server are its response-time and availability. 2
Unfortunately, when resources are constrained, improved availability through methods such as active/passive standbys typically implies increased response-times. The resulting tradeoff in availability vs. response-time must be guided by its effect on the users (potential customers) accessing the web-site. Risk tolerance, i.e., the willingness to tolerate risk, is high, for instance, when loads are high. In this case, as in other enterprise systems, fault-tolerance modulated based on currently perceived risk, can exploit the fact that risk may be quantified as potential loss of revenue. A high risk state is one in which a failure in that state would cause a high loss of revenue or the amount of potential revenue loss is high. As a result, enterprise policy might dictate a preference for higher availability in such conditions. III.
AVAILABILITY MANAGEMENT DRIVEN BY BUSINESS POLICIES
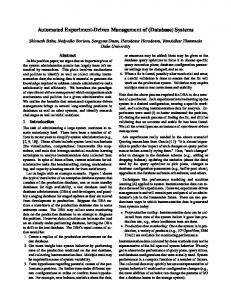
A. Framework Our availability management leverages a policy-driven approach to automate the run-time availability management in IT systems, according to high level availability and performance objectives. The framework is shown in Figure 1. Business objective is the business level metrics including utility which we want to maximize. The business policies specify a set of business level regulations. Examples of this kind of policies are: 1. 2. 3.
Customer with revenue greater than $100K/Year should be classified as gold customers (Class 1 customers). Services for gold customers should have at least fournines availability Services for bronze customers should not consume more than 20% of the utility data center (UDC) resources.
While business policies are the high level policies the automated service management should adhere to, the operational policies are the actual refined policies which are used to manage the service availability at run time. One typical example of the operational policies in availability management domain is to allocate passive standby to second instance of second tier, and checkpoint every 10 minutes. To ‘map’ the business policies to operational policies, a set of service models is used to specify the application topology, dependency between different sub systems or tiers, and setup information of services and their components. The service model will be used for availability modeling, performance modeling, operational policies generation, and cascading failures. A set of utility policies, which can also be viewed as part of the business policies (sometimes they are considered as business objectives, as they express customer satisfactions), express preferences for a variety of performance metrics, as well as metrics describing availability, security, and any other service attributes of interest. Often, utility function maps the performance metrics (e.g., response time) to monetary measurement (e.g., revenue). A widely used exponential utility
functions is in the form of:
U (d ) =
Ke − d + M , 1 + e− d + M
where d is the response time of the service requests and K and M is are constants which are specific to different services offered in the data center. The good property of this utility function family is that it reasonably well models the common business requirement for service response time, i.e., when the response time is less than a threshold M, the utility is almost constant (although it still decreases very slowly when the response time increases), and when the response time is higher than the acceptable threshold, when it is considered the response time is unacceptable, the utility will drop very quickly to almost 0. Note that different services for different customers will have different constant and the utility function could change over time. One concrete example in Delta Airline’s IT infrastructure is that one sub-system requires high performance (low response time) during a certain period of the day (from Midnight to early in the morning), and it has much lower requirement on the performance during other times. Our methodology can accommodate this kind of utility policies which change over time. The performance profile is used to estimate the relationship between performance and resource allocation, under current and predicted work load. Service model is used to estimate the availability of various services using different fault-tolerance methods, including active standby, passive standby, and proactive standby [9]. Business Policies and Objective
Service model / Performance Profiles
Resource Constraints
Performance Modeling G/G/1 Queuing System
Markov Chain Availability Analysis
Availability Formulations
Performance Formulations Mixed Integer Prog. Model
GAMS/cplex MIP Solver
Optimal operational Policy and its parameters
Figure 2. Policy Decision Engine Based on business policies, objectives, service model, and performance profiles, the policy decision engine (see Figure 2) first obtains the performance model and availability model, then forms a Mixed-Integer Programming (MIP) problem automatically which optimizes the service availability management according to high level business and utility policies, by finding the suitable availability operational policies. How the decision engine obtains the
3
performance/availability models and optimizes availability management is discussed in the next two subsections. B. Performance Model Although session arrival process is normally modeled as Poisson process, the request arrival rate for each component of a multi-tier application is not well-modeled as Poisson, as it largely depends on the load balancing/scheduling algorithms being used [10]. We therefore, use a G/G/1 queuing system (see Figure 3) for modeling the performance of this class of applications[11]. Let λs be the session arrival rate of application s, τ s be the average session length, and z s be the average session think-time. Then, by applying Little’s Law, the arrival rate of each component can be calculated as:
λs ,t ,i = β s ,t ,i λsτ s / zs , where β s ,t ,i is the component-specific constant for the ith component in tier t of application s. This constant depends on the load balancing and scheduling algorithm used in each tier and can be measured at run time. Assume the response time of customers’ request d s is broken down into per-tier response times, then d s = ∑ β s ,t ,i d s,t ,i / ∑ β s,t ,i , where d s ,t ,i is the average response i
i
time of each component, under its current workload and with its currently allocated resources. To estimate d s ,t ,i , we use a tight bound for G/G/1 waiting time:
wsu,t ,i −
1 + ρ s ,t ,i 2λs ,t ,i
≤ ws ,t ,i ≤ wsu,t ,i ,
where ρ s ,t ,i = λs,t ,i S s ,t ,i , and wsu,t ,i is the upper bound of
ws ,t ,i : wsu,t ,i = λs ,t ,i (σ s2,t ,i + σ '2s ,t ,i ) /(2 − 2 ρ s ,t ,i ) . To see the tightness of the above bounds, we can convert this waiting time bounds to the bounds for the mean number of requests waiting in queue, and the difference between the latter lower and upper bounds is 1 + ρ s ,t ,i , which is between 0.5 and 1 2 (events in the queue), because 0 < ρ s ,t ,i < 1 always holds. Now the response time of each component can be estimated by:
d s ,t ,i = ( wsu,t ,i + wsu,t ,i −
1 + ρ s ,t ,i 2λs ,t ,i
) / 2 + S s ,t ,i
Several parameters are needed in the above formulations. The average service time under some workload λs ,t ,i with allocated resource Rs ,t ,i , S s,t ,i = S s ,t ,i ( Rs ,t ,i ) , is determined using off-line profiling (performance model profiling). The variation
of service time σ '2s ,t ,i is determined with a similar method. The variation of request inter-arrival time can be measured online. Currently we use a simple moving average predictor to predict the inter-arrival time variation in the next time slot, but more sophisticated predictors can be used. β s ,t ,i ...
β s , t ,i
Tier3 ... G/G/1
G/G/1
Tier1 λsτ / z
Tier2
Tier4
β s ,t ,i
...
...
G/G/1
G/G/1
...
β s ,t ,i
G/G/1
β s ,t ,i
... G/G/1
Figure 3. G/G/1Queuing System Modeling of Multi-Tier Applications C. Availability Model There are several availability evaluation engines, such as Sharpe and Avanto [12]. We use a traditional Markov Chain Model. Figure 4 represents the Markov Chain Model of a twotier application with only two components. For simplicity, we only consider software failures, as software failures are usually the dominant failures in commercial utility data center [13], although the Markov Chain Model can be extended easily to consider the hardware failures. For limited space, we omit the formulations of Markov Chain analysis, referring interested readers to [14] for additional details. The allocated standbys help to increase the repair rate of the system under consideration. For example, active standby can decrease the repair time to almost zero, while passive standby reduces the repair time significantly by using checkpointing and recovery based on most recent checkpointed session state. At the same time, active and passive standbys require additional resource, thus causing performance penalty before failures. A specific resource considered in this paper is the CPU, which is normally the primary bottleneck for multi-tier applications in utility data center [15]. We also assume that virtualization methods and Work Load Manager (WLM) (e.g., such as those used in HP’s utility data center ([4]) make it easy to adjust primary and standby allocations. A specific cause of failures considered in our work are configuration changes and updates such as software patching. In web server applications, these are known to cause up to 40% of all failures [13]. For availability management, then, we model the change process as four phases: standby initialization, patching/change, failure detection, and recovery.. During the second phase, the primary component is typically un-available if it is patched, but it may still provide service if its configuration is being changed. If failure occurs in the failure detection phase, recovery phase is initiated immediately. The resources required by the standbys in each phase are profiled off-line, to determine the resource available in the performance model [9], and the performance model determines the utility obtained in each phase.
4
D. Resource allocation
IV.
Given a set of components, let As ,t ,i be the 0-1 variable that equals to 1 if an active standby is to be allocated for component C s , t ,i or 0 if no active standby is to be allocated for this component. Ps ,t ,i is 0-1 variable that equals to 1 if a passive standby is to be allocated for C s ,t , i . Finally, N s ,t ,i is 01 variable that equals to 1 if no standby is to be allocated for C s ,t ,i . Then, we have the following constraints that state only one standby can be allocated for one component: if then
As ,t ,i = 1
∑A
=1
s ,t ,i , k
k
if then
Ps ,t ,i = 1
∑P
s ,t ,i ,k
=1
k
and As ,t ,i + Ps ,t ,i + N s ,t ,i = 1, for all s,t,i. The following constraints guarantee that one standby is allocated to only one host: H
As ,t ,i (∑ As ,t ,i ,h ) = 1,
and
k =1
vNUM ( L) = ∑ Pi ⋅ vNMU ( wi )
k =1
1 if active standby As ,t ,i (or passive standby Ps ,t ,i ) is allocated at host h. Sometimes data center administrators or customers have specific restrictions on where the standbys should be placed at, for which the following additional constraints can be applied: if As ,t ,i = 1 then As ,t ,i ,1 + As ,t ,i ,5 + ... = 1 The primaries and standbys allocated on one particular host can use up to 100% of the CPU resource, thus the resource allocation constraints can be formulated as : As ,t ,i , h = 0
then CPU h, s ,t ,i ,a = 0 h ,s ,t ,i ,b
= 1, for
is
the
expected
von
i =1
where As ,t ,i ,h and Ps ,t ,i, h are 0-1 variable, and they are equal to
∑ CPU
A. von Neumann-Morgenstern Utility Theory Availability management usually involves uncertainty, and decision making in such circumstances should take into account the users’ preference structure, that is, how a user compares different outcomes of his or her decisions. In terms of availability management, how differently the outcome with failure and the outcome with no failure are valued implies the decision maker’s preference structure or risk attitude, e.g., good performance and mediocre reliability versus mediocre performance and good reliability. Different preference structure or risk attitudes will result in different decisions. Utility theory developed by von Neumann and Morgenstern can be used to deal with such decisions under uncertainly. We will informally describe this theory below. A comprehensive introduction of this theory can be found in [16]. Let W be a set of possible outcomes of lotteries and wi is one outcome in terms of money. A lottery L is defined as {(w1, P1), (w2, P2), ….(wn, Pn)}. Where Pi is the probability that outcome wi would happen. The von Neumann and Morgenstern theory suggests that if the preference structure satisfies certain primitive axioms, then L1 is preferred over L2 if and only if vNMU(L1) > vNMU(L2), where n
H
Ps ,t ,i (∑ Ps ,t ,i, h ) = 1,
if
RISK-ATTITUDE SENSITIVE AVAILABILITY MANAGEMENT
all
hosts h
s ,t ,i ,b
The objective function of this MIP problem is then: , Max(U ) = Max(∑ PU s s) s∈S
where U s is the average utility in each possible state in the Markov Chain, and Ps is the limiting probability of the corresponding state. This MIP formulation maximizes the expected utility of the data center. In the next section, we will consider the risk attitude policies under uncertainty, which result in a different objective function. All the constraints of the new MIP problem are the same as the constraints in this MIP problem.
Neumann-Morgenstern utility of L. In other words, a lottery is preferred over another one if and only if the preferred lottery has a lager expected utility. Based on this theory, a decision making becomes a procedure to find an alternative with maximal expected utility. The utility function vNMU is the value of a monotonically increasing function of the wealth level w. The function intuitively reflects how happy the decision maker is with its current wealth level. Consider a utility function, U defined over wealth w. Let MU (w) = dU (w) / dw . For everyone, regardless of their attitude, it is natural to assume that MU (w) > 0 since a person’s utility always increases in the amount of wealth that he has. We can then determine a person’s risk attitude through their marginal utility function MU(w) as follows. 1) dMU ( w) / dw > 0 ⇒ risk − seaking. In other words, the additional utility he gets from one more dollar is larger when he already has a larger amount of initial wealth. Loosely speaking, a risk-seeking person cares more about the upside potential than the downside risk. 2) dMU ( w) / dw < 0 ⇒ risk − averse. In other words, the additional utility he gets from one dollar becomes less with the increase of his wealth. Loosely speaking, a risk-averse person cares more about the downside risk than upside potential. 3) dMU ( w) / dw = 0 ⇒ risk − neutral. In other works, the additional utility is independent of the wealth level. Loosely, a risk-averse person cares equally about downside risk and upside potential. Risk attitudes explain why people buy insurance even though the insurance premium is usually much larger than the
5
expected loss from the insurance cause (i.e., risk-averse), and also why people buy lottery even though the money spent on lottery is usually much larger than the expected lottery prize (i.e., risk-seeking). Exponential utility functions are one of the most used type of risk-sensitive utility functions. In this paper, we consider a very popular exponential utility function in economics: Constant Relative Risk Aversion (CRRA) von NeumannMorgenstern (vNM) utility function. 1,1
λ1 μ1 0,1
λ2 μ2 λ2 μ2
1,0
λ1 μ1 0,0
Figure 4. Markov Chain for a Simple Two-Component Application B. Risk-attitude Sensitive Availability Manamgent Next we use an example to discuss how to apply the utility theory described above to deal with uncertainty and user’s preference in availability management. Our approach uses risk-sensitive utility function such as CRRA to capture users’ preference, and then optimize availability management by maximizing the expected utility. Table 1. Lottery Outcomes Options Performance Availability L1: (pP,hA) 55% of Max 99.999% L2: (hP,pA) 99.5% 97.25% L3: (gP,gA) 92% 99.95%
vNMU ( Li ) =
L2>L3>L1
C3: (`mediocre perf. and avail.’)
L3> L1>L2
α
,
where U is the performance outcome (e.g., 55%), and P is the probability that the performance outcome could happen (e.g., 99.999%). It’s straightforward to show (1) 0< α 1 Ù risk seeking, the bigger α is, the more risk-seeking the person is. To estimate the value of α for C1, we use the outcome preference of this user, i.e., L1>L3> L2, to find the estimated range of α . Given more preferences of the customer, we can further narrow down the range, and when the range is narrow enough, the average of the upper and lower bounds is sufficiently good to represent the user’s risk attitude [16]. There exist other techniques to fix the value of α , if that is preferred. One technique is to find the equivalent outcomes, which states two outcomes make no difference to the customer. It results in an equation with α as the single variable to be determined. Another technique is to find the limit of the user’s risk attitude. For example, for customer C1, if he states further that L1’s five-nines availability is good enough for him, and other outcomes with even lower performance and higher availability are not as attractive to him as outcome L1, then the lower bound of α we found previously (which is 0.001) is the value that represents this customer’s risk attitude. Similarly, we found that α for customer C2 is 0.37. The α for customer C3 is estimated at 0.03, by averaging the lower and upper bounds derived by the preferences stated in Table 2 (we can refine the α for customer C3 by asking more preference questions, but the lower and upper bounds turn out to be sufficient to differentiate the outcomes in the experiments). To manage the availability according to customer’s risk attitude under uncertainty, we simply replace the objective function of the previous MIP with the new objective function:
Max(vNMU ) = Max (∑
Table 2. Preferences of Outcomes Customer Preference C1: (`like high availability’) L1>L3>L2 C2: (`like high performance’)
PU α
s∈S
4-tier J2EE web server
α PU s s
α
2-tier webserver
). Airline Revenue System
Active Standby
To manage the availability according to users’ preference structure, we first need to find the user’s risk attitude under uncertainty. In our example, we use three typical possible outcomes (‘lottery outcomes’ in game theory) to elicit user’s risk attitudes (Table 1). Intuitively, L1 represents an outcome with very high availability (five nines) with poor performance, L2 represents an outcome with very high performance with poor availability, and L3 represents an outcome with mediocre performance and mediocre availability. Different customers have different risk attitudes, for example, customer C1 (Table 2) prefers L1 to L3, and prefers L3 to L2, since he likes really high availability (very risk-averse), while customer C2 prefers L2 to L3, and prefers L3 to L1. Their different risk attitudes are captured by the CRRA vNM utility function, which has the form of:
Passive Standby
Figure 5 Example Services in Utility Data Center V.
EXPERIMENTS
We evaluate our approach in a utility data center scenario, as shown in Figure 5, with three multi-tier applications. The first one is a 4-tier J2EE web server application with a load balancer tier, Apache HTTP server tier, Tomcat Servlet server tier and MySQL database server tier. The second application is a 2-tier web server with one load balancer tier and one Apache
6
HTTP server tier. The third application is a two-tier airline revenue sub-system. The experiments are to validate our approach in two aspects. The first experiment is availability management during changes [13]. The second experiment is availability management according to customers’ risk attitudes. To simulate the failures, we use a trace-based queuing system simulator, which has as inputs the user request arrival time traces for each server, and the service time traces for each component as input. Additional experiments conducted on the real test-bed with injected failures are currently underway. The simulation engine is similar to the simulation engine used by Janakiraman et al. [12]. In our work, each component processes the request according to the time logged in the service time traces, while the simulation engine used in their work is based on estimated service time distribution. The load balancing algorithm for each tier is the widely used round-robin algorithm (e.g., used in Linux Virtual Servers (LVS) [17]).
700
Utility
700
600
600
500
500
400
400
300
300
200
200
100 0 0
Time(Min) 10
(a) Utility with Failure 400 390 380 370 360 350 340
20
Utility
100 0 0
Time(Min) 10
20
(b) Utility without Failure
Expected Utility
A
P N Automated O (c) Expected Utility
Figure 6. Utility during
Patching Component C1,1,1 .
Patch/change starts at t=5min, and ends at 15min. Graph (a) is the utility when failure occurs, (b) is the utility when failure doesn’t occur, and (c) is the expected utility using active standby (denoted by A), passive standby (P), no standby (N), and automated standby configuration.
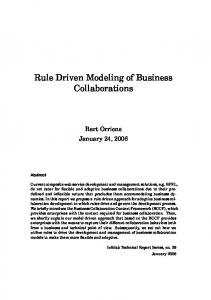
A. Availability Management During Changes To illustrate the importance of automated availability management for IT infrastructure, and to show how to optimize availability configuration to maximize expected utility, we introduce three different change scenarios in the first experiment: 1) patching component C1,1,1 (Server 1, Tier1, Component 1, and the probability that the component will fail after patch is 0.1, 2) patching component C1,2,2 and the probability that the component will fail after patch is 0.1, and 3) changing the configuration of component C1,1,1 , and because the risk of this change, the probability of failure is 0.7. The results are illustrated in Figure 6 to Figure 8. Figure 6 depicts the utility achieved by the J2EE web server under two different
situations: patch applied and the new component failed vs. patch applied without resultant failure. The expected utility, which we want to maximize is calculated by Pf U f + Pnf U nf , where Pf is the probability the new component will fail, and
U f is the average utility from the time patch is applied till the time the recovery is completed (20Mins). Pnf and U nf are the probability the new component will not fail and the average utility in the same time period. Expected utilities under three possible configurations (active standby, passive standby, no standby) are shown in Figure 6(c). In this experiment, our availability management automatically determines the active standby is the optimal configuration in this situation. While optimal in this scenario, active standbys are not desirable for all scenarios. For example, in Figure 7, the active standby provides higher levels of availability than needed and therefore, it has the worst expected utility as compared with other two possible configurations. The intuitive reason here is that the tier two has two replicated components and the failure probability that the patch will fail is low. In this case, it is better not to allocate standbys, in order to maximize the expected utility during change. Again, while the no-standby configuration is the best configuration in this scenario, it is not the best configuration for the third scenario (actually it is the worst one among three configurations). Instead the passive standby becomes the best configuration (Figure 8). The insight gained from these experiments is that although current availability management either doesn’t take any preventive procedures before changes, or use static/same configuration for different situation, one particular availability configuration can result in totally different behaviors in different situations, depending on many factors including the failure probability, current workload, available resource, patch time, and recovery time, etc. One optimal (or close to optimal) configuration for one particular scenario could easily become the worst configuration in other scenario, and it is important to automate the availability management so the appropriate configuration (operational policies) can be determined and executed automatically.
B. Risk-attitude Sensive Availability Managment The second experiment deals with risk attitude policies, to validate that it is possible to optimize the availability management according to customers’ preference structure/risk attitudes. Here we consider availability management for the two-tier airline revenue application, with each tier of the application having one component (see the third application in Figure 5), for three different customers (Table 1 and Table 2). To illustrate the results, the configurations for each component are limited to 1) No standby, 2) Active, 3) Passive 3Min, 4) Passive 5Min, 5) Passive 15Min, and 6) Passive 30Min, resulting in a total of 36 possible configurations for the two-tier application. As discussed in the Section IV, the three customers C1, C2, and C3 have different risk attitudes which are characterized by the CRRA vNM utility functions.
7
Results obtained by using different CRRA vNM utility functions for these three customers, and additional results using risk-neutral and risk-seeking vNM utility functions are given in Table 3. In this table, the first row is the value α . The first column is the utilities under five representative configurations. “A-A” means to allocate active standby for both components, and “P-P 3” means to allocate passive standby for both components, with checkpointing interval chosen to be 3Mins. The configuration with higher vNM utility better matches customer’s risk attitude. This means that the only thing that matters is the ordering vNM utility. For ease of comprehension, we convert the results from Table 3 to normalized vNM utility 700 Utility 600
700 Utility 600
500
500
400
400
300
300
200
200
100 0 0
Time(Mins) 10
20
100 0 0
(a) Utility with Failure
Time(Mins) 10
20
(b) Utility without Failure
435
VI.
RELATED WORK
IT service management driven by business policies is a relatively new area. Buco et al. present SLA management system that is based on business-objectives [18]. Salle et al. propose a solution to minimize the exposed business impact of service level violation [19]. They further present the Management by Business Objective (MBO) technology for IT management that can take into account strategic business objectives [20] and they specifically apply this approach to incident management domain [21]. In the context of design, Sahai et al. propose a policy-based model for automated configuration management [22]. It automatically creates a suitable configuration and a workflow to deploy the configuration based on user requirements, operator constraints, and technical constraints of the system. Their businessobjectives-driven performance management uses utility function to optimize resource allocation and maximize the total utility. Compared to these efforts, our work focuses on the optimization of availability management to meet business objectives. Our solution involves the aspect of utility function, performance modeling, and availability modeling. In addition, availability management always involves uncertainty. In this 700 Utility 600
700 Utility
425
500
500
420
400
400
300
300
200
200
430
Expected Utility
415 A
Automated P N O (c) Expected Utility
Figure 7. Utility during Patching Component C1,2,2 (orders of vNM utility) as shown in Figure 9. Experiment results show that the availability management is optimized according to the user’s risk attitudes (preference structures). For example, for Customer 1, we use CRRA utility function with α =0.001, and active standbys are chosen for the two components in the server. Intuitively this is true, as customer C1 is very risk averse and availability configuration A-A is the most conservative one. More accurately, the actual performance and availability of the application using this configuration is (54.9%, 99.995%), which is very close to the top choice of customer C1 (L1 in Table 1). Similarly, the performance and availability achieved for customer C2 and C3 are (92.5%, 99.7%) and (97.5%, 98.3%), which are also very close to their top preference, L2 and L3 respectively. Another important observation is that different risk attitudes (different values of alpha for CRRA vNM utility function) result in entirely different configurations. Therefore, it is important to consider the users’ risk attitude when managing availability. Existing policy-based methods only optimize expected utility, which is actually one special case in our framework. By optimizing the expected utility, we are actually treating all users as risk-neutral ( α =1). The reality is however, most users are risk-averse (including customer C2 in our example who only requires one nine to two nines availability and ‘seems’ risk-seeking). If we simply optimize the expected utility, the resulted configuration could be significantly different from what the user actually expected.
600
100 0 0
Time(Mins) 10
100
20
(a) Utility with Failure
0 0
Time(Mins) 10
20
(b) Utility without Failure
400 Expected Utility
300 200 100 0 A
P N Automated O (c) Expected Utility
Figure 8. Utility during Reconfiguration of Component C1,1,1 paper, we provide a method to deal with users’ risk attitudes and handle different tradeoff between performance and reliability. To improve availability, fault tolerance techniques are widely used in systems such as Fault-Tolerant CORBA [23, 24], and Arjuna [25]. These systems replicate selected application/service objects and provide specifications to allocate standbys for fast recovery. Multiple replicas allow an object to continue to provide service even when one of its replicas fails. Passive replication is used to record both the state of the currently executing member (primary member) and the entire sequence of method invocations. Recent systems including Borealis [26] and SMILE [27] focus on faulttolerance for applications that process data streams, instead of 8
server/client model. The former uses replication-based failure recovery, and the authors propose to trade consistency for recovery time. The latter proposes the soft-checkpointing mechanism that can be used to implement a low-overhead passive replication scheme for fault tolerance. Table 3 vNM utility of five representative configurations
α
0.001
0.03
0.5
1
3
10
1000.1
33.4
2.09
1.10
0.44
0.25
P-P 3
997.2
33.8
2.71
1.85
2.09
46.58
P-P 15
983.6
33.4
2.74
1.92
2.42
77.74
N-P 15
933.3
32.1
2.66
1.88
2.47
91.45
N-N
902.8
30.7
2.55
1.80
2.39
91.89
Config.
A-A
6
Order of vNM Utility A-A
5
P-P 3
4
P-P 15
3
N-P 15
2
N-N
1 0 0.001
0.03
0.37
1
3
10 alpha
Figure 9. Normalized vNM utility of Five Representative Configurations Performability is another important research area dealing with the tradeoffs of performance and availability. Plank et al. study the performability problem in the scientific domain [28], and Tai et al. study performability in database systems [29]. However, it is not yet clear how to manage availability of a complicated enterprise IT system, such as the utility data center [4], or the IT backbones such as Delta airline Operational Information Systems (OIS) [6], where multiple services in the shared environment have different business objectives and policies, which even change over time, in addition to the changing run-time availability of resources and resource demands. Work by Janakiraman et al. [12] and by Cai et al. [9] are most closely related to our work. Janakiraman et al. investigate automated availability design [12]. In comparison, our work focuses on run-time management of system availability. Per-component performability management for operational information systems is proposed by Cai et al. [9], which use failure prediction for proactive availability management. This paper focuses on the performability of the entire enterprise system, and it explores more complex performability policies, including policies that capture risk attitudes. Such policies specify the risk attitude of the service or customer, under uncertainty [8]. We provide a von Neumann-Morgenstern utility theory-based approach deployed in a policy-based availability management framework. Two different methodologies for performance analysis of Internet applications have been proposed [30]. The model-
based approach uses analytical models such as queuingtheoretic network models to estimate how performance is affected by different workloads, resource allocations, and system configurations. Many such models concern single-tier Internet applications, e.g., single-tier web servers [31, 32, 33, 34, 35]. A few recent efforts have extended single-tier models to multi-tier applications [36, 37, 38]. An alternative, modelfree approach uses reinforcement learning to directly learn the relationship between performance and system configuration [11, 39]. Our work is complementary to these efforts. That is, any mechanisms that can help determine the performance (e.g., response time) of applications can be incorporated into our availability management solution. The specific performance model used in this paper is based on the model presented by Urgaonkar et al. [36]. The result is that performance modeling is secondary to our work, our primary focus being availability management. Other research has made performance its primary objective, addressing topics that include capacity provisioning, application configuration, bottleneck identification, and admission control [11, 36, 37, 38]. VII. LESSONS LEARNED 1) Current policy specification standards, such as WSAgreement, are relatively simple and SLAs are not sufficiently rich to capture the different functional and expression-based formulations needed in modern service-based applications and systems. For example, WS-Agreement can be used to express different valuations for configurations, however, only with discrete attributes. It lacks formal semantics to express preferences for a variety of performance metrics, availability, security, and any other service attributes of interest in terms of utility functions. Risk attitudes have not been studied in current SLA policy specification. 2) The business objectives or policies may involve performance, availability, security and other aspects defined as traditional SLA or complex utility functions. Systems and IT services themselves are complicated, too. Automated IT management solution should support multiple classes of enterprise applications, and different utility formulations used in such applications. The key to success are accurate system models and optimization algorithms. 3) Availability management involves uncertainty and the decision making under uncertainty often involves decision maker’s risk attitude. Utility theory is a useful tool to deal with risk-sensitive policies in IT management, but its applicability in real systems still needs further study. For example, it is still not clear how to derive users’ risk attitude from high level policies. VIII.
CONCLUSIONS AND FUTURE WORK
This paper presents an approach to automate availability of management in IT systems driven by business policy. We implement a policy engine that dynamically optimizes expected utility according to high level availability and performance objectives. We further study how to apply utility theory such as von Neumann-Morgenstern utility function to deal with users' risk attitude and preference and enable users to customize their availability to the risks tolerable by business objectives. The initial evaluation of the proposed solution 9
demonstrates that our approach is applicable for availability management of complex IT environments. Future work includes the evaluation of our approach on real applications and deal with heterogeneous risk attitude and multi-objective preferences. We also plan to investigate proactive availability management in this frame work. ACKNOWLEDGMENT We would like to thank Claudio Bartolini, John Wilkes, Keith Farkas, Subu Iyer and Akhil Sahai for valuable comments. Their help substantially improved the content and presentation of the paper. REFERENCES [1] [2]
[3]
[4]
[5]
[6]
[7]
[8]
[9]
[10] [11]
[12] [13]
[14] [15] [16] [17]
Razinkov, A. Sela, S. Wasserkrug, “Autonomic Self-Optimization according to Business Objectives”. In Proc. of IEEE ICAC, 2004. James Frey, Todd Tannenbaum, Miron Livny, Ian Foster, and Steven Tuecke, “Condor-G: A Computation Management Agent for MultiInstitutional Grids”, In Proc. of IEEE HPDC, 2001 Vanish Talwar, Qinyi. Wu, Calton Pu, Wenchang Yan, Gueyoung Jung, and Dejan Milojicic, “Comparison of Approaches to Service Deployment”, In Proc. of IEEE ICDCS 2005. S. Graupner, J. Pruyne, and S. Singhal, “Making the Utility Data Center A Power Station for the Enterprise Grid”, HP Labs. Technical Report HPL-2003-53, 2003. Joseph Kopena, Evan Sultanik, Gaurav Naik, Iris Howley, Maxim Peysakhov, Vincent A. Cicirello, Moshe Kam, and William Regli, “Service-Based Computing on Manets: Enabling Dynamic Interoperability of First Responders”, In Proc. of IEEE Intelligent Systems, 2005. Ada Gavrilovska, Karsten Schwan and Van Oleson, “A Practical Approach for Zero' Downtime in an Operational Information System, In Proc. of IEEE ICDCS, 2002. Vanish Talwar, Qinyi. Wu, Calton Pu, Wenchang Yan, Gueyoung Jung, and Dejan Milojicic, “Comparison of Approaches to Service Deployment”, In Proc. of IEEE ICDCS 2005. Jeff Kephart and Steve White, “A research agenda for business-driven information technology”, In Proc. of the First Workshop on Hot Topics in Autonomic Computing, 2006. Z. Cai, V. Kumar, B. F. Cooper, G. Eisenhauer, K. Schwan and R. E. Strom. “Utility-Driven Proactive Management of Availability in Enterprise-Scale Information Flows". In Proc. of ACM Middleware 2006. Bianca Schroeder, Adam Wierman, and Mor Harchol-Balter, “Open Versus Closed: A Cautionary Tale”, In Proc. of USENIX NSDI 2006. D. Vengerov, and N. Iakovlev. “A Reinforcement Learning Framework for Dynamic Resource Allocation: First Results,” In Proc. of the IEEE ICAC, 2005. G. Janakiraman, Jose Renato Santos and Yoshio Turner, “Automated System Design for Availability”, In Proc. of IEEE/IFIP DSN, 2004. Soila M. Pertet and Priya Narasimhan, “Causes of Failure in Web Applications”, PDL Technical Report PDL-CMU-05-109, Carnegie Mellon University, 2005. Michael Friedman, Phuong Tran, Peter Goddard, “Reliability of Software Intensive systems”, Noyes Data Corporation. Cristiana Amza et al., “Bottleneck Characterization of Dynamic Web Site Benchmarks”, Rice University Technical Report TR02-388, 2002. J. von Neumann, and O. Morgenstern. Theory of Games and Economic Be-havior . Princeton University Press, 1944. Wensong Zhang and Wenzhuo Zhang, “Linux Virtual Server Clusters: Build highly-scalable and highly-available network services at low cost”, LinuxMagazine, Nov., 2003
[18] M. Buco et al., “Managing of eBusiness on Demand SLA Contracts in Business Terms Using the Cross-SLA Execution Manager SAM”, In Proc. of IEEE ISADS, 2003. [19] M. Salle and C. Bartolini, “Management by Contract”, In Proc. of IEEE/IFIP NOMS 2004. [20] M. Salle, A. Sahai, C. Bartolini and S. Singhal, “A Business-Driven Approach to Closed-loop Management”, HP Labs Technical Reports, HPL-2004-205, 2004. [21] C. Bartolini and M. Salle, “Business Driven Prioritization of Service Incidents”, In Proc. of IFIP/IEEEDSOM 2004. [22] A. Sahai, S. Singhal, V. Machiraju and R. Joshi, “Automated Generation of Resource Configurations through Policies”, In Proc. of the Fifth IEEE International Workshop on Policies for Distributed Systems and Networks (POLICY'04), 2004. [23] Object Management Group, “Final Adopted Specification for Fault Tolerant CORBA”, OMG Technical Committee Document ptc/00-04-04, 2000. [24] A. Moorsel and S. Yajnik, “Design of a Resource Manager for FaultTolerant CORBA”, In Proc. of the Workshop on Reliable Middleware, 1999. [25] Graham Parrington, Santosh Shrivastava, Stuart Wheater and Mark Little, “The Design and Implementation of Arjuna”, In Proc. of USENIX Computing Systems, 1995. [26] Magdalena Balazinska, Hari Balakrishnan, Samuel Madden and Michael Stonebraker, “Fault-tolerance in the Borealis distributed stream processing system”, In Proc. of the ACM SIGMOD International Conference on Management of Data, 2005. [27] Robert E. Strom, “Fault-Tolerance in the SMILE Stateful PublishSubscribe System”, In Proc. of the Int'l Workshop on Distributed EventBased Systems, 2004. [28] James S. Plank and Wael R. Elwasif, “Experimental Assessment of Workstation Failures and Their Impact on Checkpointing Systems”, In Proc. of IEEE International Symposium on Fault-tolerant Computing, 1998. [29] Ann T. Tai and John F. Meyer, “Performability Management in Distributed Database Systems: An Adaptive Concurrency Control Protocol”, In Proc. of the IEEE International Workshop on Modeling, Analysis, and Simulation of Computer and Telecommunications Systems(MASCOTS), 1996. [30] R. Das, G. Tesauro, and W. E. Walsh. “Model-based and Model-free Approaches to Autonomic Resource Allocation”. IBM Ressearch Report, RC 23802, November, 2005. [31] A. Chandra, W. Gong, and P. Shenoy. “Dynamic Resource Allocation for Shared Data Centers Using Online Measurements”. In Proc. of International Workshop on Quality of Service (IWQoS 2003), June 2003. [32] R. Doyle, J. Chase, O. Asad, W. Jin, and A. Vahdat. “Model-Based Resource Provisioning in a Web Service Utility”. In Proc. of the 4th USENIX USITS, Mar. 2003. [33] R. Levy, J. Nagarajarao, G. Pacifici, M. Spreitzer, A. Tantawi, and A. Youssef. “Performance Management for Cluster Based Web Services”. In Proc. of IFIP/IEEE Eighth International Symposium on Integrated Network Management, 2003. [34] L. Slothouber. “A Model of Web Server Performance”. In Proc. of International World Wide Web Conference, 1996. [35] B. Urgaonkar and P. Shenoy. Cataclysm. “Handling Extreme Overloads in Internet Services”. In Proc. of ACM SIGACT-SIGOPS Symposium on Principles of Distributed Computing (PODC), July 2004. [36] B. Urgaonkar, P. Shenoy, A. Chandra, and OP. Goyal. “Dynamic Provisioning of Multi-tier Internet Applications”. In Proc. of IEEE ICAC, June 2005. [37] B. Urgaonkar, G. Pacifici, P. Shenoy, M. Spreitzer, and A. Tantawi “An Analytical Model for Multi-tier Internet Services and its Applications”. In Proc. of ACM SIGMETRICS, June 2005. [38] C. Stewart, and K. Shen. “Performance modleing and system management for multi-component online services”. In Proc. of USENIX NSDI, 2005.
10