Automated creation of transparent fuzzy models based on decision trees – application to diabetes diagnosis Markos G. Tsipouras, Student Member, IEEE, Themis P. Exarchos, Student Member, IEEE, and Dimitrios I. Fotiadis, Senior Member, IEEE
Abstract— In this paper we propose a novel approach for the simplification of a fuzzy model. Initially, we employ a methodology for the automated generation of fuzzy models based on decision trees. The methodology is realized in three stages. Initially, a crisp model is created from a decision tree, induced from the data. Then, the crisp model it is transformed to a fuzzy one. Finally, in the third stage, all parameters entering the fuzzy model are optimized. The simplification technique is based on the pruning of the initial decision tree. The proposed approach is applied for diabetes diagnosis and the obtained results indicate its efficiency and effectiveness.
F
I. INTRODUCTION
uzzy logic is the extension of the classical crisp (binary) logic into a multivariate form. Fuzzy logic is closer to the human logic, thus being able to deal with real world noisy and imprecise data [1]. Thus, development of fuzzy models for dealing with real world problems has become a common practice. A fuzzy model can be created by defining an initial crisp model (set of rules) and then fuzzifying it. Crisp models perform a rectangular partitioning of the input space, thus being able to deal with problems that follow this limitation. On the other hand, fuzzy models generate non-axis parallel decision boundaries [2], thus being able to cope with real world complex problems. A known approach in this context is the use of decision trees for the crisp model definition. In this case, a decision-tree induction technique is applied to the data, resulting to the decision tree. Several fuzzy model generation techniques based on decision trees have been proposed in the literature, which can be divided in three main categories: (i) induction of a crisp decision tree from the data and then its fuzzyfication, resulting into a fuzzy decision tree [3-6], (ii) induction of a fuzzy decision tree, integrating fuzzy techniques during the tree construction [7,8] and (iii) induction of a crisp decision tree, extraction of a set of rules from it and, subsequently, fuzzification of these
Manuscript received April 7, 2008. This research is funded by the European Commission under the program "METABO" (Controlling Chronic Diseases related to Metabolic Disorders, ICT 216270). M. G. Tsipouras is with the Unit of Medical Technology and Intelligent Information Systems, Dept. of Computer Science, University of Ioannina, Ioannina, Greece, GR 45110 (e-mail:
[email protected] ). T. P. Exarchos is with the Unit of Medical Technology and Intelligent Information Systems, Dept. of Computer Science, University of Ioannina, Ioannina, Greece, GR 45110. (e-mail:
[email protected] ). D. I. Fotiadis is the director of the Unit of Medical Technology and Intelligent Information Systems, Dept. of Computer Science, University of Ioannina, Ioannina, Greece, GR 45110 (+30-26510-98803; fax: +30-2651097092; e-mail:
[email protected] ).
rules [2]. Fuzzy models are, to some extent, transparent to interpretation and analysis. However, the transparency of a fuzzy model cannot be achieved automatically, especially in the case of automated data-driven fuzzy modeling techniques. This is because when automated data-driven techniques are applied to build fuzzy models from data, a certain degree of redundancy and thus complexity, is imposed to the generated fuzzy model [9]. Several methods have been proposed for the simplification of the fuzzy model, mainly focusing on the reduction of the fuzzy rules, based on similarity measures [10,11] or genetic algorithms [2,5]. Diabetes is a chronic metabolic disturbance characterized by increased blood glucose concentrations and decreased insulin secretion and/or action [12]. Presence of diabetes increases 2-4 times the risk for cardiovascular diseases (both in men and women) and is associated with long term chronic complications leading to blindness, renal failure (first cause of dialysis worldwide), and foot ulceration with risk of limb amputation. The International Diabetes Federation reports that mortality rates in patients with diabetes mellitus are higher than those in the general population and life expectancy in both type 1 and type 2 diabetes are reduced by 25% [13]. The number of deaths related to the disease has been estimated at 800,000 per year, worldwide, but the real figure is thought to be more in the region of 4 million per year. In this work, we propose a methodology for the automated fuzzy model generation and we apply it to the automated diabetes diagnosis. The methodology includes four stages. In the first stage, the C4.5 tree induction algorithm is applied to the data in order to generate a decision tree, which is then transformed into the equivalent set of rules (stage 2). Subsequently, in the third stage, this set of rules is transformed into the respective fuzzy model. During this transformation several new parameters are introduced, corresponding to the fuzzification of the decision boundaries; these parameters are optimized in the fourth stage, using an optimization technique. Additionally, a technique for the simplification of the produced fuzzy model is proposed, based on the pruning of the generated decision tree. The methodology is evaluated using the pima diabetes dataset from the UCI machine learning repository [14].
(
A. Decision tree induction The construction of the decision tree is implemented using the C4.5 inductive algorithm [15], which generates a decision tree from the training data that minimizes the expected value of the number of tests for data classification. Each internal node of the tree corresponds to a principal component, while each outgoing branch corresponds to a possible range of that component. The leaf nodes represent the class to be assigned to a sample. During the induction of the decision tree, a prepruning method is employed by setting a minimum threshold ( M ) to the number of instances at a node, in order for this node to be further split. Additionally, post-pruning is performed by replacing a subtree with a new leaf node whose class label is determined from the majority class of records associated with the subtree (subtree replacement). The subtree replacement was performed by calculating the pessimistic error, setting the confidence factor to 0.25. B. Crisp model creation The produced tree can be easily transformed into a set of rules. This is realized by parsing the tree from the root node to a leaf. In this way a crisp rule ric, j x,θic, j is created, where
(
)
x = a1 , a2 ,..., an f is a prototype, am are its features and n f
is the number of features. Thus, the number of crisp rules corresponds to the number of leafs. The feature tests encountered along the path form the condition of the rule:
(
gc ai, j ,1 ,θ ic, j ,1
)∧ (
gc ai , j ,2 , θ ic, j ,2
) ∧ ... ∧ g ( a c
i , j , Ki , j
, θic, j , Ki , j
),
ai , j ,1 ,ai , j ,2 ,...,ai , j ,Ki , j , are the features that are
where
encountered in the path and θic, j ,1 ,θi,c j ,2 ,...,θi,c j ,Ki , j are the respective parameters. The definition is based on g c ( ⋅ ) , which is the threshold function, defined as decreasing or increasing based on the comparison operator on the decision tree, ≤ or > , respectively. Each of the ai , j ,k can be any of the features since during the tree generation any of the features can be used to split a node. The class label at the leaf node is assigned to the rule consequent:
(
)
ric, j x, θic, j → yi ,
(1)
with i = 1,...,I , j = 1,..., J i and k = 1,...,Ki , j , while I is the
number of classes, J i is the number of conditions that predict the i th class and Ki , j is the number of conjuncts of the
j th
condition that predicts the i th
θic, j
{
}
=
θic, j , k
class. Also,
with k = 1,...,Ki , j . Based on the above, the
crisp model M c is defined as:
)
M c ( x, Θ c ) = F c ri c, j ( x,θ ic, j ) ,
II. MATERIALS AND METHODS
(2)
where Θc = {θi,c j } with i = 1,...,I and j = 1,..., J i . F c is a function that defines the predicted class. Since the rules are exhaustive and mutually exclusive [15], F c identifies the one and only one crisp rule that is true (i.e. having resulted to 1) and sets the predicted class as the class proposed from this rule. C. Fuzzy model definition
The crisp model ( M c ) is transformed into a fuzzy model ( M f ) using the sigmoid function instead of the threshold function, the min and max operators [16] instead of the binary AND and OR operators, respectively, and the maximum operator [16] as a defuzzification function (replacing the F c function). The sigmoid function is defined as: g f ( a,θ f ) = 1 + e
(
θ1 , f a − θ 2 , f
−1
) ,
(3)
where θ f is a vector containing all parameters used in the
(
)
sigmoid function θ f = {θ 1, f ,θ 2 , f } . Thus, each fuzzy rule is defined as:
(
)
Ki , j
( (
ri ,f j x, θi ,f j = min g f ai , j , k , θi ,f j , k k =1
{
where θi ,f j = θi,f j ,k
}
)) ,
(4)
with k = 1,...,Ki , j . Finally, the fuzzy
model is defined as: I ,J i
(
)
M f ( x, Θ f ) = max ri ,fj ( x,θ if, j ) , i =1 , j =1
(5)
where Θ f = {θ1f ,θ2f ,...,θ If } with i = 1,...,I and j = 1,..., J i . Thus, M f ( x, Θ f
I ,J i
Ki , j
) = max min 1 + e
(
θi1,j, f,k ai , j ,k − θi2, ,j f,k
−1 ) , which
k =1 denotes the implicit input-output formula of the fuzzy model. i =1, j =1
D. Fuzzy model’s parameters optimization
The fuzzy model M
f
( x,Θ ) f
is optimized with respect to
f
its parameters Θ , using a training dataset ( Dtrain ). For this purpose, a cost function is used, defined as: F ( Θ f ,Dtrain ) = trace ( X ) Dtrain ,
(6)
where X is the confusion matrix which is based on the fuzzy model and Dtrain is the size (number of patterns)
TABLE I RESULTS
included in the Dtrain . A local optimization technique, the Nelder-Mead simplex search method [17], has been employed. Nelder-Mead simplex search method is an unconstrained nonlinear local optimization technique, which attempts to find a minimum of a scalar function of several variables, starting from an initial estimate (initial point). The method does not use numerical or analytical computation of the gradient. The initial point was defined setting θi2, ,j f,k = θic, j ,k ( θic, j ,k are defined from the decision tree) and θi1,,jf,k ∼ N ( 5,1) or θi1,,jf,k ∼ − N ( 5,1) , if the threshold function decreases or increases, respectively. The result of the optimization procedure is the optimized fuzzy model, containing optimal values for its parameters M f ( x, Θ f * ) .
E. Fuzzy model simplification We propose and evaluate a method for simplification of the fuzzy model based on the decision tree pruning. The main idea is that, in the case of non axis-parallel decision boundaries the decision tree produces an aliasing effect on the decision boundary; the bigger the size of the decision tree is the denser this phenomenon appears. By pruning the decision tree, the aliasing phenomenon remains however is sparser. The rational of the simplification technique is that in an oblique case, the fuzzy model will be able to adapt to the non axis-parallel decision boundaries regardless the number of crisp rules producing the aliasing. The reduction of the decision tree is based on the minimum threshold ( M ) used in the prepruning. The M is set as a percentage of the total number of instances included in the dataset. F. Dataset The Pima Indians diabetes dataset was used in this study, which is obtained from the UCI machine learning repository [14]. The dataset consists of 768 instances each of them consisting from 8 features ( x = a1 , a2 ,..., a8 , n f = 8) , such as
age, body mass index, diastolic blood pressure, glucose concentration, etc. The dataset is created from female patients of Pima Indian heritage which were are at least 21 years old. Each instance is annotated as normal ( y = 0 ) or tested positive for diabetes ( y = 1 ).
Decision tree accuracy (%)
M
Optimized fuzzy model accuracy (%)
8
73.74±1.49
75.38±5.1
12.4
15
73.21±1.57
75.13±4.9
11.7
23
73.6±1.19
75.13±3.49
8.8
31
74.18±1.19
74.09±4.11
7.7
38
74.38±1.23
74.87±4.89
6.9
46
74.54±0.61
74.86±4.77
5.8
54
74.61±0.61
75.91±3.18
4.2
61
74.25±0.44
75±3.03
3.7
69
73.89±0.95
75.39±2.62
4
77
73.29±1.03
74.74±4.51
3.6
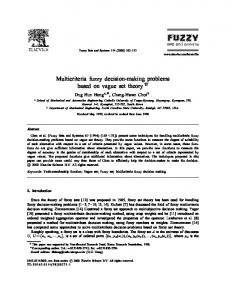
The decision tree accuracy is the average accuracy of the ten decision trees (one for each fold). The same applies to the accuracy of the optimized fuzzy model. The complexity is defined as the number of rules in the fuzzy model (again average of the ten fuzzy models, one for each fold). The results of the Table I are presented graphically in Figure 1. Additionally, we have compared the results obtained by our methodology with the results obtained by five widely used classification methodologies: decision trees (used as the first stage of the proposed methodology), k nearestneighbors (k-NN), multilayer perceptron (MLP) neural networks, radial basis functions (RBF) neural networks and support vector machines (SVM). The MLP architecture was implemented with the number of hidden layers set to 1 and
(
the number of hidden neurons set as n f + I
2 = 5 , while
4.2
75.5 12.4
4 11.7
Accuracy (%)
The above described methodology and the simplification technique were applied to the dataset using different values for the M parameter. Specifically, ten different values were used, ranging from 1% to 10% of the total number of instances (i.e. M = 8, 15, 23, 31, 38, 46, 54, 61, 69 or 77 instances). For each of them, the ten fold stratified cross validation method [18], was used, thus ten different decision trees, crisp models and fuzzy models are created. The results are presented in Table I.
)
the learning rate was set to 0.3, the momentum to 0.2 and the number of epochs to 500. RBF were implemented using the K-Means clustering algorithm to provide the basis functions and then by learning a logistic regression function. Finally, SVM were implemented using RBF kernel. Grid search was employed to identify the optimal values for the c and gamma parameters. Again, the ten fold stratified cross validation method is employed.
8.8 3.7
75
III. RESULTS
Complexity
6.9
5.8 3.6
74.5
7.7
74
73.5
10
20
30
40
50
M
60
70
Fig. 1. Minimum threshold value (M) vs accuracy (average of ten folds) for the decision tree (dashed line) and the fuzzy model (solid line). The complexity values are included for the fuzzy model, for each M value.
TABLE II COMPARATIVE STUDY RESULTS classifier
accuracy (%)
standard deviation
Decision tree
74.61
0.61
k-NN
72.65
5.14
MLP
75.4
4.66
RBF
75.4
4.36
SVM
76.17
5.19
our method (M=54)
75.91
3.18
thus less transparent, than the one generated from the proposed methodology. A limitation of the proposed simplification technique is that the value of M parameter is defined heuristically. The technique will be more compact if an automated method for the definition of the parameter M value is included. The formulation of the problem allows a line-search procedure to be employed for this purpose. However, this issue will be addressed in future a communication. REFERENCES [1]
IV. DISCUSSION & CONCLUSIONS In this paper we use a methodology for the automated generation of fuzzy models, and then we apply a novel approach for the simplification of the generated fuzzy model. Based on the above, we address the diabetes diagnosis problem with high accuracy (75.91%). The results presented in Fig. 1 indicate that the generated fuzzy models are superior from the crisp models. Additionally, the simplification technique reduces the number of rules (average for ten folds) from 12.4 to 3.6, while the best results are obtained using 4.2 on average (M=54), thus providing a simple solution, which is more easily interpretable, and more transparent. A comparative study of our methodology with five widely used classification methodologies has been conducted. The proposed methodology presented 75.91% classification accuracy, while only SVMs presented higher classification accuracy (76.17%). However, both SVMs and MLPs are considered as “black box” approaches, thus lacking the interpretation ability. In addition, the fuzzy model is much simpler than any other approach (having only 4.2 fuzzy rules). Table III presents a comparison of the results obtained by similar approaches presented in the literature addressing the problem of diabetes diagnosis. The best classification accuracy is obtained by Crockett et al. [6], being 78.5%, while our approach presented the second best result. The work of Abonyi et al. [2] also applies a simplification technique based on genetic algorithms. As reported into [2], the fuzzy model includes 11.2 fuzzy rules (average from five folds) and the obtained classification accuracy is 73.05%, while the proposed method achieves 75.91% classification accuracy with 4.2 fuzzy rules (average from ten folds). The works of Suarez et al. [3], Crockett et al. [6] and Olaru et al. [4] do not address the issue of fuzzy model simplification and the proposed fuzzy models are more complicated, and TABLE III COMPARATIVE STUDY RESULTS FOR THE PIMA D IABETES DATASET classifier
accuracy (%)
Suarez et al. [3]
74.8
Abonyi et al. [2]
73.05
Crockett et al. [6]
78.5
Olaru et al. [4]
74.43
this work
75.91
[2]
[3] [4] [5] [6] [7] [8] [9] [10] [11] [12] [13] [14] [15]
[16] [17] [18] [19]
L.H. Tsoukalas, R.E. Uhrig, Fuzzy and neural approaches in engineering, John Wiley & Sons, 1997. J. Abonyi, H. Roubos, F. Szeifert, Data-Driven Generation of Compact, Accurate, and Linguistically Sound Fuzzy Classifiers Based on a Decision Tree Initialization, International Journal of Approximate Reasoning (2003) 1-21. A. Suarez, F. Lutsko, Globally optimal fuzzy decision trees for classification and regression, IEEE Transactions on Pattern Analysis and Machine Intelligence 21(12) (1999) 1297-1311. C. Olaru, L. Wehenkel, A complete fuzzy decision tree technique, Fuzzy sets and systems 138 (2003) 221–254. W. Pedrycz, Z.A. Sosnowski, Genetically Optimized Fuzzy Decision Trees, IEEE Trans. Systems, Man Cybernetics – part B, 35 (2005) 633-641. K. Crockett, Z. Bandar, J. O’Shea, D. Mclean, On Constructing a Fuzzy Inference Framework using Crisp Decision Trees, Fuzzy Sets and Systems 157 (2006) 2809–2832. C.Z. Janikow, Fuzzy decision trees: issues and methods, IEEE Trans. Systems Man and Cybernet. 28(1) (1998) 1–14. X. Wang, B. Chen, G. Qian, F. Ye, On the optimization of fuzzy decision trees, Fuzzy Sets and Systems 112 (2000) 117-125. A.K. Palit, D. Popovic, Computational Intelligence in Time Series Forecasting. Springer, 2005. M. Setnes, R. Babuska, H.B. Verbruggen, Transparent fuzzy modelling, Int. J. Human-Computer Studies 49 (1998) 159-179. M. Setnes, R. Babuska, Rule base reduction: Some comments on the use of orthogonal transforms, IEEE Trans. Systems Man and Cybernet.-Part C: Appl. and Rev. 31(2) (2001) 199–206. PE Cryer: Hypoglycemia. Pathophysiology, Diagnosis and Treatment. New York, Oxford Univ. Press, 1997 Diabetes. The Policy Puzzle: Towards Benchmarking in the EU 25 http://www.idf.org/webdata/docs/idf-europe/DiabetesReport2005.pdf diabetes A. Asuncion, D.J. Newman. UCI Machine Learning Repository [http://www.ics.uci.edu/~mlearn/MLRepository.html]. Irvine, CA: University of California, Department of Information and Computer Science, 2007. J.R. Quinlan. C4.5: Programs for Machine Learning. California, Morgan Kauffman, 1993. L.X. Wang, A course in fuzzy systems and control, Upper Saddle River NJ, Prentice Hall PTR, 1997. J.C. Lagarias, J. A. Reeds, M. H. Wright, P. E. Wright, Convergence Properties of the Nelder-Mead Simplex Method in Low Dimensions, SIAM Journal of Optimization, 9(1) (1998) 112-147. R. Kohavi. A study of cross-validation and bootstrap for accuracy estimation and model selection, 14th International Joint Conference on Artificial Intelligence, San Mateo, CA: Morgan Kaufmann, (1995) 1137 – 1143.