Feb 24, 2004 - signature recognition on IMAGE/RPI plasmagrams, Radio Sci., 39, RS1015, ..... of electron density profiles from digital ionograms: 1. Auto-.
RADIO SCIENCE, VOL. 39, RS1015, doi:10.1029/2003RS002921, 2004
Automated diagnostics for resonance signature recognition on IMAGE//RPI plasmagrams Ivan A. Galkin, Bodo W. Reinisch, and Xueqin Huang Center for Atmospheric Research, University of Massachusetts, Lowell, Massachusetts, USA
Robert F. Benson Laboratory for Extraterrestrial Physics, NASA Goddard Space Flight Center, Greenbelt, Maryland, USA
Shing F. Fung Space Physics Data Facility, NASA Goddard Space Flight Center, Greenbelt, Maryland, USA
Received 6 June 2003; revised 25 November 2003; accepted 17 December 2003; published 24 February 2004.
[1] The Radio Plasma Imager (RPI) aboard the IMAGE spacecraft probes plasma at both
far and near ranges by means of radio sounding. The RPI plasmagrams, similar in their concept to the ground-based and topside ionograms, contain not only a variety of signatures pertaining to the remote plasma structures and boundaries, but also a suite of the local plasma resonances stimulated by the RPI radio transmissions. Detection and interpretation of the resonance signatures is a valuable diagnostic tool providing the actual electron density and magnetic field strength at the spacecraft location, which are needed for the accurate processing of the remote sensing information on the plasmagrams. The high volume of the RPI sounding data demanded the development of automated techniques for routine interpretation of the plasmagrams. This paper discusses a new method for the detection and interpretation of the resonance signatures in the RPI plasmagrams that employs pattern recognition techniques to localize the signatures and INDEX TERMS: 2494 Ionosphere: identifies them in relation to model-based resonances. Instruments and techniques; 2794 Magnetospheric Physics: Instruments and techniques; 6994 Radio Science: Instruments and techniques; 7819 Space Plasma Physics: Experimental and mathematical techniques; KEYWORDS: intelligent systems, radio sounding, Radio Plasma Imager Citation: Galkin, I. A., B. W. Reinisch, X. Huang, R. F. Benson, and S. F. Fung (2004), Automated diagnostics for resonance signature recognition on IMAGE/RPI plasmagrams, Radio Sci., 39, RS1015, doi:10.1029/2003RS002921.
1. Introduction [2] A radio transmitter immersed in plasma is capable of stimulating short-range plasma-wave echoes and plasma emissions if its sounding frequency matches one of the characteristic frequencies of the plasma, often called resonance frequencies, or simply resonances. Typical resonance signatures have been observed by a number of space missions carrying a topside ionosonde or a relaxation sounder (see, e.g., Muldrew [1972] for a representative review). Detection of stimulated resonances and wave cutoffs in the radio sounding data provides a measurement of local plasma
Copyright 2004 by the American Geophysical Union. 0048-6604/04/2003RS002921$11.00
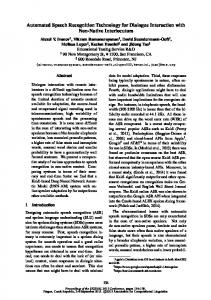
density and magnetic field that has demonstrated accuracy and diagnostic potential superior to what conventional magnetometers and density probes achieve. [3] The Radio Plasma Imager (RPI) [Reinisch et al., 2000] on the IMAGE spacecraft [Burch, 2000] is the first radio sounder ever flown on a highly elliptical orbit into the magnetosphere. It employs the stepped-frequency radio sounding concept that has been successfully practiced for several decades in a variety of applications [e.g., Reinisch, 1996; Pulinets and Benson, 1999]. Figure 1 is the BinBrowser virtual range versus frequency presentation of the received RPI signal amplitudes, called a plasmagram [Reinisch et al., 2000]. The virtual range is simply one half the echo delay time multiplied by the free-space speed of light. The pixel colors in the plasmagram image in Figure 1 represent the logarithmic amplitudes of the signals received on the Z antenna, calculated
RS1015
1 of 11
GALKIN ET AL.: AUTOMATED RPI RESONANCE RECOGNITION
RS1015
RS1015
Figure 1. RPI Plasmagram on 2 March 2002, 04:23 UT with remote echo traces and resonance signatures as indicated. See color version of this figure at back of this issue. from the recorded 12-bit in-phase and quadrature voltage samples. [4] The sample plasmagram in Figure 1 shows two types of signatures: (1) traces, formed by the RPI echoes reflecting from remote locations in the plasma, and (2) resonances, appearing as vertical line segments extending upward from zero virtual range, each corresponding to a particular resonant response of the local plasma to the transmitter pulse. We have identified five major types of resonances in the RPI plasmagrams, all pertaining to oscillations of the plasma electrons. They are observed at the following frequencies: (a) electron cyclotron frequency fce, and its harmonics, n � fce, (b) electron plasma frequency fpe, (c) upper-hybrid frequency fuh, (d) Qn resonances fQn (also known as Bernstein-mode resonances), and (e) Dn resonances fDn. [5] A number of dependencies exist between the plasma resonance frequencies [Stix, 1962]. The upperhybrid frequency, fuh, is given by the plasma and gyro frequencies: fuh ¼
qffiffiffiffiffiffiffiffiffiffiffiffiffiffiffi fpe2 þ fce2
ð1Þ
The Qn resonances can be related to the plasma and gyro frequencies by an approximate expression [Warren and Hagg, 1968]: " # 0:46 fpe2 fQn � fce n þ 2 2 ; ð2Þ n fce
which is a good approximation when fQn/fce is near integer values. Benson et al. [2001] provided curves for fQn/fce based on electrostatic dispersion equation solutions for zero-group velocity plasma waves perpendicular to the magnetic field. Finally, the sequence of Dn resonances is described by the following expressions [Osherovich and Benson, 1991]: fDn ¼ 0:95
pffiffiffiffiffiffiffiffipffiffiffi fp fce n
þ fDn ¼
pffiffiffiffiffiffiffiffiffiffiffiffiffiffiffiffi 2 þf2 fDn ce
� ¼ fDn
pffiffiffiffiffiffiffiffiffiffiffiffiffiffiffiffi 2 �f2 fDn ce
ð3Þ
Equations (1) – (3) can be used to build a composite model of the resonance signatures driven only by the gyrofrequency fce and the plasma frequency fpe.
2. Review of Previous Automated Resonance Recognition Work [6] Interpretation of the resonance signatures usually requires matching of the observed signatures to model values. This involves a certain amount of simple calculations that are time consuming to carry out manually. Automatic resonance matching algorithms have been developed since the early 1980s, all fitting the resonance model to the data by testing a number of candidate values
2 of 11
RS1015
GALKIN ET AL.: AUTOMATED RPI RESONANCE RECOGNITION
of fce and fpe and selecting the best fit values. Huang and Reinisch [1982] and Huang et al. [2002] developed an automated resonance detection algorithm that is now a part of the TOPIST system for autoscaling topside ionograms from the Alouette and ISIS sounders (http://nssdc.gsfc. nasa.gov/space/isis/isis-status.html). The algorithm seeks the ‘‘best’’ combination of the X-mode cutoff frequency and the gyrofrequency that maximizes the amplitude sum over range bins extending to 500 km on 5 frequencies: (1) O-mode cutoff or local plasma frequency f pe , (2) X-mode cutoff frequency fx, (3) upper hybrid frequency fuh, and (4) and (5) two neighboring gyrofrequency harmonics nfce and (n + 1)fce, selected to be close to the other resonances within the ionogram image. Igi et al. [1982] developed a similar algorithm for the topside sounder on the ISS-B spacecraft using two separate fits, one for the gyrofrequency fce, and another for the triplet fpe, fuh, fx. [7] Trotignon et al. [1986] reported successful algorithmic solutions to the task of extracting resonance signatures from the ISEE-1 relaxation sounder data. The ISEE-1 satellite had a highly elliptic orbit with an apogee of 23 RE (Earth’s radius = 6,375 km) and a perigee of 280 km and therefore observed a wide range of plasma densities in the solar wind, magnetosheath, magnetosphere, and magnetospheric tail. The resonance signatures in the magnetosphere were found to exhibit the greatest variety and present the greatest challenge to automated recognition. As a definite advantage for the automated data analysis, the ISEE-1 had an onboard magnetometer to measure the value of the gyrofrequency with an accuracy of 1%. The magnetometer’s estimate of the gyrofrequency was further improved by fine fitting of the fce harmonics to the sounding data. The candidate plasma frequency values were tested in a separate fit. In contrast to the topside sounders, the best fit was sought for the series of Q-type resonances, fQn, using a weighted sum to favor the lowest orders of fQn. Matching of fQn was found to be critically sensitive to the accuracy of the gyrofrequency determination, with errors of only 0.7% still causing misalignment of the fit. A similar matching concept was used in the resonance interpretation algorithm by Trotignon et al. [2001] for the Whisper relaxation sounder aboard the Cluster-2 spacecraft. An amplitude envelope technique developed by Trotignon et al. [1986] had limited success, producing unacceptably high rates of false resonance recognitions. [8] Considering the results of previous efforts, automated detection and identification of the resonance signatures in the RPI plasmagrams presents a great challenge because of the large range of plasma densities probed by RPI in the magnetosphere and the often less than optimal resolution of the frequency scans. The diversity of the scientific goals that the RPI targets along the orbit often results in a frequency range and resolution unfavorable for automatic detection of the key resonance
RS1015
signatures. Finally, no onboard magnetometer measurements are made to help constrain the fce fitting procedure.
3. A New Fitting Composite Resonance Model [9] Due to the specifics of the RPI plasmagrams, the automated fitting algorithm cannot rely on the guaranteed presence of any particular resonance on the plasmagram. RPI is a versatile instrument that adjusts its sounding frequencies along the spacecraft orbit to match changes in the plasma density and to meet a variety of scientific goals. Due to dynamic allocation of the frequencies from the operating band of 3 kHz to 3 MHz with either constant or logarithmically changing frequency steps ranging in size from 300 Hz to hundreds of kHz, the RPI measurement parameters are often far from optimal to properly study the resonances. Compromises in the operating frequency band and resolution are commonly made to balance requirements for a high sounding cadence and long range coverage. Thus, plasmagrams may contain none of the nfce resonances or more than 20 of them, and the frequency resolution may be fine enough to cover the resonance amplitude peak with several frequency steps, or be as coarse as to completely miss the resonance. The fitting scheme had to be adjusted to work for a varying number of resonances/harmonics that may be present on plasmagrams. The coarse frequency resolution effects were considered by determining whether the tested resonance is too far from the closest plasmagram frequency. As a result, the number of frequencies whose summary amplitudes contribute to the total fit quality becomes different for different sets of the driving fce and fpe. With a varying number of contributors at each fitting step , the fit quality cannot be calculated as the total sum, and therefore the ‘‘average fit’’ was used as the fit quality criterion: X S1RE ð f Þ Qij ¼
f f gij
N
;
ð4Þ
where {f}ij is subset of plasmagram frequencies f corresponding to the model resonance frequencies calculated for the trial gyrofrequency fce(i) and the trial plasma frequency fpe( j), such that each model frequency of the subset falls within the interval of ( f � Dr, f + Dr) of a plasmagram frequency f, where Dr is the half-width of the expected frequency band taken by the resonance signature; N is size of { f }ij; and S1RE ( f ) is summary amplitude calculated over all ranges r < 1 RE at the plasmagram frequency f, i.e., X S1RE ð f Þ ¼ Ar ð f Þ ð5Þ
3 of 11
r