32
IEEE TRANSACTIONS ON AUTOMATION SCIENCE AND ENGINEERING , VOL. 2, NO. 1, JANUARY 2005
Automated Generation of Assembly System-Design Solutions Robert F. Webbink and S. Jack Hu
Abstract—Any assembly system-design problem which consists of generating system configurations and assignment of tasks to the stations has a set of solutions. The number of feasible solutions may be staggering, even for products consisting of a relatively small number of parts assembled on a small number of stations. As the size of the product and the assembly system grow, it may become difficult to develop a complete set of design solutions for in-depth analysis. Here an automated method is described by which the complete sets of system configurations and assembly sequences may be generated, and feasible solutions, consisting of a matched element from each set, can be rapidly derived. These solutions may then be tested for various performance metrics, some of which may not be expressed mathematically. Note to Practitioners—In designing assembly systems, the layout of stations and the assignment of assembly tasks to these stations are important design problems. This paper proposes a set of algorithms to quickly generate the configurations of the assembly system and assign tasks to the configurations. Once the matching of tasks to the configurations is complete, the performance of these various design alternatives, such as productivity, can be evaluated to allow selection of configurations with the best performance. Index Terms—Assembly, configuration, sequence.
I. INTRODUCTION
T
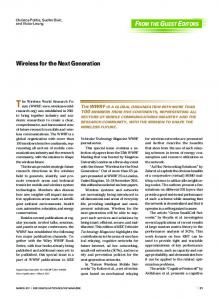
RADITIONALLY, most assembly lines have been entirely serial in nature, particularly in processes where the sequence of the products is of importance. This is particularly common among products such as automobiles, where each individual product is highly customized. A predictable, steady sequence in part numbers is crucial over sections of the line in order to assure that the customized jobs are produced correctly, e.g., that the correct type of engine meets the correct body type of the correct color at the right time. If for any reason, the sequence is disrupted and the wrong part or option is installed in a vehicle, the products may no longer meet the customer’s specifications. This and other factors have historically led to the selection of long serial production lines as the primary type in use. The serial configuration consists of a single line of workstations, with exactly one part flow path through the system [Fig. 1(a)]. Manuscript received October 24, 2002; revised July 14, 2003. This paper was recommended for publication by Associate Editor C. Chu and Editor S. Hutchinson upon evaluation of the reviewers’ comments. This work was supported by the National Science Foundation CAREER Award under Grant 9625200. R. F. Webbink was with the Department of Mechanical Engineering, University of Michigan, Ann Arbor, MI 48109 USA. He is now with Proctor and Gamble, Cincinnati, OH 45202 USA (e-mail:
[email protected]). S. J. Hu is with the Department of Mechanical Engineering, University of Michigan, Ann Arbor, MI 48109 USA (e-mail:
[email protected]). Digital Object Identifier 10.1109/TASE.2004.840072
Fig. 1. Various sample system configurations.
However, recent trends and technological advances have altered this approach. The introduction of resequencing buffers and the use of automated guided vehicles made it possible to rearrange the sequence of the individual assemblies at almost any point in the assembly line. Thus, if one branch of the system fails and goes offline for a certain length of time, the sequence could be restored further down the line to ensure that the parts are still in their expected sequence for later operations. As a result of these developments, system configurations other than serial lines have begun to be implemented. These new configurations include the parallel and hybrid configurations. In the parallel configuration [Fig. 1(b)], each workstation receives unprocessed parts and completes all assembly tasks. Thus, if such a system consists of workstations, it has exactly possible flow paths. The hybrid configurations can be subdivided further into the simple hybrid and complex hybrid classifications. The simplehybrid configurations consist of two types: parallel lines and serial groups. The parallel-lines configuration [Fig. 1(c)] consists of a group of independent serial lines operating in parallel. The serial-groups configuration [Fig. 1(d)] is similar to that of a serial configuration. However, the difference is the implementation of several stations working in parallel in the place of what would be a single station in the serial design. In this case, all the product streams are remixed before being sent to the next position on the overall line. These two simple-hybrid configurations are among the most commonly used alternative configurations in various industries. The last type of configuration is that of the complex-hybrid classification [Fig. 1(e)]. In the simple-hybrid configurations, or in simple blends of the two types of simple-hybrid configurations, a line of symmetry can be drawn down the center of the block diagram for the system configuration. In complex-hybrid configurations, this line of symmetry does not exist. Of all
1545-5955/$20.00 © 2005 IEEE
WEBBINK AND HU: AUTOMATED GENERATION OF ASSEMBLY SYSTEM-DESIGN SOLUTIONS
configuration types, this is probably the least implemented, but may prove useful for multiproduct lines, as well as possibly providing for useful backup systems and producing higher quality or lower cost products. Despite the implementation of these alternative system configurations, their impact on system performance is not well understood. Some work has been done in analyzing the impact of some simple-hybrid configurations on some system performance parameters, such as throughput. Dallery and Stecke [2] and Hillier and So [5] examined the impact of workload allocation in simple-hybrid configurations, while Iyama and Ito [9] examined the allocation of buffers in a predefined serial-groups configuration, all to optimize system throughput. Kim and Yano [10] extended this problem to include the number of workstations as a variable. Furthermore, several works, including Magazine and Stecke [11] and Green and Guha [4], noted that deliberate imbalance of the production system can lead to improved performance. However, these works focus primarily on a limited number of performance metrics which may be derived mathematically, which is not possible in all cases. One such example is the quality of a sheet-metal assembly as defined by its six-sigma variation, which can only be estimated using finite-element methods because of the compliance in the parts. As these factors may have conflicting trends with changing configuration, as demonstrated by Hu, et al. [8], it is important to consider multiple performance criteria, as a singular definition of system performance can lead to the implementation of a system which is not responsive to market fluctuations, produces poor-quality products, or suffers from other problems. Therefore, what is desired is a method by which to derive a complete set of configurations which may then be evaluated for all performance metrics. In addition, different configurations will require different assembly sequence and task assignments to the stations. Thus, the assembly system-design solution will consist of a system configuration and corresponding assembly sequence and task assignment. Furthermore, it is desirable that these solutions include the option of complex-hybrid configurations, in addition to the previously studied simple hybrids. Generations of these solutions can easily be divided into three subtasks: generation of system configurations, generation of assembly sequences, and matching of sequences with configurations and appropriate task assignment. This paper presents a set of algorithms designed to rapidly derive the set of feasible solutions in these three steps. These solutions may then be tested later to determine any performance metric. II. SYSTEM-CONFIGURATION GENERATION The method developed for generating system configurations will be referred to as the distribution method. This approach relies on the grouping corollary, which can be briefly stated as follows. For any given system configuration of either serial, parallel, or hybrid design which does not allow rework or the bypassing of workstations, the system configuration can be viewed as a set of combinations of stations or groups of stations, all of which are of either parallel or serial design.
33
Fig. 2. Grouping corollary example.
Fig. 3. Example of the difference in parallel/serial distributions.
This corollary can be demonstrated easily through the fourworkstation example in Fig. 2. Through evaluation of the configuration from its deepest level, it is clear that the grouping corollary holds for the configurations of interest. Therefore, the configurations can be generated through a simple reversal of the grouping concept, which is, in effect, a distribution of workstations. Therefore, a basic algorithm for generating configurations is readily developed. Beginning with workstations, all possible methods of distributing these stations in a serial manner, in clusters, and as single workstations are determined. These are recorded, and then any configuration where clusters of workstations still exist are reexamined. These clusters are then redistributed in a parallel fashion, recording all possible permutations. The process then switches back to distribution in a serial manner, and alternates between serial and parallel until all configurations are fully distributed into single workstations and no clusters exist. An additional feature that is necessary to note is the difference that occurs when dividing a group of workstations in serial fashion, as opposed to division in a parallel fashion. More specifically, once a cluster of workstations has been divided into a number of subgroups, those subgroups have to be arranged. For example, a three-workstation cluster can be subdivided into a cluster of two and a single station as one option. If the cluster is being divided in a serial fashion, the manners in which these groups can further be arranged must also be considered. That is, (1 2) must be considered as well as (2 1). For the parallel distribution, these two arrangements are indistinct. This is clearly demonstrated in Fig. 3. One final note is the difference in the serial distribution the first time the clusters are subdivided and any subsequent serial subdivision. In any subsequent subdivision, the maximum size of any cluster resulting from the subdivision must be strictly less than the size of the cluster being subdivided. In the first distribution, this restriction does not hold. This is necessary to keep the
34
IEEE TRANSACTIONS ON AUTOMATION SCIENCE AND ENGINEERING , VOL. 2, NO. 1, JANUARY 2005
Fig. 6. Demonstration of the distribution algorithm.
Fig. 4.
Distribution method block diagram.
Fig. 7. Increase in the number of configurations with an increase in number of workstations.
Fig. 5. (((11) 1)((11) 1)) configuration.
full set of workstations as a single cluster to be divided in a parallel fashion in the second subdivision, thus allowing for the generation of the parallel, parallel lines, and many complex-hybrid configurations. With these additional constraints on the generation algorithm defined, the entire algorithm may be fully developed. A block diagram for the algorithm appears in Fig. 4. The only task remaining for implementation of the algorithm is to develop a notation for storing the configurations. In the scheme developed for this task, a full description of a configuration contains only characters from the set {1,(,)}. A “1” is the simple representation of a machine, while a parentheses, either open, or closed, is a tag identifying a switch between a parallel distribution and a serial distribution. On the highest level, all machines or groups of machines are in a serial configuration. Thus, the string “1 1 1 1 1 1” represents the serial configuration.. The first set of parentheses then represents a switch from a serial to a parallel distribution. Any machines or groups of machines within that set of parentheses are then distributed in a parallel fashion. Thus, the string (1 1 1 1 1 1) represents the parallel configuration. Furthermore, a second set of parentheses within the first would mark a switch back to a serial configuration. These parentheses sets can be nested as deep as necessary to describe a given configuration. Thus, the string (1 1 1 1) (1 1) would be a serial-groups configuration consisting of four machines in parallel, connected in serial fashion to a group of two machines in parallel. For a slight variation, the (((11) 1)((11) 1)) configuration (Fig. 5) of two groups of three machines in parallel, each composed of two machines in parallel feeding one machine in serial, can also be constructed
as a demonstration of the versatility of this notation. Using such notation, any configuration can be represented by such a string. For further clarity and to serve as a demonstration of the algorithm, the results for a three-machine configuration are given in Fig. 6. Careful analysis confirms that every feasible configuration is represented by exactly one string produced by the generation algorithm, and all feasible configurations without rework or bypassing are derived. It can further be verified that the algorithm produces the complete set for any number of workstations, not just for those demonstrated. Thus, using this simple algorithm, all possible configurations of workstations can be generated in no more than passes of the algorithm. While no formula exists to predict the exact number of configurations, the true value lies somewhere be(see Fig. 7). Clearly, the number of feasible tween and solutions is exceedingly large for even relatively small numbers of workstations. While this method clearly derives all configurations, an alternative approach to storing these systems proves to be useful in determining matched pairs of configurations and sequences. In this form, an integer matrix is used (Fig. 8) with the rows representing the workstations receiving input, and the columns representing the workstations releasing their output. Therefore, then represents whether in its most basic form, the element or not material flow exists from station to station . To build this representation, a value of 1 is inserted if this flow exists, and is 0, otherwise. Furthermore, there must be some representation for the beginning of the line and the end of the line. Without this, there would be no way of determining the beginning or the end of the line, as workstation number is unrelated to its position in line. Therefore, extra rows and extra columns are needed to represent the entry and exit points of the assembly line. One extra
WEBBINK AND HU: AUTOMATED GENERATION OF ASSEMBLY SYSTEM-DESIGN SOLUTIONS
35
TABLE I PRECEDENCE RULES
Fig. 8.
Base matrix for configuration storage.
row and one extra column are necessary to accomplish this task. The row corresponds to the exit of the assembly line, and the column corresponds to the entry point. However, to allow for a more logical ordering of the rows and columns while maintaining the setup described above, so an element corresponds to workstation sending output to itself (rework), a redundant column and row are added for the exit and entry points, respectively. As these are redundant, the entries for these values are preset, and this does not increase the complexity of the problem to any degree.
of these constraints and previously existing constraints is given in Table I. As a final note, for the simplification of the generation task, and for a reduction in the size of the generated set, it is assumed that for any sequence in which the case (AB) exists, if the operations are not performed simultaneously or on the same station, they must be strictly sequential. That is, if (AB) is given as a rule, then no sequence is permitted containing the subsequence ACB. This is of importance to the task of sequence and configuration matching, as the allowance of such intermediate steps makes ensuring that streams of product merging from parallel stations have reached the same level of completion (i.e., have had the same tasks performed). Furthermore, such exclusion arguably does not eliminate any desired sequences, as in most cases, any tasks that may be completed together should at least be completed sequentially.
III. ASSEMBLY-SEQUENCE GENERATION The second portion of any assembly system-design solution is an appropriate assembly sequence for the product that will be built using a system with an appropriate configuration. Methods for deriving these sequences have been well-developed and extensively documented. Based on the algorithm of DeFazio and Whitney [3], assembly sequences can be generated and stored as a simple text string which can be read as the order in which operations are performed. What is needed, in addition, is an ability to store and track the sets of operations for which simultaneous or same-station completion is either mandatory or optional. In the event that same-station or simultaneous completion is mandatory, this set of operations, say {A}, is effectively replaced by the set {A }, which consists of a single operation. Alternatively, if this is only optional, then both the sequences where they are performed separately and together must be generated. To denote these options, a simple notation is used. If the set of operations {A,B,C} must be performed simultaneously or on the same station, then the sequence is enclosed within brackets, or [ABC]. Note that in this case, any sequence which differs only by the replacement of [ABC] by [BAC], or any similar rearrangement of the operations which are bracketed, is redundant. Likewise, if this simultaneous or same-station completion is optional, then the set of operations is enclosed by a set of parentheses, or (ABC). Unlike the case where this is mandatory, the replacement of (ABC) by (BAC) is not redundant, and all permutations of the set must be included in the final set of sequences. This is a result of the fact that this same-station completion is only optional. Therefore, the set (ABC) could be performed on the same station, or be broken into three stations, in which case, the sequence ABC differs from BAC. A summary
IV. MATCHING SYSTEM CONFIGURATION AND ASSEMBLY SEQUENCE Given a set {C} of feasible system configurations, and a set {S} of feasible assembly sequences, the set of feasible solutions {F} is defined {F} is given by{F}={C} {S}, where each by some combination C S of a single system configuration and some sequence which it is capable of performing. Clearly, this set {F} can range dramatically in size, from being empty to having as many possible solutions as the product of the number of configurations and the number of assembly sequences. Determination these elements can be divided into two smaller steps. The first of these is to select a configuration {C} and a sequence {S}, and determine if the configuration is capable of performing the given sequence. Once this has been determined, the second phase of the task is to determine which tasks in the sequence are assigned to which workstation. While completeness would dictate that every possible solution {F} should be generated, it is not necessary to do so in the search for the optimal configuration. Certain feasible solutions can be shown to be inefficient, and can, therefore, be neglected. This approach is taken in the first step of the matching process, where it is determined whether a configuration can perform a sequence, through a process which will be described as “route counting.” The concept of route counts is simple. Any given configuration has a set of flow paths along which the product flows. If the configuration is serial in design, then there exists only a single flow path. However, if the configuration consists of workstations in parallel, there are distinct flow paths. For each of these flow paths, the product will pass through a certain number of
36
IEEE TRANSACTIONS ON AUTOMATION SCIENCE AND ENGINEERING , VOL. 2, NO. 1, JANUARY 2005
Fig. 9. Example configuration for route counts.
TABLE II DERIVATION OF A ROUTE-COUNT SET
stations. This number, in turn, is defined to be the route count. Clearly, however, this number may vary from one flow path to the next. As a result, for any given configuration, there is a set {Z}, whose elements consist of all the possible route counts for a given system configuration. For example, in Fig. 9, there are four possible flow paths (1-2-4-5, 1-2-6, 3-4-5, 3-6). The first of these flow paths, 1-2-4-5, passes through four stations, the second two paths pass through three stations each, and the final path passes through only two stations. Therefore, the set of route counts for this configuration is given by {Z} = {2, 3, 4}. Computation of the set {Z} is straightforward and simple, given a configuration stored in the notation of the distribution method. Starting from the deepest nested section of the configuration, the string can be analyzed to determine if it represents a cluster of workstations in serial or in parallel. If the cluster is in parallel, then the material flows through no more than one workstation, and the entire cluster can be replaced by a count, offset from the remaining portion of the configuration by a notation, such as [1]. If the cluster is in serial, then material flows through a number of workstations equal to that in the cluster (say ), so the cluster is replaced by [ ]. This examination process is then repeated at the next level, with a slight modification. If the next highest level shows a string such as ([2] [1]), where two workstations in series are in parallel with a third, then the whole group is replaced by a notation containing a list of all the possible counts, or [1, 2]. In a serial cluster, such as [2] [1], there is only one flow path available, so the result is the sum of the two counts, or [3]. Similarly, if the string would have shown [1, 2] [1], the result would have been all the possible sums of the elements in the first bracket with that in the second, or [2, 3]. Repetition of this process until all the clusters are evaluated will result in the set {Z}. This is clearly demonstrated in Table II using the configuration in Fig. 9, which is represented by the string ((1 1) 1) ((1 1) 1). In addition to the set {Z}, it is necessary to have similar information on the candidate sequence , in order to determine if the configuration is capable of performing the sequence. This set of sequence counts, {P}, consists of all the possible numbers of steps that the sequence may use, and is likewise simple to generate from the string representing a given assembly sequence. In any given sequence, the only portion which needs any true analysis is that of the optionally simultaneous or same-station
operations, such as (ABC). Such a sequence can clearly occupy a range of numbers of workstations. One option is for all three tasks to be performed independently on three different stations. A second obvious option is to perform all three tasks on a single station. And a final option is to perform two of the three tasks on one station, and the third task on a second station. This exists in two cases, AB on one station, C on the next, or A on one station, BC on the next. The case of AC on one station and B on the next is neglected, as it would be derived from a sequence such as (ACB). This split of the tasks into this final option is necessary, however, to guarantee the derivation of some feasible solutions. While it may result in the duplication of some solutions, those duplications can easily be eliminated. Therefore, an option such as (ABC) gives possible counts of {1,2,3}. When all of these options are evaluated, and the remaining standalone or strictly simultaneous/same-station operations are replaced with 1’s, a string such as (ABC)DE will now appear as {1,2,3}1 1. This string can then be evaluated just as in the case of the configuration counts, computing all possible sums, and will result in the set {P}, which in this example is {3,4,5}. With {P} and {Z} generated, it is clear that a configuration is capable of performing a given sequence if there exists some Z {P} such that . That is to say, if there is a manner of performing a given sequence such that it requires flow through stations, and there is some flow path through the configuration that takes the material through a number of stations greater than or equal to this number, then the configuration is capable of performing the sequence. However, the capability of a given configuration to perform a given sequence is no guarantee of efficient operation. It is clear Z {P} such that , and that if there exists some furthermore, is the smallest element in {Z} and the largest in {P}, then the configuration will have idle workstations. For example, if the smallest is 4, then the product flows through four workstations at the minimum. However, if the maximum is 3, then the sequence can use at most three workstations, meaning at least one workstation, and possibly more, are guaranteed to be idle at all times. These idle workstations could be sold or removed from the system, as the capital investment in them is being wasted. As a result, this solution is inefficient and should be dropped from consideration. The case where the same configuration is analyzed with the idle workstations removed can still be considered as part of the set of feasible configurations using less than the maximum allowed number of workstations. This result can be broadened to include other cases than that where is strictly less than . This expanded rule governing the feasibility and efficiency of a given configuration and sequence pair will be referred to as the matching subset rule. Matching Subset Rule: A given configuration {C} is ca{S} if there exists pable of performing a given sequence some Z {P} corresponding to these selections, such . However, the configuration is capable of efficiently that performing the given sequence only if {Z} {P}. Conversely, if {Z} {P}, then there exists some configuration , with an equal or fewer number of workstations, which may perform the sequence with greater efficiency. This may occur either through an increase in productivity or a decrease in the capital cost of the system.
WEBBINK AND HU: AUTOMATED GENERATION OF ASSEMBLY SYSTEM-DESIGN SOLUTIONS
Fig. 10.
Alternative configurations with greater efficiency.
For example, if the system from Fig. 9 is selected along with (AB)CD, then the matching subset rule comes the sequence into effect. The route-count set for this configuration is given by {Z}={2,3,4}. Similarly, the count for the given sequence is given by {P}={3,4}. Therefore, {Z} {P}, and the combination of the two selections is an inefficient system. This can be demonstrated by examining the obvious assignment of tasks to stations. In this example, station 1 is assigned task A, station 2 task B, station 3 performs both A and B, station 4 task C, station 5 task D, and station 6 is idle. The clear solution to improving capital expenditures in this case would be to remove workstation 6 from the configuration. However, efficiency gains can be made through increased productivity using an alternate configuration, as well. When including station reliability, the expected , where is the productivity can be defined as throughput of the th state of the system, and is the probability of being in that state. Each state of the system is defined simply by a unique combination of all or some of the stations being operative or having failed. For the configuration given, assuming a station reliability of 0.9 and a processing rate in all stations of one task per minute, the configuration will have an expected productivity of 0.8563 parts per minute. Quick examination of several alternatives shows that multiple configurations exist which produce higher throughput with the same amount or even fewer workstations (see Fig. 10). Given a system configuration and an assembly sequence which satisfy the Matching Subset Rule, the final phase of the matching process is to determine the exact allocation of tasks to workstations. In some cases, this is a trivial task. However, some configurations offer multiple ways of applying a given assembly sequence. If all elements of {F} are desired, then each assignment of tasks must be generated. However, the majority of the time, there is one particular assignment of tasks that will produce the best throughput for the system. Instead of generating all the possible solutions, only one assignment for each pair is derived, satisfying the requirement to maximize throughput. This can be done using an integer programming method similar to what is used in a generalized assembly-line balancing problem. It still is undetermined if the vertices of the polytope which will be defined by the equations governing the assignment will be integers. If this is the case, then simple linear programming techniques can be applied. It is possible to use the basis of the work by U˘gurda˘g et al. [13] to derive a set of equations and relations to allow an integer programming technique to derive the optimum allocations of may be defined tasks to workstations. That is, 0–1 variables, such that they are equal to one if workstation performs task . In order to allow this, each workstation must be assigned an index number, and each assembly task must likewise be given a representative number. Assigning a workstation an index is simple to do, as it is simply one less than the column number of
37
the station in the matrix form of the configuration. Furthermore, as the sequence must proceed as given, indexes may be assigned to tasks simply by the order in which the sequence is given. Hence, the sequence (AB)CD results in A=1, B=2, C=3, D=4. corresponds to the whether or not station Thus the variable 3 performs task B. Naturally, an objective function needs to be defined. As this needs to be expressed mathematically, a logical choice is to maximize the throughput of the system, which is slightly more challenging when including complex-hybrid configurations than in the case of the previously studied simple hybrids. The first step in the calculation of throughput is to determine the minimum theoretical cycle time for a given station, given a are given in a matrix [X], current allocation of tasks. If the and the individual task cycle times in a row vector of length , then the minimum cycle times for each station are given by . These cycle times correspond to the maximum rate of production, assuming that a workstation is never starved. This rate of production, however, will not be achieved in practice for all workstations, as some station will most likely serve as a bottleneck, and subsequent stations will be blocked occasionally. Therefore, to calculate the total production rate, it is necessary to calculate what the input rates are to each station, and take the maximum of the cycle time and this interarrival time as the effective cycle time for the station, and proceed down the line to the stations which send their output to the exit of the line. This task, however, is not entirely trivial. Analyzing serial groups and complex-hybrid configurations require a more intensive algorithm than the simple mathematical approach which has been used for simple-hybrid configurations. The general process is the same whether or not station reliability is considered, the only difference being the number of times the system needs to be analyzed (this is equal to the number of possible if there are stations). states in the system, or The process is theoretically simple. Each state of the system is essentially a problem that needs to be analyzed individually. Using the values given by the previous calculation of workstation cycle times, , the production rate for a given system configuration can be calculated relatively easily. If the string representing the system configuration is used, with the station number proceeding from the leftmost in the string increasing to the right can be in sequence, then the inverse of the cycle times substituted for the station number. Then, proceeding from the deepest nested set, these values can be evaluated. If the set being evaluated is parallel in nature, it can be replaced with the sum of the throughput rates. On the other hand, if it is serial in nature, it can be replaced with the minimum of the throughput rates. This proceeds, working outwards until the system is fully evaluated. The resulting value is the net production rate for the given state of the system. Other states of the system can be evaluated simply by replacing the throughput rate of any nonfunctional workstations with a zero, and proceeding as before. As an example, the configuration given in Fig. 11, represented by the string ((((1 1) 1) 1) 1) 1, can perform the sequence (ABC)D. If this sequence is assigned to give station 1 task A, station 2 task B, station 3 tasks A and B, station 4 task C, station 5 tasks A B and C, and station 6 task D, and the times to complete these tasks are 1 s for A, B, and C, and 0.2 s for task
38
Fig. 11.
IEEE TRANSACTIONS ON AUTOMATION SCIENCE AND ENGINEERING , VOL. 2, NO. 1, JANUARY 2005
Example system configuration. TABLE III EXAMPLE THROUGHPUT CALCULATION
D, then the station cycle time vector will be given as (1, 1, 2, 1, 3, 0.2). Calculation of the net throughput for the state when all stations are operating then proceeds as in Table III. As can be seen, the throughput for this state is 1.33 parts per minute. All other states for the system can be evaluated similarly to calculate the expected throughput of the system. The maximization of this throughput constitutes the objective function, leaving the generation of constraints as the remaining step before task assignment can proceed. In the previous research, the only constraints were that each task is assigned exactly once, and that precedence constraints are held. In this case, the precedence constraints need to be applied, as the sequence of operations must adhere to the sequence in the solution pair being examined. However, the constraint that each task is assigned only once does not hold. This would hold if the line is serial, or parallel lines, which can be modeled as a serial line. Similarly, if the line were serial groups or parallel in design, and tasks were assigned to parallel groups, this constraint would hold. However, for complex-hybrid configurations, this constraint does not hold, and is eliminated. The additional constraints needed are as follows: no duplication of tasks on any single flow path through the system, and what is called the source combination rule. The source combination rule constraint is fairly simple. That is, every product flowing into any single station must have had the same tasks performed on it, regardless of its source. Despite the simplicity of the rule, tracking the flow in a configuration to ensure this constraint is met is not trivial. Using the distribution method’s string-based representation of a system configuration, it is difficult to track all the flow paths and therefore ensure that the source combination rule holds for all stations. This is significantly easier to do based on the matrix representation of a configuration, however. If the matrix representation of a system configuration is taken, and all diagonal elements set to zero, constraints are relatively simple to derive (note that this works only for cases without rework, which is not a concern here). If, for each station , the sum is taken, the result is the number of tasks performed at
the station. As the assembly sequence is not allowed to alter, if the number of tasks performed at all previous stations is the same regardless of source, then the source combination rule is satisfied. Therefore, the flow matrix can be used to check this rather easily. If the unit values in the matrix are taken and removed, leaving an empty value in the matrix, the matrix can be backfilled using the data for the number of tasks performed in each station to check for compliance. The first step in this process is to take all columns that have blanks in the last, or exit, row, and fill those blanks with the total number of tasks that have to be performed in the assembly process. All of these columns should now be complete and have no remaining blanks. At this point, any complete column may be chosen for examination. If column is chosen, the first nonzero value in this column is taken as the number of tasks which are completed when the product leaves the station. Therefore, if the number of , is subtracted from this tasks completed in this station, value, the result should be the number of tasks completed when the product enters the station. Therefore, any blank values in the th row should then be set to this number. The examined column is then tagged as being evaluated, and a new completed column can be chosen. If at any point, a completed column or row has multiple nonzero entries which are not equal, then the source combination rule has been violated. Therefore, the process repeats until either a violation is detected or all columns corresponding to workstations have been examined. Note that the same process can be used examining rows, starting with any row which has a blank entry in the first, or entry, column, and proceeding in the same fashion, only examining rows and applying the results to the columns. The benefit of this approach to developing a constraint for the source combination rule is that it also serves as an effective means to ensure that all tasks are completed in the given assignment. When all the blank values have been filled in, completeness of the assembly can be determined simply by checking the first column in the matrix. If this column has any nonzero entries, then one of two things must be true. If any value is negative, then that shows that at some point on the line, tasks were duplicated. On the other hand, if any value is positive, then that indicates that some tasks were not performed. Either case is a clear violation, and results in rejection of the given task assignment. The final set of constraints needed is that of ensuring that precedence is maintained. Ensuring that the order of tasks is kept is relatively simple. If task is assigned to station , then task must be assigned to either station , if this is allowed, or to all stations whose output flows into station . It can be shown rather trivially that this results in the following constraints:
Therefore, if the ( )th task is performed at station , the first left-hand term is 1, and the second becomes 0, as the previous checks prevent duplication. In this case, the second term on the , right-hand side becomes 0, and therefore, we have and the constraint holds. If the task is not performed at station
WEBBINK AND HU: AUTOMATED GENERATION OF ASSEMBLY SYSTEM-DESIGN SOLUTIONS
, then all must be equal to one for all stations whose represents the truncated flow output flows to station . Here matrix, with the first and last columns and rows removed (the entry and exit references). Note that this holds only if rework and bypassing are not present. Thus, the second term on the left-hand side tells how many of the stations flowing into station perform task . The right-hand term then simplifies to the number of stations whose output flows into station . We know these must be equal, and hence, the constraint. This constraint simplifies to
Other necessary constraints needed are for same station/simultaterms. neous operations, and constraints on the values of the 0,1 . The former is simple The latter is simple, as to derive by hand from the given assembly sequence, as if operations and must be performed on the same station, according to the given sequence. Similarly, if . they must be performed on separate stations, With these constraints, it is possible to get a task allocation pair. This comthat gives a maximum throughput for each pletes the generation of a complete set of assembly system-design solutions. Each pair so derived is one element of the complete set of feasible solutions, which may then be evaluated more in depth on an individual basis for other performance metrics, such as product quality, market responsiveness, and others, not all of which may be mathematically formulated and incorporated into the traditional optimization framework. V. CONCLUSION Previous research has studied extensively the task of solving assembly system-design problems, however, no attempts have been made at incorporating optimality criteria that cannot be expressed mathematically, nor have any included the option of complex-hybrid configurations. Here, we have presented a set of algorithms designed to generate a complete set of feasible solutions, including those of the complex-hybrid type, in order to allow for later testing for all possible optimality criteria. This should allow for the inclusion of metrics not previously addressed in assembly-line balancing problems, and thus lead to a higher probability of selecting the optimal solution. REFERENCES [1] D. F. Baldwin, T. E. Abell, M. C. M. Lui, T. L. De Fazio, and D. E. Whitney, “An integrated computer aid for generating and evaluating assembly sequences for mechanical products,” IEEE Trans. Robot. Autom., vol. 7, pp. 78–93, Feb. 1991. [2] Y. Dallery and K. E. Stecke, “On the optimal allocation of servers and workloads in closed queueing networks,” Oper. Res., vol. 38, no. 4, pp. 694–703, 1990.
39
[3] T. L. De Fazio and D. E. Whitney, “Simplified generation of all mechanical assembly sequences,” IEEE J. Robot. Autom., vol. RA-3, pp. 640–658, Dec. 1987. [4] L. V. Green and D. Guha, “On the efficiency of imbalance in multifacility multi-server service systems,” Manage. Sci., vol. 41, no. 1, pp. 179–187, 1995. [5] F. S. Hillier and K. So, “On the simultaneous optimization of server and work allocations in production line systems with variable processing times,” Oper. Res., vol. 44, no. 3, pp. 435–443, 1996. [6] L. S. Homem de Mello and A. C. Sanderson, “A correct and complete algorithm for the generation of mechanical assembly sequences,” IEEE Trans. Robot. Autom., vol. 7, pp. 228–240, Apr. 1991. [7] D. S. Hong and H. S. Cho, “Generation of robotic assembly sequences with consideration of line balancing using simulated annealing,” Robotica, vol. 15, pp. 663–673, 1997. [8] S. J. Hu, K. Stecke, and R. F. Webbink, “Analysis of various assembly system configurations with respect to quality and productivity,” Univ. Michigan, Ann Arbor, Tauber Manuf. Inst. Tech. Rep., 2001. [9] T. Iyama and S. Ito, “The maximum production rate for an unbalanced multi-server flow line system with finite buffer storage,” Int. J. Prod. Res., vol. 25, no. 8, pp. 1157–1170, 1987. [10] Y.-D. Kim and C. A. Yano, “Impact of throughput-based objectives and machine grouping decisions on the short term performance of flexible manufacturing systems,” Int. J. Prod. Res., vol. 35, no. 12, pp. 3303–3322, 1997. [11] M. J. Magazine and K. E. Stecke, “Throughput for production lines with serial work stations and parallel service facilities,” Perform. Eval., vol. 25, pp. 211–232, 1996. [12] J. L. Nevins and D. E. Whitney, “Assembly research,” Automatica, vol. 16, no. 6, pp. 39–57, 1980. [13] H. F. U˘gurda˘g, R. Rachamadugu, and C. A. Papachristou, “Designing paced assembly lines with fixed number of stations,” Eur. J. Oper. Res., vol. 102, pp. 488–501, 1997. [14] T. W. Weber, “Theory of manufacturing system configurations,” Ph.D. dissertation, Univ. Michigan, Ann Arbor, 1997.
Robert F. Webbink received the B.S. degree from the California Institute of Technology, Pasadena, in 1997, and the M.S. and Ph.D. degrees from the University of Michigan, Ann Arbor, in 1999 and 2003, respectively. His research interests are in assembly and manufacturing systems. He has published papers in assembly system design. He is currently with Proctor and Gamble, Cincinnati, OH.
S. Jack Hu received the B.S. degree from Tianjin University, Tianjin, China, in 1983, and the M.S. and Ph.D. degrees from the University of Michigan, Ann Arbor, in 1986 and 2000, respectively. He is currently a Professor of Mechanical Engineering and the Director of the Program in Manufacturing at the University of Michigan. He conducts research and teaches courses in assembly, manufacturing systems, and statistical methods. He has published more than 100 papers in refereed journals of professional conferences. Dr. Hu is a Fellow of the American Society of Mechanical Engineers (ASME).