Automated Identification of Endmembers from Hyperspectral Data Using Mathematical Morphology Antonio Plazaa, Pablo Martíneza, J. Anthony Gualtierib, Rosa M. Péreza a GRNPS, Departamento de Informática, Universidad de Extremadura, Spain. b Global Science and Technology. NASA/Goddard Space Flight Center, Greenbelt, MD, U.S. ABSTRACT One of the most widely used approaches to analyze hyperspectral data is pixel unmixing, which relies on the identification of the purest spectra from the data cube. Once these elements, known as “endmembers”, are extracted, several methods can be used to map their spatial distributions, associations and abundances. A large variety of methodologies have been recently proposed with the purpose of extracting endmembers from hyperspectral data. Nevertheless, most of them only rely on the spectral response; spatial information has not been fully exploited yet, specially in unsupervised classification. The integration of both spatial and spectral information is becoming more relevant as the sensors tend to increase their spatial/spectral resolution. Mathematical morphology is a non-linear image analysis and pattern recognition technique that has proved to be especially well suited to segment images with irregular and complex shapes, but has rarely been applied to the classification/segmentation of multivariate remote sensing data. In this paper we propose a completely automated method, based on mathematical morphology, which allows us to integrate spectral and spatial information in the analysis of hyperspectral images. The accuracy of the proposed algorithm is tested by its application to real hyperspectral data, and the results provided are compared to those found using other existing endmember extraction algorithms. Keywords: Remote Sensing, Hyperspectral Data, Spatial/Spectral Analysis, Endmember Extraction, Image Processing.
1. INTRODUCTION During the last several years, a great deal of new airborne, satellite and spaceborne sensors have been developed or improved for hyperspectral remote sensing applications1. In the near future, these sensors will be producing a near continual stream of high dimensional data, resulting in a massive data volume that will require faster means for storage, transmission and analysis2. A very useful approach for hyperspectral data analysis and classification has been spectral unmixing3,4,5. The basic assumption is that each pixel can be modeled as a linear combination of component constituents, known in the literature as endmembers6. If a set of individual endmembers have been previously identified, a linear mixture of ground components can be quantified and discriminated by several methodologies3. Therefore, a particular scene can be decomposed in such a way as to recover the fractional contributions of the fundamental constituents, providing an efficient mechanism for subpixel analysis. In order to perform such analysis, some researchers have taken the approach of constructing spectral libraries of pure elements that can be matched with every pixel in order to classify a scene7. Nevertheless, when no such references are available, the analyst must derive the endmembers directly from the data cube, which is not an obvious task. In the following section, an overview of the existing endmember extraction techniques is provided.
2. ENDMEMBER EXTRACTION TECHNIQUES A large variety of methodologies have been recently proposed with the purpose of extracting endmembers from hyperspectral data cubes. Next, some of the most well-known methodologies are summarized. a
278
E-mail:
[email protected],
[email protected],
[email protected]. b E-mail:
[email protected].
Image and Signal Processing for Remote Sensing VII, Sebastiano Bruno Serpico, Editor, Proceedings of SPIE Vol. 4541 (2002) © 2002 SPIE · 0277-786X/02/$15.00
Pixel Purity Index (PPI) The Pixel Purity Index (PPI) algorithm3 is based on the geometry of convex sets. A dimensionality reduction is first performed using the MNF transform. Next, a pixel purity index is calculated for each point in the image cube by randomly generating lines in the N-dimensional space comprising a scatterplot of the MNF transformed data. All of the points in the space are now projected onto the lines and those ones that fall at the extremes of the lines are counted. After many repeated projections to different lines, those pixels that count above a certain threshold are declared “pure”. These potential endmember spectra are loaded into an N-dimensional visualization tool and rotated in real time until extremities in the data cloud, that will likely correspond with scene endmembers, are visually identified. Orasis. This algorithm uses a process called Exemplar Selection to thin the data set8. There is no previous dimensionality reduction over the data. The procedure rejects redundant spectra by calculating the angle between spectral vectors. Any vector which is not separated by a certain threshold angle is thinned from the data. The procedure then finds a basis set of much lower dimension than the original data by a modified Gram-Schmidt process. The exemplar spectra are then projected onto this basis subspace and a simplex is found through a minimum volume transform. N-FINDR. The input to this algorithm is the full spectral image cube, without any dimensionality reduction. The procedure must examine the full data set to find those pure pixels that can be used to describe the various mixed pixels in the scene. This algorithm finds the set of pixels with the largest possible volume by “inflating” a simplex inside the data. The procedure begins with a random set of vectors. In order to refine the initial estimate of endmembers, every pixel in the image must be evaluated as to its likelihood of being a pure or nearly pure pixel. To do this, the volume is calculated for every pixel in place of each endmember. A trial volume is calculated for every pixel in each endmember position by replacing that endmember and finding the volume. If the replacement results in an increase in volume, the pixel replaces the endmember. This procedure is repeated until there are no more replacements of endmembers9. Iterative Error Analysis (IEA). This algorithm is also executed directly on the data with no previous dimensionality reduction. An initial vector (usually the mean spectrum of the data) is chosen to start the process. A constrained unmix is then performed and the error image is formed. The average of the vectors with the largest error (distance from the initial vector) is assumed to be the first endmember. Another constrained unmix is then performed and the error image formed. The average of the vectors with the largest error (distance from the first endmember) is assumed to be the second endmember. This process is continued until the predetermined number of endmembers is found10.
3. INTEGRATION OF SPECTRAL AND SPATIAL RESOLUTION The methods addressed in section 2 can be used to extract endmembers from hyperspectral data in automated or semiautomated (PPI) fashion. Nevertheless, the major drawback of all these approaches is that they only take into account the spectral information contained in the data cube, disregarding spatial information. Remote sensing data has the unique ability of being represented as an image, but conventional analysis techniques have traditionally focused on analyzing the data without incorporating any information on the spatially adjacent data; i.e. the data is not considered as an image but as an unordered listing of spectral measurements that can be shuffled arbitrarily without affecting analysis11. If we consider hyperspectral data as an image, then a particular pixel is characterized by spectral and spatial properties. The spectral information concerns the value of the pixel independently of the values of its neighbors, while the spatial information concerns the relationship between the pixel value and those of its neighbors. It is quite clear at this point that all the methods addressed in section 2 focus exclusively on the spectral properties of the data.
Proc. SPIE Vol. 4541
279
Our main goal in the present work is the development of a new methodology that integrates both spatial and spectral information in the analysis of multivariate remote sensing data. We strongly believe that there is a need to incorporate the image representation in the analysis of hyperspectral data. Some authors12 have previously considered the need to integrate spatial information to the spectral content in order to perform unsupervised classification of multivariate data. We propose a novel approach to this task which relies on the use of extended morphological operations. Mathematical morphology theory13,14 is a widely used image analysis technique that provides powerful tools for extracting geometry and representing shapes in binary and grayscale images. Morphological operators focus on the spatial information of the objects present in an image, and allow a detailed description of an image through the spatial characteristics of the objects under study (size, orientation, overlapping,…). We need not doubt that this analysis has interested many scientists from many different areas15, but few authors have exploited its possibilities in the analysis/classification of hyperspectral remote sensing data16. This paper introduces a new, completely automated approach to the unsupervised analysis of hyperspectral image scenes using mathematical morphology concepts17. The extension of classic morphological operations to the N-dimensional domain allows us to integrate spectral and spatial information in the analysis process and thus incorporate the idea of image in the field of hyperspectral data analysis. In the following section, a schema to extend the classic morphological operations to multivariate data and the proposed analysis methodology are described. The accuracy of this method is tested by applying it to real hyperspectral data (section 5). The paper ends with some concluding remarks in section 6.
4. METHODS 4.1 Extending mathematical morphology to hyperspectral images Mathematical morphology was originally defined for binary images. The two basic operations of binary morphology are erosion and dilation, which consist of the transformation of a set X (image objects) by another set K, known as the structuring element13. The principles of mathematical morphology have also been extended to the grayscale image case18. In greyscale morhology, images and structuring element sets are continuous valued sets. Let f be a grey level function representing the image and k a structuring element. Then erosion and dilation can be respectively written as follows. (f ⊗ k)( x, y) = Min {f (x + s, y + t) − k(s, t)}
(1)
(f ⊕ k )(x, y) = Max {f (x − s, y − t) + k(s, t)}
(2)
( s, t ) ∈ k
( s, t ) ∈ k
The main computational task while tackling greyscale morphological operations is the query for local maxima or minima in a certain search area which is determined by the size and spatial properties of the used structuring element. This fact implies an ordering relation, but in the case of hyperspectral images there is no natural means for total ordering of multivariate pixels. Then, the major challenge in the task of extending morphology to the hyperspectral image case is the definition of a vector ordering relation to determine the supremum and the infimum of any family of N-dimensional vectors19. We propose to impose a lattice structure onto the spectral space and define morphological operators by extension as follows. Let x1, x2, …, xn be a set of multivariate pixels that have been selected by a structuring element at a certain pixel spatial neighborhood. A measure of the spectral dissimilarity between two of those pixels, i.e. xa and xb, is calculated by the angular distance function, expressed in radians. x ⋅x dist (x a , x b ) = cos −1 a b xa ⋅ xb
(3)
From this measure, the following scalar quantity can be calculated to determine the cumulative distance between a particular pixel xi and a set of spatial neighbors x j , j = 1...m, j ≠ i .
280
Proc. SPIE Vol. 4541
m
d i = ∑ dist (x i , x j )
(4)
j=1
From the previous definition, the calculation of the maximum and the minimum of a set of x i , i = 1 ...n multivariate pixels is straightforward. These elements are respectively defined by the following expressions. TD = arg max d i and TE = arg min d i i
(5)
i
Where TD is the most spectrally singular pixel in a spatial neighborhood and TE is nothing else than the median of the pixels in the neighborhood, according to the classical vector median definition19. It is now easy to perform basic morphological operations such as erosion and dilation by maximum and minimum operations. The result of applying an erosion/dilation operation to a hyperspectral dataset is a new data cube, with exactly the same dimensions as the original. Let X be a hyperspectral image and K a square-shaped 3x3 structuring element. The structuring element is moved, pixel by pixel, through the image, defining a local spatial search area around each target pixel. The maximum (dilation) or minimum (erosion) pixel in the search area is calculated according to the previously described schema, as depicted in figure 1.
1 1 1 K = 1 1 1 1 1 1
NA
NB
NC
ND
T
NE
NF
NG
NH
T E = arg m ax d i i
i = {T , N A , N B , ..., N H
}
T D = arg m in d i i
X ( O riginal image )
i = {T , N A , N B , ..., N H
}
TE
TD
X ⊗K ( E roded im a ge )
X ⊕K ( E roded im age )
Figure 1. Hyperspectral erosion and dilation.
4.2 Proposed methodology We propose a fully automated methodology to extract endmembers from hyperspectral images based on morphological erosion and dilation operations. The algorithm is called AMEE (Automated Morphological Endmember Extraction). The input to this method is the full data cube, with no previous dimensionality reduction. It is desirable to work with normalized pixel spectra (scaled to make the norm constant among all pixels) to remove the information related to the total radiance, while retaining the spectral pattern. The method consists of the following steps.
Proc. SPIE Vol. 4541
281
Application of morphological endmember detectors Morphological detectors are used to find endmembers as extreme pixels in spectral and spatial space. The detectors are based on a combination of morphological operations. Firstly, a hyperspectral erosion is applied over the original image and, secondly, the spectral dissimilarity between the resulting eroded image and the original is calculated following a pixel-by-pixel basis (see equation 3). Figure 2 illustrates the local effect of the proposed detector on synthetic hyperspectral images formed by two ground components: a spectrally pure one (good candidate for being selected as an endmember) and other formed by a mixture of elements. In this example, we consider a square-shaped 3x3 structuring element. N ot p ure
NA
N ot p ure
P ure
P ure
NB
NC
NA
NB
NC
ND
T
NE
ND
T
NE
NF
NG
NH
NF
NG
NH
Tar g et p ix e l
a ) L o w o u tp u t N ot p ure
b ) L ow o utp ut N ot p ure
P ure
P ure
NA
NB
NC
NA
NB
NC
ND
T
NE
ND
T
NE
NF
NG
NH
NF
NG
NH
c ) H igh o utp u t
Tar g et p ix e l
d ) L ow o utp ut
Figure 2. Working procedure of a morphological endmember detector.
The addressed detector produces a high output in figure 2.c. In this case, the erosion operation selects the “minimum” pixel in the neighborhood, i.e., one of the pixels in the zone labeled as “not pure”, and the spectral difference between the selected pixel and the target pixel T is high. Note that T belongs to the zone labeled as “pure”. On the other hand, a low value is obtained in figure 2.b since the selected pixel and the target pixel belong to the same zone. Finally, in figures 2.a and 2.d, the detector produces a low output (all the pixels in the neighborhood have similar “purity”). From this example it can be deduced that if a larger neighborhood had been considered (for example, a 5x5 structuring element), the output at the target pixel figure 2.d would have been high, as it could be expected. The previous consideration indicates that a multi-scale spatial analysis of the hyperspectral image is required. The procedure described in figure 2 must then be repeated for each pixel of the original image using structuring elements of progressively increased size. This results in spatial/spectral information at each pixel of the scene. From this information, a probability image is generated following the basic idea of algorithms like the PPI: those pixels that are repeatedly “selected” during the process increase their probability of being declared “pure”. The resulting probability image can be represented in the form of a greyscale image where higher values indicate more purity and lower values indicate lower purity, taking into account that the term “purity” refers in this case to the spatial and spectral nature of the data.
282
Proc. SPIE Vol. 4541
Automated endmember selection and region growing Endmember spectra are automatically extracted from the probability image obtained after spatial/spectral processing of the data, as described in the previous section. This is done by a simple thresholding technique. There are plenty of automated procedures for thresholding greyscale images available in the literature20. From all of them, one that produces particularly good results in our application is Otsu method21, which is based on the minimization of the weighted sum of group variances. Let σ 2w , σ 2b and σ 2t be the within-class, between-class and total variance, respectively. An optimal threshold t can be determined by maximizing one of the following criterion functions with respect to t. λ=
σ 2b σ 2w
η=
σ 2b σ 2t
κ=
σ 2t σ 2w
(6)
Thresholding the probability image results in a set of unconnected regions that are used as seeds from which a region growing process is performed. It is based on the approach proposed by Bateson et al.22 to create endmember bundles: initially, a bundle is created from each seed region, containing the spectra associated to all the pixels in the region. Then, a median spectrum is constructed to act as a seed endmember for the bundle. Spatial neighbors are incorporated to the bundle if they are similar enough (spectral angle < 0.01) to the seed endmember. When no suitable neighbors are found to be incorporated in the bundle, the growing process finishes and the median spectrum of the bundle is selected as a final endmember.
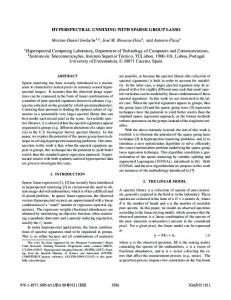
5. RESULTS We have applied our endmember extraction algorithm to real hyperspectral data obtained from the AVIRIS imaging spectrometer for a particular scene: Salinas 98 taken in the Salinas Valley, California on October 9, 199823. This data was available only as at-sensor radiance data and includes vegetables, bare soils and vineyard fields. We have selected a subscene of the Salinas 98 dataset called Salinas A, which comprises 83x86 pixels and includes six classes. Ground truth is available for this image, as described in figure 4 (at the end of the paper). The spatial/spectral characteristics of the Salinas A dataset make it particularly suitable for testing the accuracy of our method. Ground truth information reveals zones where broccoli with weeds, senesced corn and romaine lettuce are present. The romaine lettuce is at different weeks since planting (from 4 to 7) and with growth increasingly covering the soil. A reference dataset of endmembers was obtained for this particular image using the PPI procedure. The endmembers extracted by this widely accepted supervised methodology will be compared to those found by our algorithm. Some considerations about the application of AMEE algorithm are provided next. • Square-shaped structuring elements were used in the endmember identification stage. The size of the structuring elements ranged from 3x3 pixels to 30x30 pixels in order to provide a detailed spatial-spectral description of the scene. • The resulting probability image was automatically thresholded using Otsu’s algorithm, resulting in a set of unconnected regions. These regions were grown using the region growing algorithm described in subsection 4.2. • Median spectra were calculated for the grown regions and used as endmembers for linear spectral unmixing3. Through efficient implementation of the algorithm, the full process of autonomous endmember identification was accomplished in approximately 1 minute using a Pentium III 500 MHz personal computer with 128 megabytes of RAM. Figure 3 shows the full set of endmembers extracted by both PPI and AMEE methodologies, as well as a comparison between the individual spectra. The availability of ground truth allows us to identify the zones that those endmembers represent. In particular, four endmembers were extracted by both approaches, corresponding to the zones labeled in figure 3 as broccoli, romaine_lettuce_4wk, romaine_lettuce_7wk and corn_senesced_green_weeds. It is important to emphasize that the mixture situation in the romaine lettuce zones is correctly modeled: the zone at 4 weeks since planting is mostly soil while the one at 7 weeks is mostly lettuce. The remaining lettuce areas can be expressed as a
Proc. SPIE Vol. 4541
283
linear combination of these two endmembers. The comparison addressed in figure 4 reveals that the spectral difference between the endmembers obtained by our method and those found by the PPI is very low. Also, the number of endmembers found by both approaches is the same. AMEE Endmembers
10000
10000
7500
7500
Radiance
Radiance
PPI Endmembers
5000
2500
5000
2500
0
0
Wavelength (0.41 - 2.45 micrometers)
10000
Wavelength (0.41 - 2.45 micrometers)
PPI vs AMEE endmember (broccoli): Spectral Angle=0.0050
PPI vs AMEE endmember (lettuce_romaine_4wk): Spectral Angle=0.0094 5000
Radiance
Radiance
7500
5000
2500
2500
0
0
Wavelength (0.41 - 2.45 micrometers)
Wavelength (0.41 - 2.45 micrometers)
5000
PPI vs AMEE endmember (corn_green_weeds): Spectral Angle=0.0742 5000
Radiance
Radiance
PPI vs AMEE endmember (lettuce_romaine_7wk): Spectral Angle=0.0094 7500
2500
0
2500
0
Wavelength (0.41 - 2.45 micrometers)
Wavelength (0.41 - 2.45 micrometers)
Figure 3. A comparison between the endmembers found by the PPI methodology and AMEE algorithm.
Figure 5 (at the end of the paper) shows greyscale abundance maps representing the fractional composition of endmember materials in the scene. These maps have been obtained by the Linear Spectral Unmixing procedure using the endmembers obtained by the PPI procedure (upper row) and our algorithm (lower row), and have been rescaled to lie in 0..255. In these greyscale abundance maps, values close to white indicate a large abundance of the endmember constituent. A color composite image obtained through the Spectral Angle Mapper algorithm3 is also addressed for each methodology. The colors of the resulting classes are equivalent to those shown in figure 3, while black is associated to unclassified pixels. A visual comparison of the results provided in figure 5 reveals that the results obtained by PPI and AMEE are in essence the same. The previous considerations lead us to conclude that, from a quantitative point of view, our method appears to produce results very similar to those found by widely accepted methodologies like the PPI procedure. Since no human supervision is needed during the process, the use of our algorithm results in an important reduction in the overall
284
Proc. SPIE Vol. 4541
computational time. On other hand, although in this case the results are similar, we believe that the incorporation of spatial properties in the analysis of hyperspectral data may lead to much improved results in more complicated datasets.
6. CONCLUSIONS The integration of spectral and spatial information in the analysis of hyperspectral data is becoming more relevant as the spatial/spectral capabilities of imaging spectrometers are constantly improved. Most of the available methodologies rely exclusively on the spectral information of the data cube, without taking into account the existing spatial correlation of the data. In this work, the fundamentals of a new autonomous method to find endmembers in hyperspectral remote sensing data are described. The method relies on mathematical morphology, a widely used tool to study the spatial information contained in binary and greyscale images. For the sake of using morphological operations to find endmembers in spatial/spectral space, a schema to extend the basic morphological operations to hyperspectral images is proposed and discussed. Although no previous dimensionality reduction or data thinning is required, the proposed morphology-based approach is capable of rapid and accurate determination of endmember spectra from high dimensional hyperspectral images. Some preliminary results obtained after applying this algorithm to real AVIRIS sensor data show that it is successful in the task of integrating spatial and spectral information in the analysis process. Although the results found are encouraging, some work is still needed in order to extrapolate our conclusions to other hyperspectral datasets and evaluate the influence of spatial correlation in the final classification.
ACKNOWLEDGEMENTS The authors would like to thank L.F. Johnson of NASA/AMES for sharing the Salinas 98 data and ground truth. Funding from Spanish Government (CICYT-FEDER program) under the TIC-2000-0739-C04-03 grant is also gratefully acknowledged.
REFERENCES 1.
Greeen, R.O., Editor, AVIRIS Earth Science Workshop Proceedings, 1988-2000. Available at http://makalu.jpl.nasa.gov/. 2. Tadjudin, S. and Landgrebe, D., Classification of High Dimensional Data with Limited Training Samples, PhD thesis, School of Electrical Engineering and Computer Science, Purdue University, May, 1998. Available as TRECE-98-9 from http://dynamo.ecn.purdue.edu/~landgreb/Saldju-TR.pdf. 3. Boardman, J.W., Kruse, F.A. & Green, R.O., “Mapping Target Signatures via Partial Unmixing of AVIRIS Data”, Summaries of the V JPL Airborne Earth Science Workshop, 1995. 4. Maselli, F., “Multiclass Spectral Decomposition of Remotely Sensed Scenes by Selective Pixel Unmixing”, IEEE Trans. Geoscience and Remote Sensing, vol. 36, issue: 5, part 2, pp: 1809 –1820, Sept. 1998. 5. Martínez P., Pérez R.M., Aguilar P.L., Bachiller, P. and Diaz, P., “A Neuronal Tool for AVIRIS Hyperspectral Unmixing”, Summaries of the IX JPL Airborne Earth Science Workshop, pp 281-286, JPL/NASA, 1999. 6. Kruse, F.A., “Spectral Identification of Image Endmembers Determined from AVIRIS Data”, Summaries of the VIII JPL Airborne Earth Science Workshop, 1998. 7. Roberts, D.A., Dennison, P., Ustin, S., Reith, E., Morais, M., “Development of a Regionally Specific Library for the Santa Monica Mountains Using High Resolution AVIRIS Data”, Summaries of the VIII JPL Airborne Earth Science Workshop, 1999. 8. Palmadesso, P., Antoniades, J., Baumback, M., Bowles, J. & Rickard, L.J., “Use of Filter Vectors and Fast Convex Set Methods in Hyperspectral Análisis”, Proceedings of SPIE, 1999. Available at http://nemo.nrl.navy.mil/public/publications.html. 9. Winter, M.E., “Fast Autonomous Spectral Endmember Determination in Hyperspectral Data”, Proc. 13th International Conference on Applied Geologic Remote Sensing, vol II, pp. 337-344, Vancouver, Canada, 1999. 10. Neville, R.A., Staenz, K., Szeredi, R., Lebfebre, J., Hauff, P., “Automatic Endmember Extraction from Hyperspectral Data for Mineral Exploration”, Proc. 4th International Airborne Remote Sensing Conference, vol. II, pp. 891-897, Ottawa, Canada, 1999.
Proc. SPIE Vol. 4541
285
11. Madhok, V. and Landgrebe, D., Spectral-Spatial Analysis of Remote Sensing Data: An Image Model and A Procedural Design. PhD thesis, School of Electrical Engineering and Computer Science, Purdue University, May, 1998. Available as TR-ECE-99-10 from http://dynamo.ecn.purdue.edu/~landgreb/TR-ECE 99-10.pdf. 12. Jiménez, L.O., Rivera-Medina, J., “On the Integration of Spatial and Spectral Information in Unsupervised Classification for Multispectral and Hyperspectral Data”, EUROPTO Conference on Image and Signal Processing, Proceedings of SPIE Vol. 3871, 1999. 13. Serra, J., Image Analysis and Mathematical Morphology. Academic Press, London, 1982. 14. Serra, J., Image Analysis and Mathematical Morphology, Volume 1. Academic Press, London, 1993. 15. Plaza, A., Cernadas, E., Durán, M.L., Sánchez, Antequera, T., “Directional Morphological Operators to Detect Fat Streaks in Iberian Ham”, VIII National Symposium on Pattern Recognition and Image Analysis, pp. 47-48, Bilbao (Spain), 1999. 16. Soille, P., “Morphological Partitioning of Multispectral Images”, Journal of Electronic Imaging, Vol. 5(3), pp. 252265, July 1996. 17. Plaza, A., Martínez, P., Gualtieri, J.A., Pérez, R.M., “Spatial/Spectral Endmember Extraction from AVIRIS Hyperspectral Data Using Mathematical Morphology”, Summaries of the X JPL Airborne Earth Science Workshop, 2001. 18. Sternberg, S.R., “Greyscale Morphology”, Computer Vision Graphics and Image Processing, 35, 283-305, 1986. 19. Lambert, P., Chanussot, J., “Extending Mathematical Morphology to Color Image Processing”, CGIP’2000, SaintEtienne, France, 2000. 20. Sahoo, P.K., Soltani, S. & Wong, A.K.C., “A Survey of Thresholding Techniques”, Computer Vision, Graphics and Image Processing, 41, pp. 233-260, 1988. 21. Otsu, N., “A Threshold Selection Method from Gray-Level Histograms”, IEEE Trans. Systems, Man, and Cybernetics, Vol.SMC-9 No. 1, Jan. 1979. 22. Bateson, C.A., Asner, G.P., Wessman, C.A., “Endmember Bundles: A New Approach to Incorporating Endmember Variability into Spectral Mixture Analysis”, IEEE Trans. Geoscience and Remote Sensing, vol. 38, no. 2, pp: 1083 –1094, March 2000. 23. Gualtieri, J.A., Bechdol, M., Chettri, S., Robinson, J.W., Garegnani, J., Vermeulen, A., Antonille, S., “From Spectra to Classification”, Technical Report, NASA/GSFC, 2000.
286
Proc. SPIE Vol. 4541
Figure 4. A subscene of the Salinas 98 dataset, showing known ground truth as polygons containing solid colors bounded by black lines and surrounded by thumbnail figures of the ground truth taken at the time of the data acquisition. The outlined box in red shows the subscene boundaries of the scene called Salinas A.
Figure 5. Greyscale abundance maps for the endmembers extracted by PPI (upper row) and AMEE (lower row). Along with these maps, a final classification image obtained using the SAM algorithm is addressed for each method.
Proc. SPIE Vol. 4541
287