have to be detected and treated in a service-oriented fault diagnosis which
therefore ... This thesis aims at providing a concept for service fault diagnosis
which is.
Automated IT Service Fault Diagnosis Based on Event Correlation Techniques
Dissertation
an der ¨ Mathematik, Informatik und Statistik Fakult¨at fur der ¨ Ludwig-Maximilians-Universit¨at Munchen
vorgelegt von
Andreas Hanemann
Tag der Einreichung: 22. Mai 2007
1. Berichterstatter: Professor Dr. Heinz-Gerd Hegering, Ludwig-Maximilians-Universit¨at M¨unchen 2. Berichterstatterin: Professor Dr. Gabrijela Dreo Rodosek, Universit¨at der Bundeswehr M¨unchen
Automated IT Service Fault Diagnosis Based on Event Correlation Techniques
Dissertation
an der ¨ Mathematik, Informatik und Statistik Fakult¨at fur der ¨ Ludwig-Maximilians-Universit¨at Munchen
vorgelegt von
Andreas Hanemann
Tag der Einreichung: 22. Mai 2007 Tag der m¨undlichen Pr¨ufung: 19. Juli 2007
1. Berichterstatter: Professor Dr. Heinz-Gerd Hegering, Ludwig-Maximilians-Universit¨at M¨unchen 2. Berichterstatterin: Professor Dr. Gabrijela Dreo Rodosek, Universit¨at der Bundeswehr M¨unchen
Acknowledgments This thesis has been written as part of my work as a researcher at the Leibniz Supercomputing Center (Leibniz-Rechenzentrum, LRZ) of the Bavarian Academy of Sciences and Humanities which was funded by the German Research Network (DFN-Verein) as well as in cooperation with the research group of Prof. Dr. Heinz-Gerd Hegering. Apart from the LRZ, this research group called MNM-Team (Munich Network Management Team) is located at the University of Munich (LMU), the Munich University of Technology (TUM) and the University of Federal Armed Forces in Munich. At first, I would like to thank my doctoral advisor Prof. Dr. Heinz-Gerd Hegering for his constant support and helpful advice during the whole preparation time of this thesis. I would also like to express my special gratefulness to my second advisor, Prof. Dr. Gabi Dreo Rodosek, for giving me advice on finding an appropriate research matter for the thesis and also for many discussions about the thesis structure and contents. At the LRZ I would like to thank my supervisors Dr. Victor Apostolescu and Dr. Helmut Reiser for giving me the opportunity to integrate the work on the PhD thesis into the work on our network monitoring project. The meetings of the MNM Team have been an important possibility for me to present and discuss the status of my thesis with other researchers. In this context, I would like to thank Timo Baur, Latifa Boursas, Michael Brenner, Dr. Thomas Buchholz, Vitalian Danciu, Nils Otto vor dem gentschen Felde, Dr. Markus Garschhammer, Matthias Hamm, Iris Hochstatter, Wolfgang Hommel, Dr. Bernhard Kempter, Ralf K¨onig, Silvia Knittl, Annette Kostelezky, Dr. Michael Krause, Feng Liu, Dr. Harald R¨olle, Thomas Schaaf, Michael Schiffers, Georg Treu, and Mark Yampolskiy. In particular, I would like to thank David Schmitz and Martin Sailer (both also being members of the MNM Team) who have pursued related research directions for many valuable discussions. The outcome of some student work which I have supervised also has been helpful for the thesis preparation. Therefore, I would like to thank Dirk Bernsau, Hans Beyer, Marta Galochino, Patricia Marcu, and Martin Roll for their efforts. At the LRZ I would like to thank Dr. Eberhard Hahn, Dr. Ulrike Kirchgesser, Klaus Natterer, Gudrun Sch¨ofer, Werner Spirk, and Michael Storz for information about the example services. Last but not least, I would like to express my gratitude to Karl-Heinz Geisler for improving the language quality of the thesis and my parents for their support prior and during the thesis preparation. Munich, May 2007 This work was supported in part by the EC IST-EMANICS Network of Excellence (#26854).
Summary In the previous years a paradigm shift in the area of IT service management could be witnessed. IT management does not only deal with the network, end systems, or applications anymore, but is more and more concerned with IT services. This is caused by the need of organizations to monitor the efficiency of internal IT departments and to have the possibility to subscribe IT services from external providers. This trend has raised new challenges in the area of IT service management, especially with respect to service level agreements laying down the quality of service to be guaranteed by a service provider. Fault management is also facing new challenges which are related to ensuring the compliance to these service level agreements. For example, a high utilization of network links in the infrastructure can imply a delay increase in the delivery of services with respect to agreed time constraints. Such relationships have to be detected and treated in a service-oriented fault diagnosis which therefore does not deal with faults in a narrow sense, but with service quality degradations. This thesis aims at providing a concept for service fault diagnosis which is an important part of IT service fault management. At first, a motivation of the need of further examinations regarding this issue is given which is based on the analysis of services offered by a large IT service provider. A generalization of the scenario forms the basis for the specification of requirements which are used for a review of related research work and commercial products. Even though some solutions for particular challenges have already been provided, a general approach for service fault diagnosis is still missing. For addressing this issue, a framework is presented in the main part of this thesis using an event correlation component as its central part. Event correlation techniques which have been successfully applied to fault management in the area of network and systems management are adapted and extended accordingly. Guidelines for the application of the framework to a given scenario are provided afterwards. For showing their feasibility in a real world scenario, they are used for both example services referenced earlier.
Kurzfassung In den letzten Jahren war im Bereich des IT-Managements ein Paradigmenwechsel zu beobachten. Hierbei geht es in zunehmendem Maße nicht mehr um das reine Management von Netzen, Endsystemen oder Applikationen, sondern um das Management von IT-Diensten. Dieses ist dadurch bedingt, dass Organisationen die Leistungen interner IT-Abteilungen u¨ berpr¨ufbarer machen sowie den Einkauf extern erbrachter IT-Dienste von Dienstanbietern erm¨oglichen m¨ochten. Hieraus ergeben sich neue Anforderungen an das ITManagement, insbesondere im Zusammenhang mit Dienstvereinbarungen, die die durch einen Dienstleister zu erbringende Dienstqualit¨at festlegen. Auch im Bereich des Fehlermanagements ergeben sich neue Fragestellungen im Zusammenhang mit diesen Dienstvereinbarungen. Beispielsweise kann eine hohe Auslastung von Verbindungen in der Netzinfrastruktur zu einem Anstieg der Verz¨ogerung bei der Erbringung von Diensten f¨uhren, was im Hinblick auf vereinbarte Zeitbedingungen betrachtet werden muss. Solche Zusammenh¨ange m¨ussen erkannt und in einer dienstorientierten Fehlerdiagnose behandelt werden, die sich daher nicht mehr mit Fehlern im engeren Sinne, sondern mit Verminderungen der Dienstqualit¨at befasst. In dieser Arbeit geht es um ein Konzept zur Diagnose von Fehlern bei der Erbringung von IT-Diensten, was einen Teil des Fehlermanagements f¨ur ITDienste darstellt. Zun¨achst wird eine Motivation der Notwendigkeit von weiteren Untersuchungen in diesem Bereich gegeben, die auf der Analyse von IT-Diensten, die im Umfeld eines großen IT-Dienstleisters angeboten werden, beruht. Eine Verallgemeinerung des Szenarios dient als Grundlage f¨ur die Festlegung von Anforderungen, die im weiteren f¨ur die Bewertung von verwandten Forschungsarbeiten und kommerziellen Produkten verwendet werden. Obwohl einige bisherige Arbeiten L¨osungen f¨ur Teilaspekte der Fragestellung bieten, wird deutlich, dass ein allgemeiner Ansatz zur Dienstfehlerdiagnose bislang fehlt. Im Hauptteil der Arbeit wird hierzu ein Rahmenwerk vorgestellt, als dessen zentrale Komponente ein Ereigniskorrelator eingesetzt wird. Ereigniskorrelationstechniken, die bisher erfolgreich auf der Netz- und Systemmanagementebene eingesetzt wurden, werden hierf¨ur entsprechend angepasst und erweitert. Empfehlungen zur Anpassung des Rahmenwerks an ein gegebenes Dienstszenario werden im folgenden zur Verf¨ugung gestellt. Um deren Nutzen in einem realen Szenario deutlich zu machen, werden diese f¨ur die beiden vorher dargestellten Beispieldienste angewendet.
CONTENTS
1 Introduction
1
1.1
Research Issue . . . . . . . . . . . . . . . . . . . . . . . . .
3
1.2
Deficits of Today’s IT Service Fault Management . . . . . . .
5
1.3
Thesis Outline . . . . . . . . . . . . . . . . . . . . . . . . . .
6
2 Requirements
9
2.1
Definition of Terms . . . . . . . . . . . . . . . . . . . . . . . 10
2.2
Service Management Scenario at the Leibniz Supercomputing Center . . . . . . . . . . . . . . . . . . . . . . . . . . . . . . 15
2.3
Generic Scenario for Service Fault Diagnosis . . . . . . . . . 24
2.4
Requirements Derivation . . . . . . . . . . . . . . . . . . . . 26
2.5
Summary . . . . . . . . . . . . . . . . . . . . . . . . . . . . 35
3 Related Work
37
3.1
IT Process Management Frameworks . . . . . . . . . . . . . . 39
3.2
Service and Resource Modeling . . . . . . . . . . . . . . . . 55
3.3
Fault Management Interfaces . . . . . . . . . . . . . . . . . . 61
3.4
Fault Management Techniques . . . . . . . . . . . . . . . . . 69
3.5
SLA Management . . . . . . . . . . . . . . . . . . . . . . . . 91
3.6
Summary . . . . . . . . . . . . . . . . . . . . . . . . . . . . 99
4 Framework for Service-Oriented Event Correlation 4.1
105
Motivation for Service-Oriented Event Correlation . . . . . . 107 I
Contents 4.2
Refinement of the Requirements . . . . . . . . . . . . . . . . 108
4.3
Event Correlation Workflow . . . . . . . . . . . . . . . . . . 110
4.4
Event Correlation Framework . . . . . . . . . . . . . . . . . . 124
4.5
Hybrid Event Correlation Architecture . . . . . . . . . . . . . 129
4.6
Information Modeling and Management . . . . . . . . . . . . 155
4.7
Assessment Metrics for a Given Scenario . . . . . . . . . . . 174
4.8
Collaboration with Impact Analysis . . . . . . . . . . . . . . 175
4.9
Assessment . . . . . . . . . . . . . . . . . . . . . . . . . . . 176
4.10 Summary . . . . . . . . . . . . . . . . . . . . . . . . . . . . 181 5
6
7
Adaptation Guidelines for Service Providers
183
5.1
Planning . . . . . . . . . . . . . . . . . . . . . . . . . . . . . 183
5.2
Implementation . . . . . . . . . . . . . . . . . . . . . . . . . 185
5.3
Ongoing Maintenance and Optimization . . . . . . . . . . . . 190
5.4
Withdrawal . . . . . . . . . . . . . . . . . . . . . . . . . . . 190
5.5
Summary . . . . . . . . . . . . . . . . . . . . . . . . . . . . 191
Application of the Framework to LRZ Services
193
6.1
Planning . . . . . . . . . . . . . . . . . . . . . . . . . . . . . 194
6.2
Implementation . . . . . . . . . . . . . . . . . . . . . . . . . 194
6.3
Ongoing Maintenance and Optimization . . . . . . . . . . . . 236
6.4
Withdrawal . . . . . . . . . . . . . . . . . . . . . . . . . . . 237
6.5
Summary . . . . . . . . . . . . . . . . . . . . . . . . . . . . 238
Conclusions and Future Work
239
7.1
Achievements . . . . . . . . . . . . . . . . . . . . . . . . . . 239
7.2
Future Development Possibilities . . . . . . . . . . . . . . . . 241
7.3
Outlook . . . . . . . . . . . . . . . . . . . . . . . . . . . . . 243
A Complete Code of the Correlation Algorithm
245
B Tivoli Enterprise Console Implementation Code
253
II
Contents List of Figures
299
List of Tables
305
Bibliography
307
Abbreviations
323
Index
327
III
Chapter 1 Introduction
Contents 1.1
Research Issue . . . . . . . . . . . . . . . . . . . . . . .
3
1.2
Deficits of Today’s IT Service Fault Management . . . .
5
1.3
Thesis Outline . . . . . . . . . . . . . . . . . . . . . . .
6
For many companies today the reliability of the IT services they use has become a critical factor for success in the business market. Due to the industry trend to focus onto the core business, the IT services are in many cases outsourced to external IT service providers. To ensure that these IT services are provided in a reliable manner, service contracts called service level agreements (SLAs) are laid down between customers and IT service providers. These contracts specify quality of service (QoS) parameters which describe the performance of the service in question. If the QoS parameters are not met, penalties are part of the agreements which have to cover the resulting consequences for the customer.
IT services now critical business success factor
Another important trend, which is based on changes mentioned before, is the establishment of provider hierarchies. A provider uses one or more services from other providers and offers them to customers with a functionality enriched in a specific manner. For being able to provide SLAs for the so called value added service, a provider needs to negotiate SLAs with its subproviders accordingly. As a consequence, there is not only a chaining of services, but also of SLAs.
service chains
Ensuring a high service quality is not only important to avoid financial penalties. Inside of companies SLAs can exist between the IT department and other departments without defining penalties. For services operated by a university computer center there might be no explicit quality guarantees at all. However, making sure that a high service quality is met is in any case important to justify the funding.
importance of reliable service quality
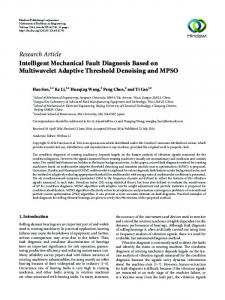
These changes require a broadening of the management perspective where previously more or less separated management disciplines have to be able to collaborate. The management pyramid1 (see Fig. 1.1) shows the differ-
management disciplines
1
There is currently no commonly accepted standard for naming and decomposing the management disciplines.
1
Chapter 1. Introduction
business objectives workflows, policies gap IT operations perspective
Business Management Enterprise Management Service Management Application Management
Fault Management Configuration Management Accounting Management Performance Management Security Management
Systems Management Network Management
Figure 1.1: Management pyramid: disciplines and functional areas
ent management levels which have to be considered. Business Management deals with the management of a whole company involving tasks like financial management and strategic planning. At this layer business objectives are defined. The application of IT in the entire organization is managed by Enterprise Management where the abstract business objectives have to be transformed into processes and policies. While these two management disciplines assume a top-down perspective, the management inside an IT department was previously centered around Network Management and Systems Management. These disciplines take care of the management of networks and end systems. In addition, Application Management deals with the operation of applications and therefore accesses the Network Management and Systems Management. service management
The paradigm shift towards IT services described in the beginning makes it necessary to link the previously not directly considered relationship between enterprise management and the IT operations perspective. The evolving management discipline Service Management aims at filling the gap by managing IT services being based upon resources and maybe other IT (sub-)services with respect to the business goals of the organization. The management of services also involves the use of processes so that there is a close link to the processes in enterprise management. However, the management of processes on this level can also only be considered as partially solved since standard process framework have limitations concerning precision and modeling depth.
consequences for management areas
From a bottom-up perspective this paradigm shift means to change the view from device-oriented to service-oriented management affecting all the wellknown FCAPS (fault, configuration, accounting, performance, security) management functional areas. This paradigm shift affects configuration management, where the way services are provided has to be managed, and performance management, where service performance has to be monitored and assured. Apart from changes in accounting and security management, fault management also has to be adapted to service-orientation. Here, it is not sufficient to deal with errors in the network or end systems anymore, but service faults also have to be taken into account. 2
1.1. Research Issue It is important to be aware of the different nature of faults in the area of service fault management in contrast to device-oriented management. There are not only situations where a service is available or not, but it can be available having a low quality. Therefore, it would be reasonable to denote this situation as a service quality degradation rather than as a fault. However, to be compliant with the term fault management a fault can also be a quality degradation (with regard to SLAs) in the following.
service fault = service quality degradation
An example of such a fault is that a service transaction takes longer than expected. If the slow transaction is caused by a high link utilization, it cannot be regarded as a fault in the prior sense. Nevertheless, fault management is required to find some solution to deal with the situation as users are affected by the long transaction time. The definition which data transfer time is acceptable is dependent on the customer’s and provider’s perspective which is usually defined in an SLA. In contrast, the fault definition the area of network and systems management is often given by device vendors.
service fault example
Furthermore, it can be witnessed that service faults are often aggregated from faults and other features of the underlying management areas. The previously mentioned transaction may e.g. be based on the sequential collaboration of different systems so that the overall transaction time is the sum of processing times and delays in these systems. A service fault can also be the result of an aggregation in time, e.g. if the average delay of transaction within a certain time interval is higher than a threshold.
aggregated nature of service faults
Fault management is usually divided into the phases fault detection, fault diagnosis, and fault resolution which also holds for service management. In service fault detection it is recognized that there is some anomaly in the service operation. This can either be reported by users or by the provider’s service monitoring. In the service fault diagnosis phase the problem’s root cause should be determined. Sometimes it is also already sufficient to classify the problem without really identifying the basic root cause. In the service fault resolution phase the root cause can be removed by using an appropriate resolution action or a workaround/preliminary solution can be implemented depending on the nature and severity of the identified problem.
service fault management phases
1.1
Research Issue
The issue of this thesis is to provide a systematic framework to improve the identification of resources being responsible for a service quality degradation. The framework therefore primarily aims to address the service fault diagnosis task, but has interfaces to service fault detection and resolution as well as to service management in general.
service fault diagnosis framework
The main benefits that are in the focus of the framework are twofold. At first, the overall fault resolution time shall be reduced by minimizing the time
framework benefits
3
Chapter 1. Introduction needed for the identification of a resource whose current performance affects the service quality. Examples of such a performance problem can be a complete failure of the resource, a high utilization leading to weak performance or a wrong configuration. As stated before, this is especially needed for SLAs which often contain time constraints for fault resolution. The application of the framework should therefore allow to keep previously agreed SLAs and shall also enable the provider to offer stricter guarantees in future SLAs. Another benefit the framework aims at is the reduction of the provider’s effort for service fault management which can be achieved by a systematic treatment of fault messages. The main issues which arise in the context of the framework are the following. Fault management workflow: Starting from a workflow to perform the service fault management process, framework components have to be identified to deal with the reported symptoms. The framework needs to have components for the reception of symptoms. Other components are required for the diagnosis and to forward the diagnosis result to fault recovery. A detailed workflow to describe the necessary cooperation between these components has to be developed. Methods: The methods which shall be applied for the processing of symptom reports have to be investigated. It is intended to examine whether existing approaches in particular from the area of network and systems management can be adapted to perform these tasks especially if these methods are already in use. Information modeling: A modeling of the different kinds of information for the framework is mandatory. This modeling comprises the services and resources including a special focus on their dependencies and the quality parameters, SLAs, and different kinds of symptom messages. While the framework should have a generic design in order to be applicable to many kinds of services, guidelines are needed to adapt the framework to a concrete scenario. In addition, criteria should be provided to allow for a monitoring of the framework’s benefits. The introduction of the framework for a service provider will usually not only lead to changes in the technical management of services, but also to organizational changes. input for framework components
The framework integrates previous research results and is designed to be complementary with other research efforts within the MNM Team. Fig. 1.2 depicts these relationships with regard to fault management phases and management disciplines. For the framework the PhD work of Michael Langer [Lan01] and Michael Nerb [Ner01] as well as the one of Markus Garschhammer [Gar04] serves as input for the component design. The customer interface design and QoS measurement methodology from these theses are extended, respectively. In a part of the PhD work of Vitalian Danciu [DHHS06, DgFS07] a monitoring architecture is proposed to generate vendor-independent information (rich events) from device-dependent information. This work is an important 4
1.2. Deficits of Today’s IT Service Fault Management fault detection Customer Relationship Management
fault diagnosis
fault resolution
Customer Service Management Langer/Nerb
QoS measurement Garschhammer
Service Management
Framework for IT Service Mgmt
Service fault diagnosis framework
Dreo
Hanemann
Impact analysis and recovery framework Schmitz
Service MIB Sailer
Rich Resource Events Resource Management
Danciu
Figure 1.2: Relationship to other MNM Team theses
intermediate step to abstract from basic resource data towards service-related information. The theses of Martin Sailer and David Schmitz are closely related to this work. Martin Sailer addresses the construction of a management information base (called Service MIB) which contains all information needed with respect to technical service management [Sai05, DgFS07]. The modeling of service fault management information in the present thesis is going to be included into the overall Service MIB design. David Schmitz addresses another aspect of service fault management. His framework [HSS05a] is designed for the analysis of actual or assumed resource failures and determines their impact onto services and their customers with respect to the agreed SLAs. In addition, this framework provides a decision aid to determine which recovery action is appropriate as a trade-off between expected SLA violation costs and recovery effort.
Service MIB and service impact analysis
The postdoctoral thesis of Gabi Dreo [DR02, DR03] provides a general framework for IT service management covering all FCAPS management functional areas. Therefore, the present work is related to the fault management part of her framework.
1.2
Deficits of Today’s IT Service Fault Management
In IT service fault management the paradigm shift from device-oriented management to service-oriented management has only partially been performed. Many research efforts have been carried out in the past to perform fault management for faults occurring in the network infrastructure, end systems, and 5
tools have limitations w.r.t. service management
Chapter 1. Introduction applications. This research has led to a number of commercial and open source tools which can be applied to this task. While these tools are able to deal with error messages originated from network components which are in most cases predefined by the device vendors, symptoms with respect to the service quality need to be treated differently since their processing is hardly supported. User reports concerning a service quality degradation have to be mapped onto a resource which is identified as being the symptom’s root cause. Formats for such reports have to be designed by the provider on his own as they are closely related to the provider-specific service offer. This means e.g. that it should be possible to report a symptom relating specifically to the used service functionality. today’s service fault management processes
The common method [OGC00] to deal with service problems is the following. In fault management a distinction is made between incident and problem management. Incident management is mainly concerned with the operation of a service desk (also known as help desk) which is responsible for receiving user reports about service symptoms. The service desk staff may find a quick solution to the problem either by giving advice to the user or by installing a simple workaround. In case the symptom requires further treatment the service desk staff may open a trouble ticket (problem description form) which is then assigned to a responsible person for problem management. This person deals with the ticket, e.g. by using management tools to check the network and provides status information to the service desk and/or user.
process deficits
These processes rely very much on the experience of experts with respect to the way service quality is provided. While tools exist to store the network and end systems configuration, an established methodology to store the configuration and status of services is still an unsolved issue. The dependency on expert knowledge may lead to a slowdown in the user report processing as no automation has been developed so far. In addition, staff members may be temporarily unavailable (without an appropriate substitution) or might leave the provider which leads to a loss of problem solving expertise.
1.3
Thesis Outline
The structure of the thesis is presented in the following. It is also depicted in Figure 1.3 where dashed arrows are used to indicate inputs/outputs of the steps performed during the course of the thesis. requirements derivation
In Chapter 2 important terms are defined which will be used throughout the thesis. Most of them are based on the MNM Service Model which gives a generic definition of services and service management. The Leibniz Supercomputing Center (LRZ) serves as an example of a large-scale IT service provider. The services Web Hosting Service and E-Mail Service are used as a further motivation for the necessity of research towards an improved service fault management. A generic framework for service fault management is 6
1.3. Thesis Outline presented in order to motivate and structure the requirements for the solution. The list of requirements can be found at the end of this chapter. It is based on issues identified in the scenario as well as in the generic framework. Related work is referenced in Chapter 3 which is grouped according to the structure of requirements. It is examined where the related work already offers solutions which can be adapted to the current issue or where new solutions have to be found. The related work includes IT process management frameworks, service modeling and management approaches, dependency modeling and finding approaches. In addition, approaches for customer interface design, fault diagnosis techniques (mainly for network and systems management), and SLA modeling and management as well as impact analysis are also part of this chapter.
analysis of related work
In Chapter 4 a framework is proposed for the service fault diagnosis which is designed to fulfill the requirements posed in Chapter 2. The main idea behind the framework is to adapt event correlation techniques which have proven to be useful in the area of network and systems management for service fault diagnosis. The focus is therefore on the event correlation components in the framework. The framework also makes use of some other previous approaches, but some parts of them had to be extended to fit to the needs of service-orientation. An information modeling with respect to the information needed for the framework operation is also a subject of this chapter. Criteria to measure the benefit of the service-oriented event correlation in a concrete scenario have also been identified. These are necessary to monitor whether the application of the framework yields a benefit in a concrete scenario as well as to give the possibility for improvements. Furthermore, possibilities for a close collaboration of service fault diagnosis and impact analysis are discussed.
framework design
To allow for an easy application of the framework to a given scenario, guidelines are provided in Chapter 5. Like in service management the use of the framework can be divided into the life cycle phases planning, implementation, usage, and withdrawal. General decisions about the application of serviceoriented event correlation are made in the planning phase which are executed in the implementation phase. In this phase, for example, dependencies have to be identified, possible user reports have to be defined, and the event correlator has to be initialized according to derived correlation rules. In addition, tools have to be selected for supporting the correlation. The usage phase mainly deals with correlation monitoring and optimization with respect to the criteria identified in the previous chapter. The possible deinstallation of serviceoriented event correlation is the subject of the withdrawal phase.
methodology for application
As a proof-of-concept these guidelines have been applied to the example services offered by the LRZ which are initially presented in Chapter 2. The experience gained from this implementation is contained in Chapter 6.
application
The last chapter concludes the thesis by highlighting the lessons learned during its course. In addition, remaining issues are discussed which should be addressed by future work.
conclusion
7
Chapter 1. Introduction
chapter 1 chapter 2
introduction
problem statement and requirement analysis definition of terms
MNM service model
effective root cause analysis needed for IT service fault management
example scenario at provider (LRZ)
generic scenario
E−Mail Service
requirements analysis
Web Hosting Service
chapter 3 related work dependency modeling/finding
requirements
customer interfaces
service modeling
chapter 4
resource fault management
framework for service−oriented event correlation process management frameworks
idea: use of event correlation techniques for service faults fault diagnosis workflow
analysis of the state−of−the−art
SLA management
contributions and deficits of the state−of−the−art as matrix
framework components identification and design chapter 5 adaptation of event correlation techniques
information modeling
adaptation methodology for a scenario identification of services
planning assessment metrics implementation
framework
usage chapter 6 application to services at the LRZ planning implementation usage
Web Hosting Service E−Mail Service events related to trouble ticket DB using LRZ tools, IBM TEC client performing test interactions
dependency modeling/finding service event definitions rule derivation selection of tools organizational changes monitoring and optimization
withdrawal adaptation methodology
chapter 7 conclusion and future work
withdrawal
Figure 1.3: Thesis structure
8
Chapter 2 Requirements
Contents 2.1
Definition of Terms . . . . . . . . . . . . . . . . . . . . 10
2.2
Service Management Scenario at the Leibniz Supercomputing Center . . . . . . . . . . . . . . . . . . . . . 15 2.2.1
Web Hosting Service . . . . . . . . . . . . . . . . 15
2.2.2
E-Mail Service . . . . . . . . . . . . . . . . . . . 18
2.2.3
Representativeness of the Examples . . . . . . . . 21
2.2.4
Current Service Fault Diagnosis Process at the LRZ 22
2.3
Generic Scenario for Service Fault Diagnosis . . . . . . 24
2.4
Requirements Derivation . . . . . . . . . . . . . . . . . 26
2.5
2.4.1
Workflow Requirements . . . . . . . . . . . . . . 27
2.4.2
Management Information Repositories . . . . . . . 28
2.4.3
Fault Management Interfaces . . . . . . . . . . . . 33
2.4.4
Service Symptom Diagnosis . . . . . . . . . . . . 34
2.4.5
Embedding into Overall Management Solution . . 35
Summary . . . . . . . . . . . . . . . . . . . . . . . . . . 35
At the beginning of this chapter important terms are defined which are used throughout this thesis. Most of their definitions are motivated using the MNM Service Model, a generic model for services and service management. In Section 2.2 a service management scenario, which is identified to be representative for the current situation of IT service management, is used to show the need for further research in this area. A generic framework for service fault diagnosis is presented afterwards (Section 2.3). The requirements for a detailed service fault diagnosis framework that are derived from the scenario as well as from the generic framework can be found in Section 2.4.
9
chapter outline
Chapter 2. Requirements
Definition of Terms
2.1
To allow for a common understanding a definition of terms forms the beginning of this chapter. If not stated otherwise in a particular section, these definitions are valid throughout the whole thesis. The MNM Service Model [GHH+ 01, GHK+ 01, GHH+ 02] which is a generic model for IT service management is used to motivate most of the basic term definitions. This model has been proposed by the MNM Team due to the lack of a common understanding of the term service.
basic roles
In the model a distinction is made between customer side and provider side of a service. The customer side contains the basic roles customer and user, while the provider side contains the role provider. The provider makes the service available to the customer side. The service as a whole is divided into usage and management sides which are accessed by the role user and the role customer from the customer side, respectively.
main views
The model consists of two main views. The Service View (see Fig. 2.1) shows a common perspective of the service for customer and provider. Information that is only important for the (provider-internal) service realization is not contained in this view. For these details another perspective, the Realization View, is defined (see Fig. 2.2).
side independent
customer side
MNM Service Model
customer domain
accesses
«role»
«role»
user
customer
uses
manages
uses
CSM client
concludes
accesses
service agreement
service
substantiates supplies
service access point implements
provider side
uses
service client
supplies
usage functionality realizes
QoS parameters observes
management functionality realizes
CSM access point
implements
concludes
provider domain
manages
service implementation provides
service management implementation directs
«role»
provider
Figure 2.1: MNM Service View [GHH+ 01] Service View
The Service View contains the service for which the functionality is defined for usage as well as for management. There are two access points (service access point and customer service management (CSM) access point) where user and customer can access the usage and management functionality, respectively. Associated to each service is a list of QoS parameters which have 10
2.1. Definition of Terms to be met by the service at the service access point or at the CSM access point if they are related to a management functionality. The QoS monitoring is performed by the service management. side independent
implements
realizes
observes
realizes
implements
concludes
provider domain
manages
service implementation provides
service management implementation directs
«role»
provider sub-service client
resources
uses
uses
service logic
basic management functionality manages
uses
manages
uses
service management logic
acts as
service client accesses
uses
sub-service management client
acts as «role»
«role»
user
customer
uses
manages
uses
concludes
CSM client accesses
side independent
Figure 2.2: MNM Realization View [GHH+ 01]
In the Realization View the service implementation and the service management implementation are described in detail. For both, there are providerinternal resources and subservices. For the service implementation a service logic uses internal resources (e.g. devices, knowledge, staff) and possibly external subservices to provide the service. Analogously, the service management implementation includes a service management logic using basic management functionalities [HAN99] and external management subservices.
Realization View
The MNM Service Model can be used for a similar modeling of the used subservices, i.e., the model can be applied recursively. The modeling allows for the organization-internal provisioning of subservices or for their subscription from third-party providers.
provider hierarchies
The following terms are defined with respect to this model. Service: In contrast to other definitions where a service is limited to a specific domain (e.g. telecommunications) or technology (e.g. Web Services), a service is defined here in a generic way. A service is a set of functionalities that are offered by a service provider to a customer at a customer provider interface. The customer may allow a set of users to access the service at the service access point. Quality issues of the service operation are laid down in SLAs. Service operation is based on resources and may involve using other services called subservices. Subservice: A service that is used by other services. This service can also be offered to customers or can only be provider-internal. The recursive use 11
Chapter 2. Requirements of subservices makes it possible to form provider hierarchies. Resource: A resource is used by services for the service operation. As a service is regarded as an abstraction over the underlying resources, a service failure has to be located not in the service itself, but at least in one of its resources. A resource can e.g. be a network link, an end system, main memory, a hard disk drive, an application process, or a workflow. The MNM model is not specific about the modeling granularity which can therefore be chosen according to the requirements of a given scenario. An end system could be modeled as a single resource or it could be divided into hardware items, software processes, etc. Provider: A provider offers IT services to customers. The provider himself can act as customer when having subscribed subservices offered by other providers. Customer: A customer subscribes IT services. He grants the possibility to use them to a set of users. A customer interacts with the service management using the CSM access point. CSM access point: The customer provider interface is the access point for service management functionalities between customer and provider. It allows for the exchange of information like the order of new services, access to service performance reports, or the exchange of fault management information. It is also called CSM access point since CSM means to filter and enrich management information which a provider already has with respect to the customer needs. User: A user accesses the service subscribed by its corresponding customer at the service access point. Service access point (SAP) : A user can access the service usage functionalities at the service access point. Service level agreement: An SLA is a contract between customer and provider. For each service it contains a set of parameters with thresholds. These parameters are designed to model the quality of the service in question. The provider guarantees to meet the agreed thresholds with respect to certain time intervals (e.g. an availability of 99% on a weekly calculation basis). Otherwise, SLA violation penalties have be paid to the customer. Apart from these service-related terms another set of terms is introduced with respect to fault management. At first, it is necessary to differentiate between the traditional fault management on the resource level and the one on the service level. Resource fault management: Resource fault management is deviceoriented and deals with events, faults, and errors in the network and end systems. The treatment of faults does not happen with direct 12
2.1. Definition of Terms consideration of service performance as the scope is limited to the performance of the network and end systems. Therefore, an assurance of customer expectations is not achieved. An example of this is a wrong configuration of a firewall which prevents a user from accessing the services. In a pure resource fault management perspective this problem is not detected because all resources are working properly. Service fault management: In contrast, service fault management takes care of the service performance with respect to customer expectations. Service quality degradations are mapped onto underlying resources to identify resource problems. It is part of service level management (SLM) which deals with the monitoring and management of service quality. Some important fault management related terms which are originated from resource fault management are modified and extended towards service fault management in the following. Fig. 2.3 depicts the relationship between these terms. event directly handled fault
results in
error observable from outside failure
symptom manifests as
alarm observed as
Figure 2.3: Fault management related terms
Event: In network management an event is an exceptional condition occurring in the operation of the hardware or software of the managed network [JW93, YKM+ 96]. Here, this definition is extended to comprise exceptional conditions in applications and end systems. Please note the different use of the term in the context of event correlation. Fault: Faults (also referred to as root problems) constitute a class of events that can be handled directly [JW93, YKM+ 96]. Faults may be classified according to their duration time as: (1) permanent, (2) intermittent, and (3) transient [Wan89]. A permanent fault exists in a service operation infrastructure until a repair action is taken. Intermittent faults occur on a discontinuous and periodic basis, causing degradation of service for short periods of time. However, frequently re-occurring intermittent faults significantly jeopardize service performance. Transient faults cause a temporary and minor degradation of service. They are usually repaired automatically [Wan89]. 13
fault management terms
Chapter 2. Requirements Error: An error, a consequence of a fault, is defined as a discrepancy between a computed, observed, or measured value or condition and a true, specified, or theoretically correct value or condition [Wan89]. Faults may cause one or more errors. Some errors result in a deviation of a delivered service from the specified service that is visible to the outside world. The term failure is used to denote this type of error. Other errors are not visible externally. However, an error in a network device or software may cause the malfunctioning of dependent network devices or software. Thus, errors propagate within the network causing failures of faultless hardware or software. In order to correct an error, the fault which caused the error has to be resolved; therefore, errors are typically not handled directly. Symptom: Symptoms are external manifestations of failures [JW93]. They are observed as alarms - notifications of a potential failure [JW93, YKM+ 96]. These notifications may originate from management agents via management protocol messages (e.g., SNMP traps), management systems, which monitor the network status, e.g., using commands such as ping, system log-files, or character streams sent by external equipment. In a service-oriented context user symptom reports can also be regarded as a kind of alarm. Some faults may be directly observable, i.e., they are faults and symptoms at the same time. However, many types of faults are unobservable due to (1) their intrinsically unobservable nature, (2) local corrective mechanisms built into the management system that destroy evidence of fault occurrence, or (3) the lack of management functionality necessary to provide indications of fault existence. Examples of intrinsically unobservable faults include livelocks and deadlocks. Some faults may be partially-observable - the management system provides indications of fault occurrence, but the indications are not sufficient to precisely locate the fault. Please note that events and faults can be related to resources only, while the other terms can relate to resources or services. The term event correlation as used in the literature should properly be called alarm correlation with respect to the definitions that have been given. The same holds for the terms service events and resource events introduced later which are going to denote servicerelated alarms and resource-related alarms. fault management phases
Fault management is usually divided into different phases in the following manner which apply to resource fault management as well as service fault management. Fault detection: In the fault detection phase an abnormal behavior is detected requiring further investigation. The detection can happen in a passive or active manner, i.e. by passively monitoring the operation or by actively testing the functionality. 14
2.2. Service Management Scenario at the Leibniz Supercomputing Center Fault diagnosis: In the fault diagnosis phase configuration information is used to identify one or more components as being the root cause of the abnormal behavior. To ease the diagnosis it is often assumed that only one root cause exists at a given point in time. Fault recovery: In the fault recovery phase the functionality is restored. This can be done by directly fixing the problem at the root cause component or by installing an alternative solution which may be temporary (workaround).
2.2
Service Management Scenario at the Leibniz Supercomputing Center
In addition to the offer of high performance computing facilities for Bavaria and Germany, the LRZ is also the joint computing center of the Munich Universities. It runs the Munich Scientific Network (MWN) which links universities and other research institutions in the region of Munich and Southern Bavaria to the global Internet. In this network, which currently comprises more than 60,000 computers, the LRZ also acts as an IT service provider.
Leibniz Supercomputing Center
Out of these services the Web Hosting Service and the E-Mail Service have been selected as examples. These services are described in the following including the service functionalities and the dependencies which exist in the service realization. Common service symptoms together with possible root causes are given later on. Since the services are used as part of the motivation for the requirements (Section 2.4), a reasoning of their representativeness is made. Further details about these services can be also found in Chapter 6 where the solution which is developed in this thesis is applied to them.
example services
2.2.1 Web Hosting Service The Web Hosting Service [LRZb] is an offer of the LRZ for smaller research institutions to host their web sites at the LRZ. It is also called Virtual WWW Server as it should give the appearance to hosted web sites as if each research institution has its dedicated web server. Currently, approximately 350 institutions are customers of this service (a customer and server list can be found at [LRZd]).
service overview
Provided functionality and QoS parameters The usage functionality for end users is to display web pages of the customer’s institution. The pages can either be static or dynamic. Static means that the content of the pages are fixed documents which are loaded on page access. In contrast, dynamic
usage functionality
15
Chapter 2. Requirements web pages are created on demand usually applying some situation dependent information (like time, user IP address). While the pages are usually accessed via HTTP, there can also be protected areas within the web content which can only be accessed via HTTPS and may require passwords. In doing so, the customer can limit the access from arbitrary users to registered users and is able to provide personalized content. management functionality
The management functionality of the service offers the possibility to transfer new content to the LRZ for display. This content may include static web pages and scripts to dynamically generate content. The pages can make use of software support provided by the LRZ, in particular for CGI scripts, PHP scripts, and Zope applications.
virtual server set up
For setting up a hosted web site at the LRZ a relatively simple online form has to be completed if an account for the customer already exists. A subdomain of certain Munich scientific domains has to be chosen for the hosted web site. In addition, it is possible to choose an arbitrary domain for the virtual server if the customer owns this domain (and pays for it). Neglecting this optional domain charge the service is provided without any payments for scientific purposes. After the completion of the online form the server is made available automatically within 24 hours. The default disk space for the server is 1 GB, but it can be enlarged on demand with permission of the LRZ.
QoS parameters
Availability of the service and page access delay are QoS parameters for this service. For the management perspective fault repair time and transfer times for new content are examples of QoS parameters which could be part of SLAs.
Dependencies The Web Hosting Service makes use of several subservices and resources. The resulting dependencies are depicted in Figure 2.4 which is divided into dependencies of the Web Hosting Service on subservices in the upper part and into the direct dependencies of the service on its resources. A few indirect dependencies which exist to resources and subservices of subservices are depicted. Even though only a few of these dependencies are given and also a potential differentiation of dependencies for the different functionalities being offered is not done, the complexity in the service realization becomes apparent. More details are given in Section 6.2.1 and in its Fig. 6.1. subservices
A subservice of the Web Hosting Service is the Storage Service which stores the code for static and dynamic web page delivery using different file systems and databases. The DNS (Domain Name System) Service is being used to find the location of hosted web pages in the first place. The Web Hosting Service also depends on the basic Connectivity Service (an abstraction over the network connections) to get access to the hosted pages. When a user accesses a hosted web site via one of LRZ’s virtual private networks, the Virtual Private Network (VPN) Service/Proxy Service is also used. These services are regarded as subservices of the Connectivity Service. Furthermore, the customer’s access to change the stored web pages requires the LRZ’s Authentication Service and is also limited by the Firewall Service. 16
2.2. Service Management Scenario at the Leibniz Supercomputing Center The resources of the Web Hosting Service include six redundant servers for hosting the pages, two servers for the Webmail pages, an emergency server to display a maintenance page if needed. It also makes use of Apache web server applications running on the servers. Two special servers are available for Zope applications. The Storage Service makes use of AFS (Andrew File System), NFS (Network File System), and several databases. The Connectivity Service provides the network connections between the devices. Its makes use of the Internet router and server load balancers for this purpose. However, the configuration of these components for the use by the Web Hosting Service (e.g. how the load balancing among the redundant servers is performed) makes it necessary to consider these components with direct relation to the Web Hosting Service. Services: Web Hosting Service
DNS Service Firewall Service
Storage Service Authentication Service
Connectivity Service Proxy Service
VPN Service
Resources: Internet router
load balancer
static web pages
AFS
load balancer
NFS webmail server
DB network
emergency server
webmail server Zope server
dynamic web pages
Zope server
server
server
server
server
server
server
server
server
hosting of LRZ’s own pages
six redundant servers
Figure 2.4: Dependencies of the Web Hosting Service
Common symptoms and faults There are some typical symptoms which may occur in the service operation of the Web Hosting Service. A selection of them is detailed in the following together with potential root causes. Web page not reachable: When a hosted web page cannot be displayed, this symptom can be caused by several faults. If several pages of the customer cannot be displayed, it should be investigated whether other sites on the Internet can be accessed. If this is not possible, a fault in the network 17
resources
Chapter 2. Requirements connectivity is likely. Otherwise, the hosted web site may currently not be provided by the LRZ or the DNS resolution does not work. If one page is not reachable, but other pages of the same customer domain are accessible, the customer may have changed the URL of the page in question or there may have been a fault when storing the page content at the LRZ. Web site access slow: A slow delivery of hosted web sites may be caused by network connectivity problems. Either the network bandwidth is low (e.g. if a modem is used for network access) or a high utilization along the network path only allows for a small number of packets being transferred. A high network utilization may be caused by many network users, transfer of high volume data for scientific purposes, or malicious network usage (e.g. denial of service (DoS) attacks). Another possibility for slow page delivery of dynamic web pages are high CPU loads on servers generating the dynamic web pages. Outdated page content: The content of a hosted web page may not be upto-date anymore which may become obvious via time stamps in the page. Apart from the possibility that a customer may have forgotten to transfer new content to the LRZ, caching of web content may have led to this situation. Caching can be performed on the user side (in the user’s web browser) or at the LRZ for reducing the delivery time of frequently demanded pages. In addition, a fault when storing the updated page at the LRZ Storage Service could be a reason for the provisioning of outdated content. Unexpected page content appearance: The content of a web page may have an unexpected appearance in the user’s web browser. This may be caused by problems with the HTML (Hypertext Markup Language) version, character encoding, or absent/disabled dynamic content generation methods (cookies). Furthermore, the generation of dynamic content at the LRZ may be the root cause as there may be problems like inconsistencies in new PHP (PHP Hypertext Processor) libraries. In summary, it can be witnessed that typical symptoms have a variety of potential underlying root causes. Apart from LRZ-internal faults it has be taken into account that symptoms can also arise from wrong service usage by users and wrong service administration by customers.
2.2.2 E-Mail Service service overview
The LRZ E-Mail Service [LRZa] provides electronic mail services for more than 100,000 students and staff of the Munich Universities and the LRZ itself. Out of these potential users more than 85,000 have an e-mail account at the LRZ and 198 e-mail domains are mapped to the LRZ. Even though no formal SLAs are offered for this service, the amount of users who are accessing this 18
2.2. Service Management Scenario at the Leibniz Supercomputing Center
weekdays sa./su./holidays
mail total 1,000 900
accepted 180 (18%) 120 (13%)
accepted with delay 4 (2.2%) 1 (0.8%)
rejected by graylisting 820 (82%) 780 (87%)
Table 2.1: Amount of e-mails at the LRZ in 2005 (base unit 1,000) [LRZ06]
service requires a high service quality. Table 2.2.2 shows the average amount of e-mails being received on a daily basis. In terms of the MNM Service Model the Ludwig-Maximilians-Universit¨at M¨unchen (LMU) is customer of the service, while LMU students and staff are users of the service. Strictly applying the model a student who creates an e-mail account via a web form acts as a customer because this action is not a use of a usage functionality. Nevertheless, these actions can be regarded to be in accordance with the LMU since the LMU has provided some credentials to the student allowing her to do so.
roles for the service
Provided functionality and QoS parameters The functionality of the EMail Service can be divided into the retrieval of e-mails from the LRZ which have been received by the LRZ previously and the sending of e-mail. There are some constraints in the usage of the service which have evolved from security considerations. For each e-mail it is checked whether it contains an attachment which is directly executable in Microsoft Windows operating systems. In this case these e-mails are deleted. A hard limit for the maximum size of e-mails (30 MB) has also been introduced because SMTP (Simple Mail Transfer Protocol) has not been optimized for huge data transfers. A loss of the underlying TCP (Transport Control Protocol) connection does in particular lead to a retransmission of the whole e-mail from the beginning.
usage functionality
Apart from the possibility to access the service via a mail client such as Mozilla Mail/Thunderbird or Microsoft Outlook, the service can also be accessed via one of the LRZ’s webpages [LRZc]. The management functionality of the service allows for the creation of new mailboxes, change of passwords, registration of forward addresses, configuration of spam filtering options, etc.
management functionality
QoS parameters for the service usage are availability, intra-domain e-mail delivery times, delay for mailbox access. Apart from guarantees on fault repair times the configuration times for creating mailboxes could be part of SLAs for the management side.
QoS parameters
Dependencies The LRZ E-Mail Service is provided using services and resources which is shown in a similar manner as for the Web Hosting Service in Fig. 2.5. More information can be found in Section 6.2.1 and in its Figure 6.7. 19
Chapter 2. Requirements Services: E−Mail Service
DNS Service Firewall Service
Web Hosting Service Storage Service
Connectivity Service VPN Service
Authentication Service
SSH Service Proxy Service
Resources: Internet router webmail server
LDAP server
network
webmail server other servers
server
server
server
server
server
server
server
server
server
server
server
server
server
server
server
server
server farm (mailin, mailout, spam check, virus check, graylisting, testing)
Figure 2.5: Dependencies of the E-Mail Service subservices
Subservices of the E-Mail Service are Storage Service for storing incoming mail and the Connectivity Service for accessing the mail servers. Similar to the Web Hosting Service DNS and Firewall Service are also used. In addition, SSH Service may be applied for secure transfer of e-mails. It is regarded as additional subservice of the Connectivity Service. For the Webmail access to e-mails there is also a dependency on the Web Hosting Service which hosts the web pages of the Webmail portal. The LRZ Authentication Service is needed for accessing the user’s mail folder and for sending e-mail.
resources
The main resources of the E-Mail Service are located in a server farm where servers exist for incoming and outgoing mail as well as for processing steps such as spam filtering, virus checking and for the graylisting protocol. The access to e-mails via Webmail in particular depends also on the Webmail servers. Some additional servers such as LDAP (Lightweight Directory Access Protocol) servers are located outside the server farm. Furthermore, the network connectivity has to be taken into account. Common symptoms and faults In [Ber04] typical symptoms which have occurred in the operation of the E-Mail Service have been analyzed and grouped. The purpose of this work has been to generate query trees which can be traversed in order to gather information needed for symptom (pre)classification. Some typical symptoms together with their potential 20
2.2. Service Management Scenario at the Leibniz Supercomputing Center causes are given in the following. Mail not received: A user expects an e-mail from somebody, but there is no matching e-mail in the inbox folder. Explanations for this symptom could be that a network connectivity problem prevents the transfer of the e-mail to the LRZ’s incoming mail server. The user’s expectation of the mail delivery might be wrong or the mail has been classified as spam by the user’s mail client. Furthermore, graylisting may introduce an additional delay when the external e-mail server is maybe not trustworthy. Access to inbox not possible: If the user cannot access the inbox for retrieving new e-mails, several reasons are possible. The user authentication may fail and there can be problems with the network connectivity. The configuration of the e-mail client can be wrong (e.g. containing a typing mistake in the server address). Sending of e-mails not possible: For failures in sending e-mails network connectivity problems to the outgoing mail servers and authentication problems can be responsible. Webmail problems: If the E-Mail Service is accessed via Webmail, additional symptoms can arise similar to the ones in relation to the Web Hosting Service usage functionality. While the previous symptoms are related to the usage functionality, symptoms can also occur in managing the service. An example for this is given is the following situation. Account creation failed: A new user would like to create an account, but the credentials are not accepted. Reasons for this can be a typing mistake by the user, false or delayed transfer of user data to the Authentication Service, and connectivity problems to the Authentication Service.
2.2.3 Representativeness of the Examples The discussed services have been chosen for the following reasons. The services are not artificial services, but form a real world service management scenario. Even though no SLAs are in place for them, they are used by a lot of users requiring their reliable operation. The services have been provided for a longer period of time, so that a good basis of experience could already be gained. This especially includes information about symptoms and faults which occurred in operation together with the documentation of their processing.
real world scenario
The services are interesting because they offer several QoS parameters. Apart from usual parameters like availability and access delay, they also offer specific parameters. These parameters need special attention as they introduce a lot more complexity for the service management when having to make sure that they are not violated.
QoS parameters
21
Chapter 2. Requirements dependencies
In the scenario there is a variety of dependencies on other services and on resources. Even though the subservices in this case are basically provided by the LRZ itself, it is easily possible to assume that third-party providers are involved. This would mean that some information about underlying subservices and in particular their resources would not be available.
genericity aim
Even though a particular solution for these services would also be of interest, the work of this thesis aims to improve the service fault diagnosis for a general scenario and therefore does not make use of particular features of the example services.
2.2.4 Current Service Fault Diagnosis Process at the
LRZ symptom reporting with the Intelligent Assistant
Fault management at the LRZ for the presented services is currently performed as follows (see Fig. 2.6). A user who experiences a symptom when using the provided services can either contact the LRZ Service Desk directly or can use the web-based problem preclassification tool Intelligent Assistant (IA) (see Section 3.3.2). This tool guides the user to traverse a query tree composed of questions (e.g. how the user accesses the service) and tests (e.g. component ping tests) to gain a symptom preclassification and in some cases already a solution. In the latter situation the result is only reported to the user, while it is forwarded to the service management staff, otherwise. Currently, the IA is limited to connectivity problems and issues concerning the E-Mail Service so that direct contact with the service desk is needed for other kinds of symptoms.
LRZ Service Desk
If a symptom is reported to the service desk, it can sometimes already be resolved at this stage if the user has made a mistake in the service usage or if the symptom is already known and its resolution is under way. In this case a so called quick ticket is generated for internal review purposes which briefly describes the incident. Otherwise, a trouble ticket (see Section 3.4.9) is opened using the trouble ticket system BMC Remedy ARS (Action Request System) [BMCa] to delegate the symptom treatment to other employees responsible for the service. For generating the trouble ticket another installation of the IA for internal purposes can be used.
problem resolution by service staff
Employees who are responsible for the management of the specific service can access management tools like HP OpenView NetworkNodeManager [HP b] and InfoVista [Inf] or examine log files to find the fault. If the symptom’s root cause could not be solved by the LRZ itself, the symptom may be further escalated towards tool and equipment vendors. The root cause of the symptom is reported to the service desk via the trouble ticket and the user is informed about the service status and symptom resolution.
partial automation of service desk
In summary, it can be concluded that the fault diagnosis workflow at the LRZ is only partially automated. At the service desk information from the user is put into a standardized format (trouble ticket) which would allow for au22
2.2. Service Management Scenario at the Leibniz Supercomputing Center user
LRZ service desk
service management staff
experiences symptom when using service [unfamiliar with IA]
[familiar with IA]
report symptom via phone or e−mail
prediagose symptom with IA (user version)
check if user mistake or known problem (potential use of LRZ internal IA version) [user mistake or known problem]
generate quick ticket [identification of user mistake]
application of usage instructions
report to user [LRZ internal problem]
[LRZ internal problem] generate trouble ticket
generate trouble ticket
assign to service management staff diagnose symptom using management tools report back fault recovery report back service status and problem resolution
Figure 2.6: LRZ fault diagnosis workflow
tomated processing of the information. If the IA has been used, the trouble ticket is generated automatically which reduces the work for the service desk staff. However, there is no automated possibility to check whether the symptoms are already known. Information about planned maintenance is distributed via e-mail and has to be compared with the current trouble report manually. The further steps of the trouble ticket processing rely very much on the operation staff and are hardly automated. Some testing scripts exist, but the experience which steps need to be taken is usually only known to the operation staff. In addition, configuration information is focused on the network and systems configuration, but the service configuration is not available in a standardized format which is a prerequisite for automation. Most of the LRZ employees are involved in day-to-day service operation which sometimes makes it difficult to address the provisioning of new services.
23
service fault diagnosis not automated
Chapter 2. Requirements ITIL compliance
In [Hin06] the LRZ Service Desk was evaluated in comparison to the requirements of the ITIL Incident Management Process (see Section 3.1.1). While the process itself is basically well-structured, the management of changes and configuration is neglected to a great extent. The quality assurance of the process is not carried out so that no information is available about the number of incidents solved at the hotline directly and about the user satisfaction. The Incident Management Process itself is not documented in a formal manner.
2.3
Generic Scenario for Service Fault Diagnosis
For the classification of the requirements and for the grouping of related work, a generic scenario for service fault diagnosis is outlined in this section. It is depicted in Fig. 2.7. customer service management
service symptom reporting 2.4.3
supplier’s customer service management
2.4.1 service management 2.4.5
2.4.1 service problem diagnosis 2.4.4
2.4.2 service management information
2.4.1 resource management
resource problem diagnosis 2.4.4 2.4.5 resource fault recovery
2.4.2 resource management information
Figure 2.7: Generic service fault diagnosis framework (the numbers refer to section numbers where requirements related to the elements are specified) provider perspective
In the scenario the role of a provider offering IT services is adopted. Some SLAs have been agreed for the service operation which impose constraints on the provider to deliver high quality services. These constraints usually define time limits to be met.
kinds of dependencies
Three kinds of dependencies can be distinguished in the scenario. Interservice dependencies denote relationships between services and other services (subservices). The subservices can be organization-internal or can be 24
2.3. Generic Scenario for Service Fault Diagnosis provided by external suppliers. Service-resource dependencies exist between services and resources and describe the realization of the service making use of the provider’s own resources. Inter-resource dependencies relate to the resource level where they specify the relationship among resources. To allow for the communication with customers, a CSM has to be in place as depicted in the upper part of the figure which contains a reporting interface for service symptoms. The CSM will presumably also comprise other components like a reporting tool towards the customer about the current SLA status. As the provider would like to notice service problems prior to customers, virtual users can be installed which perform user interactions and/or the code which is running at the user side can be instrumented to collect and transfer monitoring information. If a virtual user instance notices a service quality degradation, this report can be treated in a similar manner to a real user report. Together with the provider-internal monitoring it is therefore possible to distinguish three kinds of monitoring which are depicted in Fig. 2.8.
customer service management
user virtual user for external monitoring
access via instrumented client
customer side
service access points service
internal monitoring
provider side
Figure 2.8: Three kinds of service monitoring: instrumented code, virtual users, internal monitoring
The service symptom report is transferred to the provider’s service management where a service fault diagnosis component is required which is in the focus of this thesis. For successful operation this component has to access service management information. This information has to comprise the current service configuration (e.g. which other services and resources are involved in the operation of a service in question), current service status information, customer SLAs, etc. For automation it is necessary that this information is provided in a standardized format and reflects the current situation including all required information. Apart from being a prerequisite for automation, the representation of knowledge allows the provider to be more independent from staff experience which can be temporarily or permanently unavailable if staff members are ill, on holiday, or have left the organization.
service fault diagnosis
The symptom can either be caused by the resources of the service or by the resources of underlying subservices. If subservices are subscribed from suppliers, the provider has to contact the suppliers using their CSM interfaces.
supplier CSM
25
Chapter 2. Requirements resource fault diagnosis
For examining the function of the provider’s own resources a resource management is also required containing a component for fault diagnosis. Like in the service management layer an appropriate information base is mandatory with respect to network and end systems configuration.
fault diagnosis output
For the fault diagnosis it can be assumed that some diagnosis steps at the beginning can be automated (e.g. to collect necessary information), while later steps have to be carried out by the operation staff. The output of the automated service fault diagnosis is a list of resources which are presumed to be the symptoms’ root cause. This list has then to be checked by the staff members. The output of the fault diagnosis can be input to other fault management operations, in particular for impact analysis of the current fault to decide about recovery actions.
2.4
Requirements Derivation
Derived from the scenario and from general considerations the following requirements need to be addressed. The section numbers refer to the numbers in the generic scenario figure (Fig. 2.7). Apart from the specific requirements outlined in the sections, three requirements are general and therefore valid for all parts of what is addressed. applicable for all kinds of services
G1: Genericity The resulting methodology for service fault diagnosis shall be applicable for all kinds of services, even though it can be assumed that it will not be beneficial for all services to the same extent. This means that it has to be independent from a specific technology like Ethernet or implementation techniques like Web Services. It should also allow for provider hierarchies as some subservices may be provided by third party providers. The genericity is needed to make the methodology adoptable for many service provisioning scenarios. It is therefore a consequence of the generic framework.
scalable for different service size dimensions
G2: Scalability Another general aim which is to some extent related to the genericity is scalability. The genericity includes the applicability of the approach to different kinds of services which can differ in several aspects like number of users, number of subcontractors, number of functionalities, QoS parameters, etc. The scalability requirement means that a solution shall be adaptable to complex environments having still acceptable performance characteristics, in particular with respect to the resolution time and effort required.
26
2.4. Requirements Derivation G3: Low effort Due to the complexity of service management that is encountered in many scenarios, an efficient way to deal with this complexity is needed. This is crucial to have low effort to maintain the service fault diagnosis. For example, changes in the infrastructure should not require a lot of manual changes in the necessary information bases.
maintenance effort
This requirement arises from the aim to save the overall employee time spent on the service fault diagnosis which consists of the time spent on the diagnosis itself and the time needed for maintaining the diagnosis tool (e.g. keeping its information base up to date).
2.4.1 Workflow Requirements The workflow which has to be designed for the fault diagnosis has to address the following requirements.
W1: Workflow granularity The workflow has to describe the steps being performed during the service fault diagnosis appropriately. For the decomposition into steps a suitable granularity has to be found for which the following trade-off has to be considered. Defining only few steps may lead to ambiguities in applying the workflow, while a fine-grained modeling will require a lot of effort for applying it to a given scenario. Therefore, a generic definition of steps together with a methodology to refine them for a given scenario is required.
granularity trade-off
The workflow that should be detailed is the one identified in the generic scenario. For this workflow it is necessary to know how the components interact and which kind of information needs to be exchanged. This description has to remain generic for the general case where e.g. no assumptions about tools can be made to be applicable to all kinds of services (compare G1). However, in a concrete scenario like the LRZ services it needs to be further detailed knowing the services and tools being used.
detailing of general scenario workflow
W2: Techniques and tools For the implementation of a workflow it is helpful if techniques for carrying out some of the steps are provided. This can range from mentioning existing techniques to detailed recommendations for their application. The latter option is certainly preferred if these recommendations are not specific for a certain scenario. In addition, it is desirable to have tool support for the workflow itself.
tool support for diagnosis steps and workflow execution
W3: Cross-layer interaction In the generic scenario it can be seen that the workflow is not limited to service management, but has interactions with the CSM and resource management. This means that the information exchange between the layers has to be performed with respect to the tasks of these layers.
collaboration among management layers
27
Chapter 2. Requirements relation to network and systems management
In particular, the fault diagnosis has to be carried out with respect to the fault management methods being available for the network and systems management. As this area has been subject to research for a long time so that a variety of management solutions is already available, the workflow has to be capable of collaborating with such solutions.
relation to enterprise and business management
In addition, the workflow has to be compliant with enterprise and business management to ensure that aims on these levels (business objectives) with respect to fault diagnosis are fulfilled. For example, new QoS parameters or service functionalities may be introduced which also have implications on the fault diagnosis. The steps to change the fault diagnosis workflow accordingly have to be provided in an easy-to-use manner.
monitoring of business objectives
W4: Workflow monitoring When the service fault diagnosis workflow is introduced for a set of services, the provider would like to make sure that a benefit is actually achieved. Therefore, means to compare the situation before and after the application of the approach as well as during the continued operation have to be provided. In addition, the benefit should be measurable during or shortly after service fault operations to allow for continuous improvement.
metrics specification
For doing so, some metrics have to be defined since it is difficult to directly measure the fulfillment of business objectives at this stage. These metrics should in particular be related to time conditions that the approach seeks to fulfill.
2.4.2 Management Information Repositories The framework and workflow for fault diagnosis are based on repositories for service management information. As shown in the description of the generic framework, this is needed for the automation of the workflow operation. In addition, it improves the reliability of the service fault diagnosis by reducing the dependency on employees’ experience. The information modeling has to address the following aspects. management information required
M1: Scope of managed objects The management information repositories have to contain all kinds of managed objects which are dealt with in the service fault diagnosis. This means that information about services, subservices and resources needs to be considered. The following criteria specify which attributes and related information also need to be contained. M2: Fault diagnosis attributes The attributes needed can be differentiated between service-specific and resource-specific ones.
28
2.4. Requirements Derivation M2a: Service attributes For the services an overview is contained in the list below. Apart from attributes for service features, information about the configuration of a service is also required. It is necessary to administer the existing dependencies on other services and resources (see also M3) as well as the configuration for monitoring and maintaining the service. Together with information about the service health, the latter information is needed to classify symptoms as related to a known root cause. Attributes related to the service life cycle are useful to manage the frequent changes in the service operation (e.g. for managing the point in time when a service should become operational).
service-related knowledge
• Service functionalities • Service access points • QoS parameters • SLAs including specified QoS parameters, fulfillment history • Subservices and resources used • Current service health • Service monitoring and testing information • Service maintenance information • Service life cycle attributes No limitations should arise from the modeling of these attributes. For example, some approaches for fault management (see Section 3.4) assume that there is only one root cause for all symptoms at a given point in time. This assumption is made to simplify the fault diagnosis procedure. However, such an assumption cannot be made for the general framework scenario.
diagnosis method agnostic specification
M2b: Resource attributes For the resources the following attributes have to be available. In addition to information similar to the services, information about possible faults should be contained. It should include typical symptoms and hints for backup solutions and workarounds.
resource knowledge
• Resource dependencies • Status and performance • Scheduled maintenance • Possible faults (including symptoms, backup solutions)
29
Chapter 2. Requirements dependency features
M3: Dependencies An important aspect of the information modeling are dependencies which are highlighted with this special requirement. As shown in the generic scenario, there are three kinds of dependencies: Interservice dependencies, dependencies between services and resources, and inter-resource dependencies. These are also depicted in Fig. 2.9. The features of these dependencies have to be modeled in order to track down from a high-level symptom report to a resource failure. provider services
subservices
resources
inter−service dependency service−resource dependency inter−resource dependency
Figure 2.9: Three kinds of dependencies: Inter-service dependencies, serviceresource dependencies, inter-resource dependencies
It should be noted that the aim of this thesis is not to provide methods for finding dependencies and that it is therefore assumed that dependencies are given as desired. To justify that this assumption can be made, literature references for finding dependencies are given in Section 3.2. In Fig. 2.10 different aspects for the modeling of dependencies are depicted which lead to detailed modeling requirements in the following. M3a: Type of dependency This aspect is related to the already mentioned differentiation between the three kinds of dependencies. All of these dependencies have to be modeled with characterizing attributes. M3b: Functionality differentiation Similar to the workflow modeling, a trade-off has to be found for the depth of management information modeling. On the one hand, a detailed modeling will be helpful to get accurate fault diagnosis results, but on the other hand the maintenance effort may become too high.
30
2.4. Requirements Derivation Type of dependency service level
formal model Formalization degree
Functionality differentiation
service− resource
textual/pseudocode no forma− lization
functionality split−up
resource level
whole service organizational
functional
Dependency level
Redundancy static
Design
isolated dependency
Negotiation dynamic
linked dependency
Provisioning Usage Deinstallation
Dynamic
Life cycle phase
Figure 2.10: Dimensions of dependencies [HMSS06]
In particular, a trade-off exists for a service and its functionalities. It can be said that a service functionality of one service depends on a service functionality of a subservice instead of a service being dependent on a subservice (compare Fig. 2.11). Obviously, this more fine-grained modeling may be helpful to show that some dependencies are not present in the current situation. The information modeling should be flexible to allow for different levels of granularity. a)
Service 1
depends on
Service 2
b)
trade-off for functionality modeling
Service 1
service functionalities
depends on
Service 2
Figure 2.11: Possible modeling granularities: a) service to service dependencies, b) service functionality to service functionality dependencies
M3c: Redundancies The modeling of redundancies poses a challenge to the dependency modeling because it does not allow to look at dependencies in an isolated manner, but requires to link a set of dependencies. Otherwise, the consequence of a failure of one redundant resource would not be correctly modeled as its functionality is fully or partially sustained by the other resources. The treatment of such an effect is scenario-dependent especially on SLAs. 31
joint view on related dependencies
Chapter 2. Requirements redundancy example
An example is the Web Hosting Service since the service is provided using redundant web servers. It is not obvious how to define a properly working service with respect to these web servers. One possibility would be to define it as working properly if all servers are available, while another possibility may be to define a percentage of them as being sufficient. The actual definition has to be made according to the SLA.
M3d: Service life cycle The dependency attributes should support the service life cycle. This is helpful as the dependencies of a planned service can then be modeled as if the service is already in place allowing for its smooth installation.
time granularity
M3e: Dynamic Time aspects of dependencies refer to tracking dependencies over time. It can be differentiated between the actual access to a subservice so that there is really a dependency at the moment and idle times where no interaction occurs (compare Fig. 2.12). For instance, assuming a large file transfer where a DNS resolution of the file server is only needed at the beginning of the transfer a failure in the DNS after the resolution cannot explain a failure of the file transfer.
time
Service 1 Service 2
Figure 2.12: Interactions between services allowing to differentiate present/absent dependencies relation to redundancy modeling
Time constraints can in particular be helpful for redundancies so that it is stored which redundant resource is actually used. For instance, the above described service operation for the Web Hosting Service uses load balancing between redundant web servers. Therefore, the failure of a certain web server at a given point in time only affects the web page requests being currently processed by this web server. The Information that other page requests have been successfully completed in the mean time (by the redundant servers) may be helpful to identify that the load balancer and some of the servers are working properly. Another important time aspect is to determine when the service was successfully used the last time. Therein, it can be differentiated by user, SAP, and service functionality.
organizational information
M3f: Organizational aspects Organizational dependencies denote relationships that arise from distributing the service management between persons and groups within the organization. This information is needed to know who is responsible for managing the services and resources. 32
2.4. Requirements Derivation
2.4.3 Fault Management Interfaces For the interaction with customers and their users interfaces have to be designed for the exchange of fault management information. This requirement arises from the general framework where the reporting of symptoms from the users is the starting point for the diagnosis. Furthermore, similar interfaces are needed for the information exchange with suppliers.
F1: Symptom reporting function The user must have the possibility to report service symptoms. To allow for the automation of the following workflow steps, the symptom report has to be put into a standardized format. For doing so, the user has to be guided to enrich unspecific fault information like “The e-mail service is unavailable” with additional information, e.g. how the user accesses the service. The collection of information should happen in a user-friendly manner. This means to aim at requesting all necessary information so that no further interaction is needed during the fault resolution, but also that no irrelevant information is demanded.
user interface for symptom reporting
In the LRZ example the IA tool already provides an approach for the standardization by posing questions (and performing tests) to fill out a predefined form. In case the tool does not show a wrong service usage, this form is the basis for further investigations within the LRZ.
reference to LRZ scenario
F2: Symptom prediagnosis When a user reports a service symptom, some checks should be triggered by the user interface so that some reports can already be solved at this stage. It should be checked whether the symptom can be mapped onto information about known maintenance or known errors. However, this kind of prediagnosis should only happen in an unambiguous situation.
mapping to maintenance information
It should be possible to trigger tests for reproducing the reported symptom. This is helpful for verifying the credibility of the symptom report and to gain more information for the diagnosis. If the reproduction of the problem is not possible, further interactions with the user may be useful to further examine the conditions under which the symptom has been witnessed. As the fault resolution shall be automated as much as possible, the accuracy of the input is crucial to the success of the following steps.
symptom reproduction
At the LRZ the IA tool can already be regarded as a step into this direction as the tool also includes component tests. These tests are able to reproduce a symptom within the LRZ’s service operation.
tests as part of IA
F3: Plausibility checks Apart from the problem verification, some plausibility checks may be introduced to prevent the entry of false information which may happen intentionally or non-intentionally. For example, a user statistic can be generated to check whether users complained correctly about
input constraints
33
Chapter 2. Requirements service symptoms. A user authentication may also be useful in some situations.
update or deletion of reports by the user
F4: Change of reports The user needs to have the possibility to access already provided symptom reports in order to change them. For example, the user may have investigated further details why the symptom arises or the quality of the service may have changed.
2.4.4 Service Symptom Diagnosis The service symptom diagnosis is the main step in the workflow as described in the generic framework. The fault management for the LRZ services has shown that the diagnosis itself is based on the experience of staff members, while a trouble ticket system is in place to document the actions which have been made. To improve the situation (also in a general context), the possibilities for automating the diagnosis have to be examined.
learning from diagnosis results
S1: Learning capability Due to the complexity of today’s service implementation, the root cause analysis is likely to be not always accurately configured to deal with the current situation. Therefore, the methodology should support the possibility to learn from a misguided diagnosis to react better in case of reoccurrence of the situation.
matching of service-related symptoms
S2: Early matching Multiple reports concerning the same fault may be reported to the user interface. To minimize the effort for handling these reports, it is desirable to link these reports together as early as possible, to aggregate the given information, and to process the reports in an aggregated manner. For instance, a common message to all users being affected by the underlying root cause could be generated as soon as the root cause is identified.
avoidance of usual tool vendor assumption
S3: Multiple root causes As mentioned for requirement M2a, a single root cause assumption cannot be made for the generic framework. Therefore, the symptom diagnosis has to be able to deal with multiple malfunctioning resources at the same time.
variety of tests
S4: Testing The diagnosis should make use of a variety of tests for improving and verifying the diagnosis result. These tests should make use of the three kinds of monitoring explained in Fig. 2.8 to test the services, but also comprise resource testing. 34
2.5. Summary
2.4.5 Embedding into Overall Management Solution Service fault diagnosis is a part of service fault management which itself is a part of service management. To enable that the developed solution for service fault diagnosis can become a building block for a larger management solution within an organization, its implications for the other management areas have to be taken into account. E1: Impact and recovery management After the identification of the root cause, appropriate recovery actions have to be chosen. An impact analysis methodology can be used to determine the impact of an actual or assumed resource failure onto services and customers together with their SLAs. The impact can then be used to determine which recovery actions should be taken. The outcome of the root cause analysis developed in this thesis can therefore be seen as input for the impact analysis. Furthermore, some information gained during the root cause analysis like affected services and the impact on the reporting customers should also be transferred to the impact analysis. Therefore, the methodology developed in this thesis should allow for such a cooperation to gain a framework for all phases of fault management.
diagnosis output as impact analysis input
E2: Service management The service fault management solution should be designed to become part of an overall service management strategy of the provider. This means that other FCAPS management functional areas should be able to build upon what has been designed for fault management. It is not necessary that e.g. a completely separate own database is built for configuration management since the configuration information is already needed for fault management (see e.g. ITIL’s CMDB approach, Section 3.1). In addition, service level management should closely cooperate with fault management. A close cooperation is also reasonable for security management as security incidents have to be diagnosed similar to fault symptom reports. In some situations it may not be obvious whether a service quality degradation is caused by resource faults or by some kind of security incident like a DoS attack so that the differentiation between security and fault management becomes fuzzy.
embedding into service management framework
2.5
Summary
After a definition of terms for service management and fault management, requirements for a service fault diagnosis framework have been identified in the course of this chapter. The LRZ as service provider and especially its services Web Hosting Service and E-Mail Service have served as examples. They have been used to show real world service configurations and symptoms occurring in the service operation together with the way faults are handled 35
requirements catalog gained from scenarios
Chapter 2. Requirements Requirement category General requirements
Workflow requirements
Management information repositories
Fault management interfaces
Service symptom diagnosis Embedding into overall management solution
Requirement details G1: Genericity G2: Scalability G3: Low effort W1: Workflow granularity W2: Techniques and tools W3: Cross-layer interaction W4: Workflow monitoring M1: Scope of managed objects M2: Fault diagnosis attributes - M2a: Service attributes - M2b: Resource attributes M3: Dependencies - M3a: Type of dependencies - M3b: Functionality differentiation - M3c: Redundancies - M3d: Service life cycle - M3e: Dynamic - M3f: Organizational aspects F1: Symptom reporting function F2: Symptom prediagnosis F3: Plausibility checks F4: Change of reports S1: Learning capability S2: Early matching S3: Multiple root causes S4: Testing E1: Impact and recovery management E2: Service management
Table 2.2: Requirements summary
using state-of-the-art management tools. A generic scenario has been defined to describe the issues to be addressed in an abstract way. This has been done in order not to develop a specific solution for the LRZ, but to provide a generic solution valuable for many service management scenarios. The definition of requirements is based on the generic scenario including some illustrations using the LRZ scenario. The requirements are applied in the next chapter for evaluating the contribution of related work and for performing an assessment of the proposed framework in Chapter 4.
36
Chapter 3 Related Work
Contents 3.1
IT Process Management Frameworks . . . . . . . . . . 39 3.1.1
IT Infrastructure Library . . . . . . . . . . . . . . 39 Incident Management Process . . . . . . . . . . . 40 Problem Management Process . . . . . . . . . . . 43
3.1.2
Enhanced Telecom Operations Map . . . . . . . . 46 Assurance Processes for Customer Relationship Management . . . . . . . . . . . . . . . 47 Assurance Processes for Service Management & Operations . . . . . . . . . . . . . . . . 50 Assurance Processes for Resource Management & Operations . . . . . . . . . . . . . . 51 Assurance Processes for Supplier/Partner Relationship Management . . . . . . . . . . 53 Cross-Layer Processing Example . . . . . . . . . 53
3.2
3.3
3.4
Service and Resource Modeling . . . . . . . . . . . . . . 55 3.2.1
Information Modeling . . . . . . . . . . . . . . . 55
3.2.2
Dependencies . . . . . . . . . . . . . . . . . . . . 58
Fault Management Interfaces . . . . . . . . . . . . . . . 61 3.3.1
Customer Service Management . . . . . . . . . . 62
3.3.2
Intelligent Assistant . . . . . . . . . . . . . . . . 67
Fault Management Techniques . . . . . . . . . . . . . . 69 3.4.1
Model-based Reasoning . . . . . . . . . . . . . . 73
3.4.2
Rule-based Reasoning . . . . . . . . . . . . . . . 75
3.4.3
Codebook Approach . . . . . . . . . . . . . . . . 79
3.4.4
Case-based Reasoning . . . . . . . . . . . . . . . 81
3.4.5
Probabilistic Approaches . . . . . . . . . . . . . . 84
3.4.6
Hybrid Approaches . . . . . . . . . . . . . . . . . 85
3.4.7
Active Probing . . . . . . . . . . . . . . . . . . . 87
3.4.8
Netcool as Example of a Commercial Product . . . 88
37
Chapter 3. Related Work 3.4.9 3.5
3.6
Trouble Ticket Systems . . . . . . . . . . . . . . . 89
SLA Management . . . . . . . . . . . . . . . . . . . . . 91 3.5.1
SLA Specification and Management . . . . . . . . 92
3.5.2
QoS Specification
3.5.3
Impact Analysis and Recovery Management . . . . 96
. . . . . . . . . . . . . . . . . 93
Summary . . . . . . . . . . . . . . . . . . . . . . . . . . 99
chapter motivation
In this chapter related work is presented which is relevant to service fault diagnosis. The aim is to find out whether existing research approaches or commercial products already provide a complete or partial solution to the requirements stated in Section 2.4. The grouping of the related work into sections is done according to the generic scenario in Section 2.3.
examination of process management frameworks
For the required service fault diagnosis workflow it is examined whether process management frameworks which have been adopted by many companies in the previous years already offer a solution for the workflow or whether one or more processes can be detailed for this purpose. This analysis is carried out in Section 3.1.
management information
Service fault management deals with services and resources for which requirements concerning the needed information exist. Therefore, different standards and research approaches are analyzed in Section 3.2. A special focus within the section is set onto the modeling of dependencies due to their importance for the diagnosis.
fault management interface
The service fault diagnosis has to transform user reports into a processable format and therefore needs to have an appropriate CSM interface. As a consequence, related work with respect to the interface design and for supporting the automation of the user report reception and processing is examined in Section 3.3.
fault management techniques
In Section 3.4 fault management techniques which have proven to be useful for network and systems management are examined for their capabilities and adaptability towards the service fault management domain. A focus is set on event correlation techniques as these techniques have been a major step in improving fault management in network and systems management. The examination of work includes research approaches which refer to the diagnosis of services.
embedding into service management
Approaches for SLA management which can make use of the output of service fault diagnosis, i.e. resource failures, to manage SLAs and especially to determine the impact onto services and SLAs are contained in Section 3.5. This work is important to address an overall service management solution for an organization embedding the service fault diagnosis framework developed in this thesis. Finally, a summary of the chapter is given to show where existing standards, products or research approaches can be reused or adapted. It is also pointed out where extensions or new approaches are required. 38
3.1. IT Process Management Frameworks
3.1
IT Process Management Frameworks
In the following IT process management frameworks are examined with respect to the modeling of workflows for service fault diagnosis. The examination of these frameworks focuses on the IT Infrastructure Library (ITIL) and the enhanced Telecom Operations Map (eTOM). These frameworks can be regarded as de facto standards for IT departments in organizations in case of ITIL and for the management of services (not only in the originating telecommunications market) in case of eTOM. Both frameworks can also be applied together.
process management frameworks widely adopted
As other standards do not address service fault management directly, they are only briefly mentioned. COBIT (Common Objectives for Information and related Technology, [COB]) is a framework for control and measurement of the overall use of IT in an organization. It provides a set of tools and guidelines to assess the matureness of major IT processes. Balanced Scorecard [KN96] is a business management tool that enables organizations to transform their business goals into actionable objectives. A survey and classification of these and further related standards is given in [BGH06].
further standards in addition to ITIL and eTOM
3.1.1 IT Infrastructure Library The British Office of Government Commerce (OGC) provides a collection of best practices for IT processes in the area of IT service management which is called ITIL. Its deployment is supported by the work of the IT Service Management Forum (itSMF) [Bon04]. Service management is described by 11 modules which are grouped into Service Support Set (operational processes, [OGC00]) and Service Delivery Set (planning-oriented processes, [OGC01]). Each module describes processes, functions, roles, and responsibilities as well as necessary databases and interfaces. In general, ITIL describes contents, processes, and aims at a high abstraction level and contains hardly any information about management architectures and tools.
ITIL overview
The processes being relevant for the thesis and their databases are depicted in Fig. 3.1. Their tasks are explained in the following.
relevant processes
Fault management in ITIL being part of the Service Support Set is described by two processes: Incident Management process and Problem Management process which are explained in detail in the following subsections. In brief, the Incident Management process deals with current reports from users about service quality degradations called incidents, while the Problem Management process tries to find the root causes of problems. A problem is usually a grouping of one or more incidents.
Incident Management vs. Problem Management
These processes access data from the Configuration Management Database (CMDB) and from the Problem/Error Database which are administrated by the Configuration Management process and the Change Management process. Configuration Management is responsible for managing all configuration data
Configuration Management and Change Management
39
Chapter 3. Related Work incident description
Incident Management
incident(s) escalation
proposal for problem resolution/ avoidance Change Problem Management Management administrates Problem/ Error DB
CMDB
administrates Configuration Management main workflow
retrieval of basic data/configuration
retrieval of known incidents
administrative remarks
Figure 3.1: Collaboration of ITIL processes and databases [Bit05]
called configuration items (CIs) that is needed for the service delivery and support. These data include network topology, server hardware, installed software packages, etc. Change Management is responsible for performing changes in the service delivery in a controlled manner. The idea is to estimate the risk that can result from a change and define a procedure to decide about change execution. In addition to the processes defined above, the Service Desk is defined as a function. It is the interface between Incident Management and users/customers. Service fault diagnosis also refers to a process of the Service Delivery Set, namely the Availability Management which takes care of the fulfillment of customer SLAs.
Incident Management Process input/output of the Incident Management Process
An overview of the Incident Management process’ input and output is given in Fig. 3.2. Incidents are received from the Service Desk (i.e. from users), computer operations, networking, processes, and maybe other sources. They are defined as “any event which is not part of the standard operation of a service and which causes, or may cause, an interruption to, or a reduction in, the quality of that service” [OGC00]. A subcategory of incidents includes the so called service requests. These requests denote that a customer would like to request a change in the service delivery (e.g. upgrade to a higher class of service). The service request procedures store information about the workflow 40
3.1. IT Process Management Frameworks for these requests. Databases being accessed by Incident Management are the CMDB to retrieve configuration data and the Problem/Error Database to get/store resolutions or workarounds. If a change in the configuration is necessary, a request for change (RFC) is posed to Change Management and its result is reported back to Incident Management. The subprocesses of Incident Management are detailed in the following. In addition, a special treatment of “major” incidents within Incident Management is recommended which should be carried out in collaboration with Problem Management. It is mentioned that case-based reasoning (see Section 3.4.4) can be used for diagnosis. Service request procedures routing Service Desk Computer operations Networking Procedures Other sources of incidents
incidents enter process
RFC
monitoring Incident Management process
resolution/ workarounds leave process configuration details
Change Management process
resolution
resolution/ workaround
Problem/ Error Database
CMDB
Figure 3.2: Input/output of the Incident Management process [OGC00]
Incident detection and recording Incidents can be reported to the Service Desk coming from various communication channels. A template structure is recommended for the incident recording in order to capture all details that are necessary for the incident treatment in the first place and to avoid or at least reduce the number of further requests to the reporting user. ITIL recommends the following list of attributes as best-practice [OGC00]. • unique reference number • incident classification • date/time recorded • name/id of the person and/or group recording the incident • name/department/phone/location of user calling • call-back method (telephone, mail, etc) • description of symptoms • category (often a main category and a subcategory) 41
incident reporting
Chapter 3. Related Work • impact/urgency/priority • incident status (active, waiting, closed, etc) • related CIs • support group/person to which the incident is allocated • related problem/known error • resolution date and time • closure category • closure date and time dealing with known incidents
Classification and initial support Some incidents are well-known to Incident Management and do not require further investigation. Examples include the reset of passwords or the change of printer cartridges. For other incidents a solution may be retrieved from the Problem/Error Database. The classification of an incident for which a solution is not obvious in the first place is divided into the following steps.
affected configuration items
• It is necessary to know which CIs are really affected by the incident. The initial user report usually describes the symptoms directly witnessed which need not necessarily point directly to the root cause. For instance, the unavailability of a web page does not have to be caused by a failure of the web server hosting the page, but can also be the effect of a network connectivity problem.
identification of other affected services
• In addition to linking the incident to the SLA of the related service making use of the CI, it has to be determined which services are indirectly affected by the incident. This leads to the inclusion of further services and related SLAs into the impact classification. On the other hand, this analysis sometimes gives valuable information for the incident analysis. If a user cannot access several web pages hosted on distinct servers, a connectivity problem seems to be likely, while the unavailability of a single page could be easily explained by a web server failure.
urgency classification
• The urgency of an incident has to be classified which is independent from the impact. If, for example, the incident occurs in a maintenance interval, it might be less urgent than during regular business hours. Some incidents are less urgent per se, but it can be assumed that the usual user expectation is that its processing does not take very long. A user might e.g. expect that a password can be reset within half an hour. The urgency classification should take such considerations into account.
priority classification
• The priority of an incident is determined as product of impact and urgency and shows the effort that the organization has to spend on dealing with the incident.
42
3.1. IT Process Management Frameworks In most cases the outcome of this process is a detailed description of the incident as well as an incident resolution. It results in an RFC towards Change Management if a change is necessary. Otherwise, the incident can either be treated directly by giving advice to the user or a workaround can be installed to temporarily deal with the situation. If no solution is found at this stage, the incident is further escalated to the second or third level support.
process outcome
Investigation and diagnosis If the incident could not be satisfactorily solved in the previous step, a working group is established to deal with the situation. In particular, a solution has to be found to enable the user to use the services again by finding a non-standard workaround. Basically, the steps from the initial support are iteratively continued to deal with the situation.
working group for incident handling
Resolution and recovery This step is in place to install previously found workarounds or solutions by sending an RFC to Change Management. Incident closure The incident can be closed in this step making sure the user is satisfied by the executed solution. Incident ownership, monitoring and communication This subprocess is a helper process to ensure that Incident Management is operated as planned.
Problem Management Process Problem Management can be regarded as a background process for the reactive and proactive treatment of problems. The reactive treatment is executed after the initial handling of incidents by the Incident Management process. The proactive Problem Management process takes care of maintaining the Problem/Error Database to prevent the future escalation of reoccurring incidents to the Problem Management. Input and output of the Problem Management process are depicted in Fig. 3.3.
process overview
Problem Control The Problem Control process is responsible for finding the cause of problems after these have been reported via incidents (reactive problem management). The process also has to provide recommendations for workarounds and document the problem solution to ease the treatment or avoid the reoccurrence of the problem. The process is structured into Problem Identification & Recording, Problem Classification, and Problem Investigation & Diagnosis.
problem diagnosis and documentation
The Problem Identification & Recording subprocess is executed under the following circumstances. • No match to known errors or problems can be found in the Initial Support and Classification (Incident Management process). 43
Chapter 3. Related Work Incident details Operational workarounds Availability statistics
problem reports
RFC Problem Management Process
configuration data
Change Management Process
solution
solution/ workaround
Problem/ Error Database
CMDB
Figure 3.3: Input/output of the Problem Management process [Bit05]
• The incident analysis suggests that the same incident is reoccurring. • An analysis of the incident shows that there has been no similar incident before. • An analysis of the infrastructure detects a problem which can lead to future incidents. • An important incident is received which requires a structural solution. problem records
For executing this process, problem records are needed which should be similar to the incident records (however, some attributes like call-back method can be ignored). They should be part of the CMDB.
classification with respect to impact
The Problem Classification carries out a set of steps for the classification to prepare the Problem Examination & Diagnosis. The problem is classified according to predefined categories (e.g., hardware, software, support software). It is prioritized similar to Incident Management, but the requirements can be different here. Dependencies on other components should be retrievable from the CMDB (otherwise, it would be quite difficult and error prone to collect the dependencies from different sources). ITIL recommends to develop an encoding schema to be able to quickly classify the expected impact of the problem. Furthermore, it is important to note that an impact analysis is often based on imprecise information. For example, an impact analysis may be conducted for the initial incident resulting only in a low impact. However, there may be more related incidents later whose impact as a whole would be much larger.
different diagnosis aim
The Problem Examination & Diagnosis is carried out similar to the Incident Management process, but with a different focus. Incident Management primarily aims at the timely restoration of the service quality for which a temporary workaround solution is regarded as sufficient. The focus of Problem Management is the diagnosis of the problem’s root cause. In addition, workarounds are added to the Problem/Error Database to ease the treatment of similar situations in the future. A few methods are mentioned for structural diagnosis (Kepner and Tregoe diagrams, Ishikawa diagrams).
44
3.1. IT Process Management Frameworks ITIL recommends to store interaction procedures among registered CIs as part of the CMDB. The reason for this is that problems are often not caused by CIs themselves, but by the procedural interaction of CIs (e.g. when software versions do not fit together). The database should be able to deal with procedural information as additional CIs so that e.g. an RFC for a procedural change can be posed. The changes which have been carried out have to be documented in correspondence with the Change Management process. The documentation of the problem resolution is required as the changes may lead to other problems.
CMDB content recommendations
At the end of the Problem Control process the problem’s root cause should be revealed and a possibility for problem resolution should be recommended. Furthermore, a practical workaround should be stored in the Problem/Error Database. The errors comprise workflow problems as well as component failures. If it has been determined that a component causes a problem, the problem is denoted as known error and treated in the Error Control process.
root cause identification and solution proposal
Error Control The task of the Error Control process is the elimination of known errors using Change Management with respect to its feasibility and costs. In addition, the process is responsible for error monitoring and has to deal with test and production systems. The latter task is necessary as errors within test systems can also be present in production systems so that a knowledge transfer of experience gained with test systems is recommended.
process tasks
The initial treatment of errors depends on their source. If they result from a production system, they are usually problems which have been renamed to known errors. When resulting from a test system, a known error is also documented in the corresponding production system as it might reoccur there in operation.
error treatment
Afterwards the duration and costs of the problem resolution are estimated. The problem resolution itself is carried out by the Change Management process which is also responsible for testing the systems after the change.
recovery analysis
The error treatment has to be documented in the following so that the error processing can be concluded which can either happen via a call to the user or require more intensive operations.
treatment documentation
A continued communication with Change Management is carried out to track the problem resolution within that process. Another issue is the monitoring of the problem management with regard to SLAs as these may define constraints like a maximum number of unsolved problems.
communication with Change Management
Proactive Problem Management The previous processes deal with situations where a problem has already affected the services being provided to customers. However, it is desirable to detect and resolve problems prior to users which is addressed by Proactive Problem Management.
reactive vs. proactive problem management
The tasks of this process cover the range from problem avoidance (e.g. recommend a selection procedure for secure passwords) to the installation of
process scope
45
Chapter 3. Related Work additional resources for workload distribution. Different approaches exist to reach these aims. • Reports from Incident and Problem Management form the basis for anticipating future problems. This means to identify critical components and avoid that they put at risk the provisioning of services.
trend analysis
Some problems may be indicated in advance by a typical set of incidents. Other problems may occur sporadically, maybe at the same time of day without a known root cause. It is helpful to categorize problems which can also give hints for the root cause analysis. proactive actions
• If the proactive analysis indicates future problems, it is obvious that appropriate changes should be carried out. However, the effort for these measures has to be compared to the expected impact of the problems.
high-level process description without application methodology
Assessment The description of the ITIL Incident and Problem Management showed that these processes describe at a high level the steps that need to be carried out for service fault management. It is useful to have a list of actions which need to be taken into account and its matureness ensures that important aspects do not get lost. However, the processes do not go into details and mainly ignore techniques for executing the process steps. Several vendors claim that they provide ITIL-compliant tools (for example HP OpenView ServiceCenter [HP c] which includes workflows for Incident Management and Problem Management), but this statement can be misleading as ITIL does not go into specification details. Therefore, it is unlikely that ITIL tools from different vendors will be interoperable. In ITIL no direct consideration is made whether the steps can be automated in some way, even though this would be interesting to increase the effectiveness of their execution.
3.1.2 Enhanced Telecom Operations Map eTOM overview
The TeleManagement Forum (TMF) is an international non-profit organization of service providers and suppliers in the area of telecommunications services. Similar to ITIL, a process-oriented framework has been developed at first, but the framework was designed for a narrower focus, i.e., the market of information and communications service providers. A hierarchy of process decomposition is defined which ranges from level 0 to level 3. The eTOM standard [TMF05] is described in the document (GB921) which has several addenda. While the main document is quite brief, Addendum D contains a decomposition of the processes into level 2 and level 3. In its current version the decomposition for level 3 in only available for parts of the framework.
eTOM level 1 processes
In eTOM level 1, which extends level 0, a horizontal grouping into processes for Customer Relationship Management, Service Management & Operations, Resource Management & Operations, and Supplier/Partner Relationship Management is performed for the Operations processes (see Fig. 3.4). The vertical grouping (Fulfillment, Assurance, Billing) reflects the service life cycle. 46
3.1. IT Process Management Frameworks Operations Operations Support and Readiness
Fulfillment
Assurance
Billing
Customer Relationship Management Service Management and Operations Resource Management and Operations (Application, Computing and Network) Supplier/Partner Relationship Management
Figure 3.4: eTOM level 1: Operations processes highlighting the Assurance process [TMF05]
In addition to the Operations processes, further processes exist for Strategy, Infrastructure, and Product and for Enterprise Management. Within the vertical process grouping, the Assurance processes are relevant to service fault management. These processes are detailed in Fig. 3.5 and are explained in the following. Please note that eTOM does only use the term customer (sometimes instead of user in relation to the defined terms).
focus on Assurances processes
Assurance Processes for Customer Relationship Management The Customer Relationship Management (CRM) processes are designed for managing interactions between customer and provider by using knowledge about customer needs. eTOM does not assume a specific interface for these interactions, but envisions interactions via telephone, e-mail, web interfaces, etc. Out of the CRM processes the Problem Handling processes are of particular interest, but also the Customer Interface Management, Customer QoS/SLA Management, and Retention & Loyalty processes are relevant.
CRM task decomposition
Customer Interface Management processes These processes are responsible for the management of interfaces to existing or potential customers. For Service Assurance these processes serve as input from customers for service quality or trouble management. The processes, which are depicted in Fig. 3.6, address the management of contacts with customers, the management of requests, as well as the provisioning of analysis results and reports to customers. An additional process has been added in the last version of eTOM (the only one in the processes mentioned here) to handle the customer interactions.
input for service fault diagnosis
47
Chapter 3. Related Work
Fulfillment
Assurance
Billing
Customer Interface Management Customer Problem QoS/SLA Handling Management
Customer Relationship Management
Retention and Loyalty
Service Management and Operations
Service Service Quality Problem Management Management
Resource Management and Operations
Resource Resource Performance Trouble Management Management Resource Data Collection and Processing
Supplier/Partner Relationship Management
S/P Problem S/P Reporting and Performance Management Management Supplier/Partner Interface Management
Figure 3.5: eTOM level 2: Assurance processes [TMF05]
Customer Interface Management
Manage Contact
Manage Request (including Self Service)
Analyze and Report on Customer
Mediate and Orchestrate Customer Interactions
Figure 3.6: eTOM level 3: Customer Interface Management decomposition [TMF05] problem resolution in collaboration with service management
Problem Handling processes The purpose of these processes (compare Fig. 3.7) is to receive trouble reports from customers and to solve them by using Service Problem Management. The aim is also to keep the customer informed about the current status of the trouble report processing as well as about the general network status (e.g. planned maintenance). It is also a task of these processes to inform the QoS/SLA management about the impact of current errors on SLAs.
Problem Handling subprocesses
The process Isolate Problem & Initiate Resolution is used to register and analyze trouble reports from customers, register information about customers affected by service problems, and to isolate the source of the problem in order to decide about appropriate actions. In addition, this process initiates the problem resolution. The Report Problem process generates and manages all 48
3.1. IT Process Management Frameworks
Problem Handling
Isolate Problem and Initiate Resolution
Report Problem
Track and Manage Problem
Close Problem
Figure 3.7: eTOM level 3: Problem Handling decomposition [TMF05]
problem reports that will be sent to customers and/or other processes. The Track & Manage Problem process tracks the problem processing by actively or passively collecting information. Finally, the Close Problem process takes care that the problem report processing can be finalized including the possibility the interact with the customer to ensure her satisfaction. Customer QoS/SLA Management
Assess Customer QoS Performance
Manage QoS and SLA Violation Information
Manage Reporting
Figure 3.8: eTOM level 3: Customer QoS/SLA Management decomposition [TMF05]
Customer QoS/SLA Management processes These processes are responsible for the monitoring, management, and reporting of the service quality with respect to SLAs. QoS parameters which are considered for this include operational parameters such as resource performance and availability, but also service management parameters like the percentage of contract requests completed on time. The processes (compare Fig. 3.8) are divided into monitoring of the fulfillment of SLAs, management of SLA violation information, and QoS reporting.
access to SLA management information
Retention and Loyalty processes These processes deal with the estimation of customers’ value for the provider and the development and running of loyalty schemas for their acquisition and continued subscription to the provider’s services. Fig. 3.9 depicts these processes. Their tasks include the verification of the customers’ identity for establishing the business relationship, the potential termination of relationships, their continued monitoring, assessment of the risk which is posed by customer relationships, personalization of the loyalty program for specific customers, and the verification of customer satisfaction.
assurance of business relationship
49
Chapter 3. Related Work
Retention and Loyalty
Establish and Terminate Customer Relationship
Analyze and Manage Customer Risk
Build Customer Insight
Validate Customer Satisfaction
Personalize Customer Profile for Retention and Loyalty
Figure 3.9: eTOM level 3: Retention and Loyalty decomposition [TMF05]
Assurance Processes for Service Management & Operations service management overview
The Service Management & Operations processes are designed for service delivery and operations in contrast to the management of the underlying network and information technology. They link the CRM to resource management. For service fault management the Service Problem Management processes are of primary interest, but also the Service Quality Management processes are relevant. Both process groups are presented in the following.
diagnosis and recovery
Service Problem Management processes In these processes reports about customer-affecting service failures are received and transformed. Their root causes are identified and a problem solution or a temporary workaround is established. It can be witnessed that ITIL’s separation into Incident and Problem Management is not made in eTOM. The processes are depicted in Fig. 3.10 and are explained in the following. Service Problem Management
Evaluate and Qualify Problem
Plan and Assign Resolution
Diagnose Problem
Close and Report
Track and Manage Resolution
Figure 3.10: eTOM level 3: Service Problem Management decomposition [TMF05]
Evaluate & Qualify Problem: This process classifies the problem and verifies whether it is caused by a customer mistake. The customer’s input is 50
3.1. IT Process Management Frameworks interpreted or transformed so that it can serve as input for the Diagnose Problem process. The process will check whether there are supplier/partner problem notifications, notifications from resource management or a service-related event report and analyze this input with respect to customers and their SLAs. The process informs the Problem Handling about the expected restoration times and the Customer QoS/SLA Management about the impact on service performance. Diagnose Problem: The purpose of this process is to isolate the root cause of a problem by performing appropriate tests and queries. In addition, a problem escalation can be performed to report the severity and if necessary to solve the problem. Plan & Assign Resolution: This process is responsible to schedule the steps for problem resolution which result from the output of the Diagnose Problem process. Track & Manage Resolution: This process monitors the progress of the problem resolution plans drafted in the previous process. Close & Report: This process verifies the restoration of service operation. Service Quality Management processes These processes are responsible for the monitoring, analysis, and management of the service performance with respect to customers’ expectations. They also deal with the restoration of service quality.
quality degradation diagnosis and recovery
Processes (compare Fig. 3.11) exist to monitor the service quality including the use of events from Resource Management, use the quality to forecast whether SLA promises will be met, improve the service quality, and to report constraints that can lead to problems in the future.
subprocesses
Service Quality Management
Monitor Service Quality
Analyze Service Quality
Improve Service
Identify and Report Service Constraints
Figure 3.11: eTOM level 3: Service Quality Management decomposition [TMF05]
Assurance Processes for Resource Management & Operations Resource Management & Operations processes take care of the management of the resources and infrastructure which is used for service operation. As the Resource Trouble Management and Resource Performance Management processes are related to service fault management, details about them are given in the following. 51
problem management on the resource level
Chapter 3. Related Work problem diagnosis and resolution
Resource Trouble Management processes The Resource Trouble Management processes aim at the reporting of resource failures, isolation of their root causes, and failure resolution. The processes are described in the following (compare Fig. 3.12). Resource Trouble Management
Survey and Analyze Resource Trouble
Correct and Recover Resource Trouble
Localize Resource Trouble
Figure 3.12: [TMF05]
eTOM level 3:
Track and Manage Resource Trouble
Close Resource Trouble
Report Resource Trouble
Resource Trouble Management decomposition
Survey & Analyze Resource Trouble: This process takes care of the monitoring of resources in real time by resource failure event analysis, alarm correlation and filtering as well as failure event detection and reporting. The alarm correlation in particular aims at the matching of redundant, transient or implied events to a specific “root cause” event. Localize Resource Trouble: The process is responsible for finding the root cause of resource trouble which can be done using the following methods: verification of resource configuration for the targeted service features, performing resource diagnostics, running resource tests, and scheduling resource tests. Correct & Recover Resource Trouble: Failed resources are either restored or replaced by this process. Track & Manage Resource Trouble: This process monitors the progress of the repair activities in the previous process. Report Resource Trouble: This process reports changes in resource troubles to other interested processes (e.g. Service Trouble Management). Close Trouble Report: To close a trouble report processing, this process verifies the successful elimination of the problem. Resource Performance Management processes These processes are responsible for the monitoring, analysis, and management of the resource performance. subprocesses
Processes (compare Fig. 3.13) exist to monitor the resource performance by analyzing collected resource data, analyze and control the resource performance by a set of methods as well as to report the data to other processes. 52
3.1. IT Process Management Frameworks Resource Performance Management
Monitor Resource Performance
Analyze Resource Performance
Control Resource Performance
Report Resource Performance
Figure 3.13: eTOM level 3: Resource Performance Management decomposition [TMF05]
Assurance Processes for Supplier/Partner Relationship Management The Supplier/Partner Relationship Management processes are responsible for the relationship to external providers whose offers are used for the provider’s service operation. For the exchange of problem and performance information two specialized processes exist.
management of subservices from external providers
The S/P Problem Reporting & Management processes transfer information about problems at the provider to suppliers or partners and receive similar information when suppliers/partners are experiencing problems on their own. The S/P Service Performance Management monitors whether suppliers/partners deliver the service performance which they have guaranteed. The information exchange is done via the suppliers’/partners’ CRM interfaces which are also used to change the configuration of subscribed services.
problem and performance management processes
Cross-Layer Processing Example eTOM’s Addendum F (version 4.5) contains some example processes for illustration. One of these examples (page 51) dealing with service assurance is depicted in Fig. 3.14 in a simplified manner (see also [Bre04]). The figure shows in the first place how a problem report received by the Customer Interface Management is forwarded to the Problem Handling process. To prioritize the problem, further information is requested from the Customer QoS/SLA Management and Retention and Loyalty processes. Customer QoS/SLA Management, which has become aware of the problem by the previous information request, begins to track the incident treatment to further escalate the situation in case an SLA would be seriously affected. The Problem Handling transfers all relevant data including determined priority and guarantees for affected QoS parameters in the SLAs to Service Problem Management. Service Problem Management is trying to diagnose the problem and contacts Resource Trouble Management to retrieve information about the statistics of relevant resources. In this example no problem can be identified and Service Problem Management in collaboration with Service Quality Management verifies that the service is provided meeting the agreed QoS levels. After that, Service Problem Management returns the results to the Problem 53
fault resolution workflow
Chapter 3. Related Work Service Management and Operations
Customer Relationship Management
Resource Management and Operations
Customer 0: problem reported Customer Interface Management
Service Problem Management
1: problem report forwarded Problem Handling
6: check requested Resource Trouble Management
5: detailed problem report transferred
2: problem information transferred Retention and Loyalty 3: customer priority transferred
Customer QoS/SLA Management 4: customer SLA information transferred
Service Problem Management
7: resource status transferred (everything ok)
8: result correlation requested Service Quality Management 9: no problem identified
Problem Handling
Service Problem Management
Problem Handling
10: performance report transferred
11: performance report transferred
Customer Interface Management
Customer QoS/SLA Management Retention and Loyalty
12: information about service status transferred Customer
Figure 3.14: eTOM example processing of a customer problem report [TMF05, Bre04] (please note the horizontal ordering of processes in contrast to the organization used before)
Handling process. This process again informs the Customer QoS/SLA Management and Retention and Loyalty processes which register the analysis result. It also informs the customer via Customer Interface Management about the provided service quality.
eTOM workflows suitable reference for service fault diagnosis
Assessment Even though eTOM has its origin within the telecommunications industry, the framework itself is not limited to telecommunication services. The processes presented here seem pretty mature as only a few minor changes have been preformed within the last two years between version 4.0 and version 5.0. Similar to ITIL the process description is not very detailed, but has a clearer structuring of processes and subprocesses. These processes can therefore serve as basis for the service fault diagnosis workflow. At some 54
3.2. Service and Resource Modeling points techniques for the implementation of steps are given. In particular event correlation is mentioned as a technique for fault management on the resource layer. The processing example shows how the workflow involving the different layers (customer, service, resource) can be done, while such interactions between the processes are only given in a fuzzier manner in ITIL. In contrast to ITIL, eTOM does not have an explicit role model. However, it has to be emphasized that an organization does not have to choose exclusively between ITIL and eTOM. Both frameworks can be combined for which a special document is provided as additional eTOM addendum (however, it is limited to discuss theoretical combination possibilities).
3.2
ITIL/eTOM combination
Service and Resource Modeling
In service fault management a variety of information has to be dealt with so that an appropriate information modeling is required. This information comprises services, resources, customers, SLAs, faults, fault resolution knowledge, etc for which related work is mentioned at the beginning of this section. A special focus is set on the modeling of dependencies which is very important to track failures from the service level down to the resource level. Some additional information is given how dependencies can be identified.
information need for service fault management
3.2.1 Information Modeling For information modeling the work of several standard bodies is summarized. Some of these models are already mature, while others are under development. They are examined for their capability to model the different kinds of information needed for service fault management. For further related work in this area including Web services and research approaches see [DgFS07].
standards for information modeling
Internet Information Model The Internet Information Model designed by the Internet Engineering Task Force (IETF) [CMRW96] provides a huge set of MIB variables organized in the Internet registration tree that are used for the management of devices and their collaboration in the Internet using the Simple Network Management Protocol (SNMP). For instance, the Event MIB [KS00] which is based on the RMON MIB is useful for resource monitoring and corresponding event definition. In addition, a large set of vendor-specific MIB variables exists in so called enterprise MIBs. Despite of a few efforts to integrate service-related information such as [HKS99], the model is clearly focused on resource management.
resource focus in MIB variables
Common Information Model The Common Information Model (CIM, [CIM06]) is developed by the industry organization Distributed Management
history and motivation
55
Chapter 3. Related Work Task Force (DMTF) which is the successor of the Desktop Management Task Force. The original aim of this standardization effort - the detailed modeling of a computer system - has been extended to cover network related issues. Examples of the broad range of modeled entities include physical network connection equipment, complete hosts, or user passwords. The aim of CIM has been to completely replace SNMP due to its limitations. modeling and implementation
CIM provides class diagrams including a large amount of attributes and methods which are also specified in machine-readable Managed Object Format (MOF, XML format) files. The concept of the Web Based Enterprise Management (WBEM) initiative foresees to access CIM information using a CIM Object Manager (CIMOM) module for which a set of implementations exists [Hei04]. Naming conventions can vary between organizations so that CIM implementations are usually not interoperable.
limitation to resource management
CIM mostly deals with network and systems management. The standardization of service-related information is limited to define service attributes being directly linked to device attributes.
matureness of the model parts
For maintenance reasons CIM is divided into a Core Model containing basic classes and several extensions called Workgroup Models which share model parts via the Core Model. One main challenge of applying CIM is that the development of the model is ongoing and the changes between different releases may affect large parts of the model so that the schema realization needs to be updated. Even though changes of the Core Model occur relatively seldom, the differences in the Workgroup Models often include a complete design change within a year. For consistency reasons the rules for changes do not allow to remove or change an attribute, but it can be marked as deprecated so that it may be removed in a later release. To sum up, CIM provides a lot of classes (more than 1,000) and attributes being useful for network and systems management. However, the insufficient treatment of service management information does not allow to use it for service management purposes.
only abstract recommendations for CMDB
ITIL CMDB ITIL’s (see Section 3.1.1) CMDB [OGC00] is targeted to serve as information source for ITIL processes. It is primarily used to store information for Configuration Management, but other parts of ITIL suggest to extend the CMDB for their purposes. It should include relationships between all system components (incidents, problems, known errors, changes, releases) and reference copies (or appropriate references) of software and documentation. In addition, information about IT users, staff, and business units may be stored and it can be considered to store SLA information and its linking to components. As mentioned earlier, pieces of information in the CMDB are called CIs. The way these CIs have to be modeled and the overall implementation of the CMDB are not specified in ITIL. This is due to ITIL’s high-level nature which allows organizations to implement the framework according to their needs. 56
3.2. Service and Resource Modeling Shared Information/Data Model eTOM (see Section 3.1.2) is part of TeleManagement Forum’s framework for operation support systems which is called NGOSS (Next Generation Operation Support and Software, [TMF04b]). It aims at the creation of a vendor independent architecture for operation support systems for which a complete management solution can be built from independent modules. A part of the framework is the Shared Information/Data Model (SID, [TMF04a]) aiming at standardizing IT asset management information needed for telecommunication service management. It can therefore be regarded as a CMDB for eTOM. Even though some basic concepts of CIM are used, the authors did not base their work entirely on CIM due to expected difficulties. The model is object-oriented and structured into a hierarchy of levels according to a top-down approach. Aggregated System Entities and Aggregated Business Entities are used for a differentiated view on resource-related and business-related information [BGSS06]. While the two top-layers of the hierarchy already seem to be in a mature state, much work needs to be done for the lower layers (e.g. with respect to the definition of necessary attributes).
information model as part of NGOSS
Services are separated into two different views which are basically modeled independently from each other. The CustomerFacing Services model information with relation to service management at the customer provider interface, while the ResourceFacing Services model the use of resources for the service implementation. Even though this separation makes it easier to model information needed for a certain purpose at the first place, it is required to add additional pieces of information to reflect the relationships across the CustomerFacing and ResourceFacing Services. An example of this is that resources are used to provide a certain quality of service. A customer-oriented fault management (CustomerFacing Service) therefore has to access information from the ResourceFacing View to know which resource could be the problem’s root cause.
separation of service information
A challenge in real world scenarios is to unify information about devices. The information is not only vendor-dependent, but may also be dependent on different releases of the same vendor. SID applies design patterns (a popular software engineering technique) like the composite pattern to address this issue.
use of design patterns
SID is still under development, but the approach seems very promising to address the needs of service-orientation. Service MIB approach The research of Martin Sailer [Sai05, DHHS06, DgFS07] aims at addressing the issues that have been identified as deficits of the existing standards with respect to the service-orientation. The developed approach is called Service MIB aiming to build a repository of all information needed for service management.
approach for service management information
A central role for the description of a service is assigned to service attributes for which a specification methodology is given in [DgFS07] and depicted in Fig. 3.15.
service attributes
57
Chapter 3. Related Work 1. Declare static attributes − name/id − description 2. Identify relevant components 3. Identify relevant attributes per component 4. Determine measurement parameters − sampling rate, # of samples − data format, API, Protocol 5. Determine aggregation rule for service attribute
Phase
Related Concepts, Tools etc.
derive
ITIL, SLAs, FCAPS, Customers’ requ.
define
CIM, SID, IIM, SISL
monitor ganglia, cacti, nagios, OpenView, SMONA use
Management Application, PbM etc
Figure 3.15: Methodology for specifying service attributes [DgFS07] attribute derivation methodology
The specification of attributes is divided into the phases derive, define, monitor and use. The derive phase determines the need for service management information from the requirements of customers and management frameworks (in particular ITIL). The define phase is in focus of the work and is subdivided into five phases. Some information about an attribute like name and description which is regarded as invariant is specified at first. Dependencies on other services or resources are identified in the second step for which methods like the ones in Section 3.2.2 can be applied. The dependencies are then refined by identifying the parameters of the related services or resources which are relevant for the service attribute. A measurement methodology is specified for these parameters and a set of aggregation rules is developed. In the monitor phase the parameters are continuously monitored as specified for which the SMONA architecture (see Section 3.4) has been devised. The measurement results are reported to management applications in the final use phase.
SISL language
Attributes are denoted in a declarative XML-based language called Service Information Specification Language (SISL) so that they are independent of a specific implementation. The term service attribute used here includes QoS parameters, but can also comprise other features of a service which are not directly related to SLAs. An example can be the use of storage space by the service.
limited modeling of service related attributes in standards
Assessment The evaluation of modeling standards and approaches has shown that a lot of effort has already been spent on the modeling of resources. CIM provides a variety of classes to model resources, but is limited towards the modeling of services. While ITIL does not target to fill this gap, NGOSS SID is moving in this direction. However, the Service MIB approach is an important forerunner of these activities and can serve as valuable input.
3.2.2 Dependencies importance of dependencies
For service fault diagnosis dependencies which describe the complex interactions on the service level and on the resource level have to be modeled in an appropriate manner. This is needed to automatically track a customer report 58
3.2. Service and Resource Modeling about a service symptom down to the resources which are used for implementing this service. Even though the dependency modeling is regarded as part of the overall information modeling, a dedicated section is provided due to the complexity of the task.
Dependency modeling Despite of the importance of dependencies for fault diagnosis and other tasks, dependencies and their features are often described only superficially. In addition to a model for telecommunications [GRM97], the CIM core model is one of the few standards to deal with dependencies explicitly. It contains a generic dependency class from which other classes inherit. However, the dependencies contain nearly no attributes and are not tied to services in the sense of this thesis. The terms antecedent (object on which other objects depend) and dependent (object that depends on other objects) which are used in CIM will be applied for services and resources in this thesis. Dependency graphs that are built out of CIM dependencies are used in [AAG+ 04a] for problem determination. An extension of CIM for fault diagnosis and impact analysis for telecommunication services is addressed in [SS06].
dependency modeling in standards
Dependency graphs are a common concept to organize dependencies for fault diagnosis. In [Gru98, Gru99] a generic approach to deal with such a graph is given. However, the dependencies themselves are not further specified. An important feature of the graphs has to be their acyclic nature. According to [KK01] mutual dependencies on the service level are usually an indicator of bad design. In this paper dependency models are categorized into functional, structural, and operational models. An XML-based modeling based on World Wide Web Consortium’s (W3C) Resource Description Framework (a generic XML format, [RDF]) is used to model the dependencies. There are only examples of potential attributes of the dependencies such as strength (likelihood that a component is affected if antecedent fails), criticality with respect to the enterprise goals, and degree of formalization (how difficult it is to obtain the dependency). In a subsequent paper [EK02] the authors reference challenges of dependency graphs such as the need to distribute the graphs, missing information and efficient query needs.
dependency graphs
In [CR99] dependencies for services offered by Internet Service Providers are described distinguishing between five kinds of dependencies. An execution dependency denotes the performance of an application server process with respect to the status of the host, while a link dependency specifies the service performance with respect to the link status. In case of an Internet service that is provided on different front-end servers which are selected by a round-robin DNS scheduling the performance depends on the currently selected server (component dependency). An inter-service dependency occurs between services, e.g. an e-mail service depends on an authentication service and on an NFS service. Organization dependencies arise if services and/or servers belong to different domains. A methodology to discover these dependencies was addressed by the authors in [RCN99].
dependency types for ISP scenarios
59
Chapter 3. Related Work Dependency − antecedent: ServiceBuildingBlock − dependent: ServiceBuildingBlock − strength: float − statusLifeCycle: string + add(d: Dependency) + remove(d: Dependency) + getChild(n: int): ServiceBuildingBlock + getChildList(): ServiceBuildingBlock[] + getDependent(): ServiceBuildingBlock + getAntecedent(): ServiceBuildingBlock + getImpact(): ImpactObject + testPresence(time: Date): bool
Inter−Resource−Dep − antecedent: Resource − dependent: Resource + getDependent(): Resource + getAntecedent(): Resource + getImpact(): ImpactObject + testPresence(time: Date): bool
* children
Service−Resource−Dep − antecedent: Resource − dependent: Functionality + getDependent(): Functionality + getAntecedent(): Resource + getImpact(): ImpactObject + testPresence(time: Date): bool
CompositeDependency + add(d: Dependency) + remove(d: Dependency) + getChild(n: int): ServiceBuildingBlock + getChildList(): ServiceBuildingBlock[] + getDependent(): ServiceBuildingBlock + getAntecedent(): ServiceBuildingBlock + getImpact(): ImpactObject + testPresence(time: Date): bool
Inter−Service−Dependency − antecedent: Functionality − dependent: Functionality + getDependent(): Functionality + getAntecedent(): Functionality + getImpact(): ImpactObject + testPresence(time: Date): bool
Figure 3.16: Dependency hierarchy using the composite pattern [HMSS06]
A strength attribute for dependencies is defined in [BKH01] having the values strong, medium, weak, or absent. Further dependency models are contained in [CJ05] using multi-layered Petri nets and in [Has01] where the modeling is tied to software classes. approach by Marcu
In sum, the modeling of dependencies for services cannot be regarded as satisfactory as it is not targeted towards the needs of service-orientation. In the master thesis of Patricia Marcu [Mar06, HMSS06] an appropriate modeling has therefore been addressed. It is depicted in Fig. 3.16. The information modeling in Section 4.6 can be regarded as refinement of this work.
dependency finding techniques as justification of thesis assumption
Dependency finding techniques As mentioned earlier, the starting point of the theoretical part of this thesis is that dependencies for services are given so that only a modeling of the dependencies needs to be specified. As the finding of dependencies is usually not an easy task in practice, a literature review on this issue is provided in the following to justify that this assumption can be made.
query of available dependency knowledge
In [SS04] several methods for obtaining fault localization models are described. For dependencies which form the most important part of these models the request of information from existing information sources is sometimes possible which is usually limited to a technology dependent manner. For instance, DNS-related dependencies may not be stored directly, but can be determined from files like “resolve.conf”. For IP networks the Physical topology MIB [BJ00] can be used as information source. A method to query system configuration repositories was given in [KKC00], while service information is automatically discovered from the configuration of network elements in [BC03]. 60
3.3. Fault Management Interfaces When methods to query existing information are not feasible, dependency finding methods have to be installed. Application Response Measurement (ARM) [ARM98] can be used to instrument applications to provide additional information. A set of libraries for code instrumentation is also provided by Katchabaw et al. [KHL+ 99]. An approach that uses instrumented code for dependency determination is given by Kar et al. in [BKK01, BKH01]. Nodes of interest are identified and their monitoring is instrumented. The effects of pertubating and injecting faults into the nodes are monitored and the changed system behavior is used to determine the strength of dependencies which are grouped in four levels. Obviously, it is necessary to carefully apply such a method in production environments.
using instrumented code for dependency identification
A passive method to find dependencies by analyzing interactions is given by Agarwal et al. in [GNAK03, AGK+ 04] which uses data available on the nodes. Alternatively, message traces were used in [AMW+ 03]. The number of interactions is used as indicator of the dependency strength. An additional publication shows the effect of inaccurate modeling for problem determination [AAG+ 04b]. These inaccuracies arise due to missing or false dependencies which are more seldom when using instrumented code. However, the effort for instrumenting code may be much higher and instrumentation may not be possible in some situations.
passive identification methods
Ensel [Ens01b, Ens01a] proposed to use a neural network based approach. For each pair of resources in a network the activity is monitored using indicators like CPU load (for the whole device or per application), bandwidth utilization or their combinations. The activity curves are input for a neural network which decides whether a relation of the activities exists.
neural network-based approach
There are also approaches [TJ01, BHM+ 01, HMP02] that perform a data mining of event log files in order to identify patterns. These pattern as used as indicators of dependencies.
data mining
As the analysis of related work has shown, the automated identification of dependencies especially on the service level is still a subject to ongoing research. The documentation of services which is required for change management in any case should therefore also consider the parallel documentation of functional dependencies. For dynamic dependencies (e.g. which client request makes use of which resources) instrumented code can be a solution. On the resource level, the finding of dependencies is usually technology specific (e.g. IBM Tivoli Application Dependency Discovery Manager [IBMa] provides a set of 250 product specific sensors for dependency discovery).
configuration management information should include service-related dependencies
3.3
Fault Management Interfaces
ITIL’s Service Desk and the CRM processes in eTOM describe at a high level what needs to be done at the interface to the customer/user. To get a more in 61
specialized approaches
Chapter 3. Related Work depth view of the reporting of user input for service fault diagnosis, the reporting concept in the Customer Service Management approach is presented. In addition, the Intelligent Assistant concept based on decision trees is referenced which is useful to collect necessary information. multi-channel user interfaces
It is important to note that the input from users can make use of different communication channels such as telephone, e-mail, web forms or personal contact. For instance, information may also be collected via a speech dialogue system such as the one developed in [Den02] which flexibly collects needed information for a given purpose.
3.3.1 Customer Service Management CSM idea
A provider usually has a lot of useful management information which is collected by several tools and administrated by a service management platform. Due to the customers’ demand for more transparent services in today’s service market, it is desirable to provide a part of the management information to the customer and to allow the customer to manage subscribed services in a restricted manner. A concept for this purpose called Customer Service Management (CSM) (see Fig. 3.17) has been developed by Langer, Loidl and Nerb [LLN98, Lan01, Ner01] and has been included into the MNM Service Model. The upper-case spelling is used here to refer to this specific work, while the lower-case term refers to the task. customer service usage service level agreement
service
subservice subservice
service management usage
Customer Service Management
service management platform
resource provider
resource
management tool management tool
Figure 3.17: General customer service management scenario [LLN98]
Problem management interactions In [Ner01] interactions were defined for the problem management area. These interactions are in part based on the work of the former Network Management Forum (now TeleManagement 62
3.3. Fault Management Interfaces Forum). The interactions allow for an active participation of the customer at the provider’s problem management process1 . OperativeCSM Provider
CSM User
Administrative Provider
Problem Manager
createTR getServices(User.OrgID) return(ServiceID[])
throw notAuthorizedException
{if not all AffectedServices[] in ServiceID[]}
{ else } * [AffectedServices[].length]
getSLAInfo( AffectedService[i]) returnSLA
adapt TR attributes according to customer and service information and EscalationPriority
getCustomerInfo( User.OrgID) return(Customer)
createTR notifyCreation(TRID) notifyCreation(TRID)
Figure 3.18: Workflow for trouble report input [Ner01]
Overview of all problem reports: Customers should have the ability to get an overview of all trouble reports related to a subscribed service. These reports comprise the customer’s own trouble reports, problems recognized by the provider himself, and reports about regular or extraordinary maintenance work. The provider also uses problem reports to inform the customer about violations of the agreed service quality and to document their treatment. Entry, change and withdrawal of problem reports: The customer must be enabled to report problems or general enquiries about the subscribed service. The workflow for this purpose is depicted in Fig. 3.18. The report is enriched with information about the service and the customer before it is transferred to the problem management. Furthermore, it has to be possible to change a report at a later stage. The purpose of these changes can be the provisioning of additional information, recently noticed symptoms, or new impacts of the problem. 1
Please note some deviation of terms here. “Problems” and “trouble” would be referred to as “symptoms” and the source does not distinguish between users and customers.
63
Chapter 3. Related Work Finally, the customer must have the possibility to withdraw a problem report. This feature can be desirable if a customer notices after the entry of a problem report that the cause of the problem is located in his own environment and is not caused by the subscribed service. Tracking of the problem report state: This function allows to track the state of a report which is very useful especially for complex provider hierarchies. If a provider uses subservices from other providers, it is necessary to monitor the problem state (given by the state of the corresponding problem reports) in order to track the impact on the provider’s own services. Apart from the current state of the report, the expected problem duration is highly relevant. Forward of new problems and state changes: The service provider has to inform the customer about new problems, disruptions or maintenance work via the CSM interface. Especially for provider hierarchies (i.e., when the customer uses the service to build his own value added service) it is necessary to provide timely information to allow the customer to determine the impact of the problem. The same considerations hold for information about processing state changes. The customer is dependent upon these notifications for the proper operation of his local environment and for his offered services. Especially for problem resolutions, the customer must have the possibility to verify the solution and to test the reestablished service operation. Problem report history: It must be possible for the customer to retrieve an overview of past problem reports. This overview can be used as proof of the agreed quality of service, but also allows conclusions of the frequency of error types. The latter information may be useful for the provider to optimize the problem treatment or service delivery. All these functions are based on a common data structure called CSMTroubleReport [LN99, Lan01] which is depicted in Fig. 3.19. The abstract class CSMTroubleReport acts as a superclass of ITTroubleReport which is applied for trouble reports from customer and provider and of ProviderTroubleReport which is designed for maintenance information. CSMTroubleReport has the following attributes. Activity: This attribute describes all actions that have been performed during the processing of the trouble report. These actions are not limited to the pure processing of the trouble reports, but also include other activities like contacting the customer to exclude some possible causes. This attribute is composed of a description of the activity, the person (who has performed the activity), the time stamp, and the new status of the report. The description is done in prose. AdditionalTroubleInformation: In this field information which is additional to the TroubleDescription can be given either by the provider or the customer. 64
3.3. Fault Management Interfaces ManagedElement Service
+ RelatedTroubleReports 1 CSMTroubleReport *
Activity AdditionalTroubleInformation AffectedServices LastUpdateTime ProviderPriority ReceivedTime RelatedTroubleReports ServiceProviderContactPerson TroubleDescription TroubleFound TroubleReportID TroubleReportState TroubleReportSynopsis
ITTroubleReport CommitmentTime CommitmentTimeRequest CustomerContactPerson CustomerID PerceivedTroubleSeverity TroubleDetectionTime
+AffectedServices
ProviderTroubleReport BeginTime EndTime
Figure 3.19: CSMTroubleReport format [LN99, Lan01]
AffectedServices: This field indicates the affected service or services using unique identifiers. LastUpdateTime: This attribute shows the time of the latest report update (without taking into account whether the customer or provider did the update). ProviderPriority: The urgency which the provider has assigned for the processing of the report is stored in this field. Possible values are high, medium, low, or unknown. This attribute has not to be mixed up with the PerceivedTroubleSeverity of ITTroubleReports. ReceivedTime: This attribute documents when the report was received the first time. Together with the CommitmentTime the attribute can be used to calculate the overall processing time of ITTroubleReports. RelatedTroubleReports: The service provider can use this field to link this trouble report to other already existing trouble reports. This piece of information is interesting for the customer to get an impression of the 65
Chapter 3. Related Work problem severity, while it is also useful for the provider to set as many reports as possible in context. For privacy concerns it has to be made sure that the reports of one customer can not be accessed by another customer. ServiceProviderContactPerson: This field indicates the person from the provider’s staff being responsible for the report processing. TroubleDescription: This attribute gives detailed information about the content of the trouble report. Customer and provider document errors, disruptions, problems or general requests using this field. TroubleFound: This field describes the cause of the problem documented and identified in the TroubleDescription field. This field is set only after a change of the TRState (see below) to the Cleared state which indicates the removal of the problem. TroubleReportID: A unique identifier for the problem report. TroubleReportState: This attribute distinguishes between the five states which are possible for the Trouble Report. These states reflect the current processing state of the Trouble Report (see Fig. 3.20). After a Trouble Report is generated, it is either in the state Queued or Open. The state Queued denotes that the processing of the report has not been started yet. The status Open indicates that a Trouble Report is processed. If this process is interrupted (e.g. by requests for further information to the customer or other organizations like vendors or subproviders), the state is changed to Deferred. If the cause of the problem documented in the Trouble Report is found, the state is changed from Open to Cleared. The report is only finalized, i.e. the state is changed to Closed if the issuer of the report (usually the customer) has confirmed that the problem has been fixed or if the report has been canceled. TroubleReportSynopsis: Short description of the whole Trouble Report.
create create Queued open
release Open
Deferred defer cancel
cancel Closed
delete
reopen clear Cleared
close
cancel
Figure 3.20: State diagram for TRState according to [NMF97]
The service problem description in an ITTroubleReport has the following additional attributes. 66
3.3. Fault Management Interfaces CommitmentTime: This attribute contains the time when the report has been closed. This time therefore denotes the agreement of customer and provider that the problem has been fixed. CommitmentTimeRequest: Using this attribute the issuer of the report can give a desired time until the problem solution. CustomerContactPerson: This field contains an identification of the person who is in charge of the problem treatment at the customer side. CustomerID: This attribute gives a unique identification of the customer (identifier given by the provider). PerceivedTroubleSeverity: This attribute is the priority that the customer desires with respect to the problem solution (compare ProviderPriority). TroubleDetectedTime: This field contains the time when the issuer of the report noticed the problem for the first time.
3.3.2 Intelligent Assistant The tool Intelligent Assistant (IA) is designed for user-guided fault localization. It has been developed at the LRZ [Mod94, DRK98] and is applied to the E-Mail Service as well as to connectivity problems. The tool is also of interest for the industry [Ott99, Ber04]. The basic idea of the IA tool is to help the user of a service to perform a prediagnosis of a service symptom on her own. This preclassification is offered by a web front end where symptom information is collected in a transparent way which can also be input to further workflow actions. The aims of the IA design have been the following.
design goals
• Enhance subjective and ambiguous user reports to become structured and meaningful problem descriptions • Support a service provider in diagnosing symptoms which occur during the service usage • Ease the interaction between user and provider and provide a transparent access to service testing possibilities • Allow for similar test actions inside the provider organization to replicate the symptoms • Reduce the problem diagnosis duration to minimize the overall symptom resolution time The symptom classification performed by the IA is guided by a decision tree (compare Fig. 3.21). This tree contains collected expert knowledge for dealing with symptoms in an automated way. Each node of the decision tree represents an action while the edges of the tree determine the ordering of actions. The leaves of the tree are either an explanation of the symptom or generate 67
tool architecture
Chapter 3. Related Work a trouble ticket (see Section 3.4.9). If an interior node of the tree has more than one successor, a decision is made related to the action which is associated with the node. The action in a node can either be a test action concerning features of the service or a question to the user. ...
test_action() test_action = ok
test_action = not ok
...
...
...
...
Figure 3.21: Example part of a decision tree [Ber04] service hierarchy reflected in decision tree modules
The functionality of higher-level services is often based on the proper operation of basic services. The Web Hosting Service and the E-Mail Service at the LRZ are e.g. based on the DNS Service and the Connectivity Service. Therefore, if it is detected after the traversing of the decision tree for a higher-level service that the problem is located in one of the underlying services, the decision tree for this subservice can be accessed. This grouping of the decision trees (see Fig. 3.22) allows to reuse the trees for subservices if the service is used by other higher-level services. For the modeling of IA trees a tool called IA Editor [Sch01a] has been developed. decision tree "Web Hosting Service"
decision tree "E−Mail Service"
services
decision tree "DNS" subservices decision tree "IP connectivity"
Figure 3.22: Structuring of decision trees according to the service hierarchy [Ber04] integration in management environment
For integrating the IA into a specific management environment, several interfaces are provided. Common management tools (e.g. ping and traceroute) can be accessed to perform tests during the tree traversal. It is also possible to query commercial tools such as HP OpenView NetworkNodeManager [HP b] as well as management databases for this purpose. Tools like JINSI [OJBZ06] could be applied to replay user interactions in order to reproduce and isolate symptoms on the user side. 68
3.4. Fault Management Techniques To forward the output of the IA to the support staff of the provider, an interface to a trouble ticket system (see Section 3.4.9) is used. This coupling can be done via e-mail or, more sophisticated, by using the trouble ticket system’s API. The latter option allows to map the IA’s output to fields in the trouble tickets which leads to an enhancement in the processing.
coupling with trouble ticket systems
The IA can be used either by the user directly via the web interface or the service desk staff can enter the user’s information manually into the IA (compare to the LRZ scenario in Section 2.2). While the first option is desirable to minimize the provider’s effort, the second option needs to be offered, at least in some situations. If e.g. a connectivity service is offered which has currently a minor quality, it might not be possible to report this via the web interface. It has to be possible to contact the provider via telephone in this situation as e-mail transfer might also be affected. An advantage of the IA’s application in the service desk is that the staff needs less training for dealing with user queries. In some situations it will not be possible to reproduce the symptoms that the user has experienced as the environment and the service access at the provider is different from the user.
application options
To allow for an optimized use of the IA, a view concept can be implemented. The views are designed for the knowledge of different user groups like normal user, first level support staff and service administrators. For administrators it can e.g. be assumed that they are aware of the possibilities of a tool like ping while the usage and meaning of the result have to be explained for the normal user. The implementation of the tool currently does not support this view construction.
view concept
Assessment The CSM interactions that are proposed to deal with symptom reports form a very good basis for the service fault diagnosis as these describe more detailed than the standard frameworks what kind of interactions are necessary. A central interaction is the entry of symptom reports including the collection of necessary information. Both ITIL incidents and the CSM TroubleReport format are useful as basis for the information needed for automated fault diagnosis. While CSM, ITIL, and eTOM do not provide techniques, the IA method can be applied for the implementation. It can be used to structure the way how information is received from users and can help in improving the report quality by including tests for symptom reproduction.
CSM interactions and IA method as input for fault diagnosis
3.4
Fault Management Techniques
As explained in Section 2.1, fault management can be subdivided into fault detection, fault diagnosis and fault recovery. Due to the focus of this thesis towards fault diagnosis, the presentation of techniques will focus on this aspect. The diagnosis itself is concerned with fault localization and isolation. The 69
fault diagnosis techniques
Chapter 3. Related Work aims of introducing automated methods on the resource layer were similar to the aims of extending it towards service-orientation: decrease labor cost and improving fault diagnosis accuracy and performance. There are several criteria which characterize fault diagnosis techniques. probabilistic: A diagnosis method can be based on a deterministic or probabilistic modeling of dependencies. modeling depth: The modeling depth can be different which also determines the precision of the automated diagnosis result. For example, the approach in [CKF+ 02] is able to identify a single component out of a set of identical components acting as redundant cluster to be the symptom’s root cause. number of root causes: Many approaches and in particular commercial tools assume a single root cause at a given point in time to ease the diagnosis. An exception is the approach in [ORM05]. Several theoretical considerations show that the problem to find root causes for a given set of symptoms is NP-hard [BCF94, KS95, ORM05]. decentralization: The diagnosis can be centralized or distributed [CYL01]. In the e-business scenario in [MF04] the number of managed objects is very large (100s of objects to monitor per e-business server, in contrast to pure device management). Due to the latency given by geographic distance and network transfer overhead, a centralized correlation may not be possible in some scenarios. active vs. passive: The majority of approaches uses passively received events for fault diagnosis, but it is also possible to actively test components for diagnosis. In recent publications both techniques are combined to improve the diagnosis result. window-based or event-driven: The diagnosis of faults can happen window-based so that all information is collected during a time interval or in an event-driven manner [AGS01, HSV99]. overview papers
In addition to a review of the beginnings of network fault diagnosis in [LWD92], a very good overview of fault diagnosis techniques is given in [SS01, SS04]. The classification of techniques from this paper is depicted in Fig. 3.23.
techniques classification
Fault localization techniques are divided into artificial intelligence (AI) techniques, model traversing techniques and fault propagation models. A subgroup of AI techniques is called expert systems which try to reflect the actions of a human expert. Model traversing techniques use a formal representation of a communication system and propagate failures along the relationships between network entities. Fault propagation models use a priori knowledge how faults propagate in a network. Nevertheless, the classification leaves room for discussion since the distinction between model-based reasoning and model traversing techniques may be fuzzy. In addition, code-based techniques are 70
3.4. Fault Management Techniques Fault localization techniques
AI techniques
Decision trees
Model traversing techniques
Neural networks
Expert systems
Rule−based systems
Case−based systems
Fault propagation models
Code−based techniques Bayesian networks
Dependency graphs Causality graphs
Phrase structured grammars
Model−based systems
Figure 3.23: Classification of fault localization techniques from [SS01]
also usually based on the provisioning of expert knowledge as input so that these systems can also be regarded as expert systems. The remainder of this section will focus on event correlation techniques which is used as a term to summarize techniques dealing with events in network and systems management. Active probing techniques and trouble ticket systems will also be referenced.
Event correlation techniques For fault management on the network and systems level event correlation (aka alarm correlation) techniques have been used since the end of the 1980s. The idea of correlation is to condense and structure events to retrieve meaningful information. This is necessary to reduce the large number of events that may occur in larger computer networks in case of a single fault. Without the use of event correlation techniques the operation staff would receive a lot of error messages in a very short period of time. This phenomenon is called event burst or event storm. Furthermore, it may not be possible to distinguish between important and less important events and important events may be neglected.
event correlation for network and systems management
In [JW95] the task of event correlation is defined as “a conceptual interpretation procedure in the sense that a new meaning is assigned to a set of events that happen in a certain time interval”. We can distinguish between three aspects of event correlation.
aspects for event correlation
Functional aspect: The correlation focuses on functions which are provided by each network element. It is also regarded which other functions are used to provide a specific function. 71
Chapter 3. Related Work Topology aspect: The correlation takes into account how the network elements are connected to each other and how they interact. An important point is the location of monitoring stations within the network as the event correlation has a view on the network based on these locations. This means that only certain paths may be available to a monitored element. If these paths are broken due to failures, the element may be hidden from the point of view of the monitoring station and therefore its status in unknown. A basic technique called downstream suppression exists to detect these hidden network elements, but may be too simple for some situations [Sma01]. Time aspect: When explicitly regarding time constraints, time information has to be added to each event. This can either be a point in time or a duration. In addition, a validity can be added to the events (e.g., a short validity for informative events, while critical events may require an indefinite validity). The correlation can use time relationships between the events to perform the correlation by using a time window whose interval length has to be defined according to the kinds of objects that are monitored. This aspect is only mentioned in some papers [JW95], but it has to be treated in an event correlation system. framework for comparison of approaches
In [HSV99] a framework was presented to make event correlation systems comparable (causal and temporal correlation). The framework makes use of a standardized knowledge representation as dependency graphs. Assuming that all events are present at the beginning, the runtime of correlation is O(number of edges) in a direct acyclic graph (in contrast to the NP-hard general problem of mapping symptom sets to root causes).
development directions
In [JWB+ 00] some future directions of event correlation were pointed out including the need to distribute event correlation using a middleware architecture, globalization of event correlation using the TMN (Telecommunications Management Network) model [Udu99], and the demand for advanced correlation features (e.g. explanation of the content of the derived solutions and their logical reasons).
reference to intrusion detection systems
Event correlation is also used in intrusion detection systems (e.g. [KTK01]) where data from a set of security monitors are processed by a correlation component. Attacks are usually specified as patterns that are witnessed in the network packets. The relation to fault management of these systems should be taken into account because symptoms like high utilization of resources can be an indicator of faults or attacks.
event detection
Event collection and preprocessing Events that are used for event correlation can be collected in different ways. They can result from failed SNMP queries to network elements or can be raised by distributed agents.
event abstraction framework
An important approach towards service-orientation is the SMONA architecture [DHHS06, DS05, DgFS07] that is designed to enrich information from resource management towards service-related information and is in particular 72
3.4. Fault Management Techniques relevant to the Service MIB approach. As shown in Fig. 3.24, the architecture starts from a technology specific layer and aims to access information from already available management tools such as Cacti, Nagios or Grid management tools by providing a set of adapters. The adapter configurator is designed to configure the adapter and therein indirectly the platform-specific monitoring to get the monitoring data as required. The requirements are e.g. specified in SISL (see Section 3.2.1). The RichEvent composer aggregates data received from the lower layers and sends events to the service attribute factory that calculates service attributes based on the events received and can also make use of SISL or comparable specifications. Management Application
Rich Event delivery
Application layer
Service Attribute delivery
SISL
Service monitoring interface Rich Event specification
Integration/ configuration layer
RichEvent Composer
configuration request
Adapter Configurator
Service Attribute specification
Service Attribute Factory event delivery
callback configuration
Unified interface
Platform independent layer
Adapter
Adapter
Adapter
Adapter
Vendor specific interfaces
Platform specific layer
R−GMA
cacti
Nagios
MDS
Technology specific interfaces
Resource layer
DNS Router Node 1
...
Node 100
Legend data flow
configuration workflow
Site X
Figure 3.24: SMONA architecture [DgFS07]
3.4.1 Model-based Reasoning Model-based reasoning (MBR) [Lew99, WTJ+ 97, HCdK92] represents a system by modeling each of its components. A model can either represent a physical entity or a logical entity (e.g. LAN, WAN, domain, service, business process). The model of all physical entities is called functional model, while the model of all logical entities is called logical model. A description of each model contains three categories of information: attributes, relations to other 73
behavior modeling as basis of MBR
Chapter 3. Related Work models, and behavior. The event correlation is a result of the collaboration among virtual autonomous models. simulation possibility
As all components of a network are represented with their behavior in the model, it is possible to perform simulations to predict how the whole network will behave.
ambiguity in common terminology
A paper that is often cited in the context of model-based reasoning is [JW93]. It uses the original MBR definition of Hamscher at al. [HCdK92] which specifies MBR as a reasoning method that it based on a model of a system. However, this broad definition is not well-suited in the context of this thesis because it would include all techniques presented in the following. Therefore, the definition of model-based reasoning given here demands the collaboration of models as entities as characterizing feature.
illustration example
An example for illustration can be found in [Apr00]. Here, a local area network consisting of a router and four end systems is modeled by using a model for each component. These models communicate with their real world counterparts by sending ping requests to them in regular time intervals and request information about their general status. In case a model entity for an end system does not get a response and two retries have failed, a message is sent to the router model requesting whether there are currently problems with the router. If this is not the case at the moment, the end system model entity concludes that there seems to be a problem with its end system and raises an alarm. If a current problem with the router had been indicated by the router model, no alarm would have been raised by the end system model as it can be guessed that the router failure has led to the missing ping response. An example system for MBR is NETeXPERT2 [Netb] which also makes use of rules. For telecommunications a system was implemented in [Mei97] and further example systems were presented in [Nyg95, CCL99].
bottom-up correlation system
Yemanja [AGS01] is a model-based system that aims at correlating low-level network events to application-related events. It uses a behavior model for the entities and rules for correlation. In its application to a web server farm, a layered structure is used where identified causes and symptoms are propagated from lower layers to higher layers. The correlation outcome is stored in a way that both causes are linked to impact and vice versa. Agents are used to collect configuration information via SNMP and from configuration databases. An example, which would also apply similarly to the LRZ Web Hosting Service, is provided where a high bit error rate affects the applications on the web servers.
behavior models related to SLAs
As referred to in the section about dependency modeling, the work of Agarwal at al. [AAG+ 04a] uses dependency graphs for problem determination. In addition, behavior models are used to model the performance of components used for the service operation. The idea is not to use fixed threshold values for reporting threshold violations of resources, but to calculate these dynamically from the SLA conditions. During the SLA monitoring also the resource 2
74
originally from Objective System Integrators, acquired by Agilent
3.4. Fault Management Techniques performance is sampled and the samples are classified into “good” or “bad” according to the propagation of “good” or “bad” SLA performance of the higher-levels. The bad state models for components are tied to a problem situation, while the good state models are universal. The relation of a bad state model to the dynamic threshold determines the severity of the resource problem. A clustering algorithm is proposed to cluster nodes with high severity resulting in a tree structure. The approach uses a single root cause assumption for problem determination.
Related approaches Related to model-based reasoning is the definition of behavior constraints in constraint-based reasoning [SRF97, SBFR99, SRFM01]. A constraint satisfaction problem is defined as assigning values to a set of variables for which constraints apply. It is usually specified declaratively so that it is independent from an implementation. The approach has only been applied to small scenarios yet.
constraintbased reasoning
State transition graphs [Apr00] are a particular type of model. It uses states and transitions between the states as well as tokens which can be placed within the states. Actions are executed on transition between the states. The graphs that are built from these elements describe the problem identification procedure. It is used in Open Service’s3 Nerve Center [Ner].
state transition graphs
Assessment The approach allows to model complex relationships which are encountered in service management scenarios and can therefore in principle be used for service fault diagnosis.
suitable expressiveness
An application of this approach would require to model each service as a logical entity. This includes a detailed modeling of the service’s interactions with other services and the underlying infrastructure whose effort is a critical issue for the applicability of the approach [WTJ+ 97]. While models of resources are provided by vendors like Aprisma, the modeling of services has to happen in a provider specific manner since the services are designed to be different from the ones of the competitors.
effort for modeling
The efficiency of the model collaboration is largely determined by the implementation which is left open in MBR. The technique is therefore often combined with other techniques, in particular RBR. The collaboration of independent models may result in the difficulty of backtracking from a failed correlation.
performance dependent on implementation
3.4.2 Rule-based Reasoning Rule-based reasoning (RBR) [Lew99, JW93] uses a set of rules for event correlation which have the form conclusion if condition. The condition uses received events and information about the system, while the conclusion contains 3
formerly SeaGate
75
Chapter 3. Related Work actions which can either lead to system changes or use system parameters to choose the next rule. the world
the agent
working memory
reasoning algorithm rule base
Figure 3.25: The basic structure of RBR [Lew99] basic architecture of RBR system
In Fig. 3.25 the basic structure of a rule-based system is shown. Events are received from the outside world and stored in a working memory. Rules from the rule base are applied to match information in the working memory which results in updates of the working memory and can also trigger actions in the outside world.
dominant approach in the industry
Commercial systems such as IBM Tivoli Enterprise Console [IBMb], HP OpenView Event Correlation Services [HP a] (based on the open source tool Simple Event Correlator [SEC, Vaa02]), Micromuse Netcool Impact [Neta] etc are based on rules so that this approach can be regarded as the dominating one in the industry. In addition to the use for wired networks, it has also been applied for GSM wireless networks [KBS02]. A well-explained example system (GTE IMPACT system) can be found in [JW93] (see remark on MBR for this paper above).
rule-based transaction monitoring
An approach that addresses a service-oriented scenario can be found in [HCH+ 99] which tries to detect anomalies in transactions by using dynamic thresholds. Starting from events received via SNMP traps or agents, samples are recorded for transactions. Temporal-based performance thresholds for these transactions then form the basis of a rule-based anomaly detection.
approaches for automated rule derivation
An important issue for applying a rule-based system is the generation and maintenance of the rule-base. To avoid the manual encoding of knowledge into rules, automated methods have been addressed. In [ZXLM02] an approach for generating rules out of database data is given which is designed for cellular networks and is able to deal with noisy data. The paper contains a good overview of related work. Further approaches for automatically defining rules can be found in [KMT99, BHM+ 01]. These algorithms can be regarded to be closely related to dependency finding techniques with the difference that dependency knowledge is not directly encoded into rules in the algorithms presented in Section 3.2.2.
76
3.4. Fault Management Techniques Rule types In [JW95] a number of operations have been defined for functional event correlation. This information is combined here with a related study in [Apr04] which resulted from interviews with RBR tool users. • Event compression is the task of reducing multiple occurrences of identical events into a single representative of the events. The number of occurrences of the event is not taken into account. The meaning of the compression correlation is almost identical to the single event, except that additional contextual information is assigned to the event to indicate that this event happened more than once. • Event filtering is the most widely used operation to reduce the number of events presented to the operator. If some parameter of the event, e.g., priority, type, location, time stamp, etc., does not fall into the set of predefined legitimate values, then the event is simply discarded or sent into a log file. The decision to filter events out or not is based solely on the specific characteristics of the event. In more sophisticated cases the condition set could be dynamic and depend on user-specified criteria or criteria calculated by the system. • Event suppression is a context-sensitive process in which an event is temporarily inhibited depending on the dynamic operational context of the operations management process. The context is determined by the presence of other event(s), available resources, management priorities, or other external requirements. A subsequent change in the operational context could lead to the delivery of the suppressed event. Temporary suppression of multiple events and control of the order of their exhibition is a basis for dynamically focusing the monitoring of the operations management process. • Event counting results from counting the number of repeated arrivals of identical events and comparing the number to a threshold. The idea is that a certain number of events can be tolerated, but the exceeding of a threshold should result in a notification. It can be differentiated between the detection of short bursts and the aggregation of events over longer time periods. • Event escalation assigns a higher value to some parameter of an event, usually the severity, depending on the operational context, e.g., the number of occurrences of the event. • Event generalization is a correlation in which an event is replaced by its superclass which allows to get an overview of the network situation. • Event specialization is an opposite procedure to event generalization. It substitutes an event with a more specific subclass of the event. • Event temporality uses a temporal relation between two or more distinct events to correlate them depending on the order and time of their arrival. In particular, this type of rule applies to events that happen in pairs where 77
Chapter 3. Related Work the following events denote the clearing of the previous one. Another issue is the detection of characteristic sequences in the events. • Event clustering allows the creation of complex correlation patterns using Boolean operators over conditional (predicate) terms. The terms in the pattern could be primary events or the higher-level events generated by the correlation process. In contrast to event temporality, events that happen in an arbitrary order can be combined here. While the syntax of rules is usually vendor specific, there is currently an effort to develop a rule markup language for the Semantic Web [RML].
need for efficient algorithm for scalability
Rete algorithm and variants To avoid the inefficient examination of each rule against all known facts in the working memory, the Rete algorithm has been devised by C. Forgy4 [For79, For82]. A tutorial style documentation of the algorithm can be found in [Doo95] which contains less implementation details than the original article. Improved versions of the algorithm scale up to 100,000 rules.
working memory organization in the algorithm
The algorithm is based on the assumption of a static rule base and a relatively static working memory. It is therefore possible to organize the working memory in a way that it reflects the conditions of the rules so that the additional memory is spent for improved performance. The alpha network contains summaries of facts that match constant conditions, while the (optional) beta network contains nodes for matching two or more facts (refer to page 10 in [Doo95]). The Rete algorithm is mainly concerned with the organization of the memory to reflect when changes in the working memory occur.
QoS management approach using policies
Relation to Policy-based Management RBR is related to policy-based management [Slo94] in a sense that policies are a special kind of rules. A policybased approach for QoS management was proposed in [MLKB02] which extends RBR towards service-orientation. Applications are instrumented to monitor the QoS level on a per host basis. Rules are used to carry out specific actions when QoS deviations are witnessed so that e.g. more resources are granted to a given application. In an example scenario for an Apache web hosting server five example rules are given.
advantages of the knowledge representation as rules
Assessment Rule-based reasoning has several advantages which have led to the success of this method in the networking domain. In general, the approach allows for a compact representation of general knowledge about a domain and to emulate the problem addressing steps of experts with symbolic rules [HP07]. The rules are atomic pieces of information which can be added/dropped separately when not affecting others. Modules composed of rules 4
Forgy is still concerned with the algorithm development and runs a commercial company (Production Systems Technologies) for this purpose.
78
3.4. Fault Management Techniques can be tested separately. An explanation of a correlation result is usually easily possible by backtracking the executed rules. This can be helpful to identify inappropriate rules when a correlation has failed. Furthermore, the Rete algorithm and its variants are available which ensure the scalability of the approach for large rule sets. A disadvantage can be that the interference engine does not store knowledge about already performed correlation [HP07].
scalability
In the literature [WTJ+ 97, AGS01] RBR systems are classified as relatively inflexible. Frequent changes in the modeled IT environment may lead to many rule updates which will usually be the case in service management scenarios. These changes have to be performed by experts as no automation method has currently been established. This has the drawback that experts may either be unavailable or may not be experienced to provide their knowledge in a suitable manner. In some systems information about the network topology which is needed for the event correlation is not used explicitly, but is encoded into the rules. This intransparent usage makes rule updates for topology changes quite difficult.
rule-set maintenance
The system brittleness is also a problem for RBR systems. It means that the system fails if an unknown situation occurs, because the rules do not match to this situation. In addition, the method has no intrinsic learning mechanisms.
inability to deal with unknown situations
The output of RBR systems would also be difficult to predict because of unforeseen rule interactions in a large rule set and potentially conflicting rules [Lew99].
rule interactions
The approach by Molenkamp et al. [MLKB02] can be regarded as a first step towards service-orientation. However, some important issues are not addressed in a general way, in particular the maintenance of rules/policies for the adaptation of QoS levels. In addition, it is not clear how to define QoS thresholds and how to instrument the monitoring. Even though the paper addresses the end-to-end monitoring of services, a clear distinction between service provider, its users and suppliers is not made.
partial addressing of issues in related approach
In summary, RBR is suitable for service-oriented event correlation if it is possible to find a scalable solution for the rule generation and maintenance.
3.4.3 Codebook Approach The codebook approach [KYY+ 95, YKM+ 96] uses a matrix containing the relations of symptoms to faults to perform the correlation. The construction of this matrix (called codebook) and its optimization are explained in the following. The approach starts using a dependency graph with two kinds of nodes for the modeling. The first kind of nodes are the faults (denoted as problems in the cited papers) which have to be detected, while the second kind of nodes are observable events (symptoms in the papers) which are caused by the faults 79
dependency graph and its optimization
Chapter 3. Related Work or other events. The dependencies between the nodes are denoted as directed edges. It is possible to choose weights for the edges, e.g., a weight for the probability that fault/event A causes event B. Another possible weighting could indicate time dependencies. There are several possibilities to reduce the initial graph. If, e.g., a cyclic dependency of events exists and there are no probabilities for the cycles’ edges, all events can be treated as one event. matrix construction and optimization
After a final input graph is chosen, the graph is transformed into a dependency matrix where the columns contain the faults and the rows contain the events (see Fig. 3.26). If there is a dependency in the graph, the weight of the corresponding edge is put into the matrix cell. In case no weights are used, the matrix cells get the values 1 for dependency and 0 otherwise. Afterwards, a simplification can be done, where events which do not help to discriminate faults are deleted. There is a trade-off between the minimization of the matrix and the robustness of the results. If the matrix is minimized as much as possible, some faults can only be distinguished by a single event. If this event cannot be reliably detected, the event correlation system cannot discriminate between the two faults. A measure how many event observation errors can be compensated by the system is the Hamming distance. The number of rows (events) that can be deleted from the matrix can differ very much depending on the relationships [Lew99]. From a theoretical point of view the calculation of a minimum size codebook is NP-hard, but heuristics exist and perform well [RBO+ 04]. A1 A2 A3 A4 A5 A6 e1
1
0
0
1
0
1
e2
1
1
1
1
0
0
e3
1
1
0
1
0
0
e4
1
0
1
0
1
0
e5
1
0
1
1
1
0
e6
1
1
1
0
0
1
e7
1
0
1
0
0
0
e8
1
0
0
1
1
1
e9
0
1
0
0
1
1
e10 0 e11 0
1
1
1
0
0
e1
1
0
0
1
0
1
0
0
1
1
0
e3
1
1
0
1
0
0
0
e4
1
0
1
0
1
0
1
1
1
0
0
1
0
1
0
e1
A1 A2 A3 A4 A5 A6 1 0 0 1 0 1
e2
1
1
1
1
0
0
e4
1
0
1
0
1
0
a first codebook (radius 0.5) coded as
A1 A2 A3 A4 A5 A6
e12 0 e13 0
1 1
0
1
1
1
e6
e14 0 e15 0
0
0
0
0
1
e9
0
1
0
0
1
1
0
1
0
1
1
e18 0
1
1
1
0
0
e16 0 e17 0
1
1
0
0
1
1
0
1
1
0
e18 0
1
1
1
0
0
e19 0 e20 0
1
1
0
1
0
0
0
0
1
1
a second codebook (radius 1.5)
a correlation matrix
Figure 3.26: A correlation matrix and two derived codebooks (minimum codebook and codebook with more than one discriminating event) [YKM+ 96]
In [BBMR05] the possibilities to convert rule-based representations into codebooks and vice versa were shown which were applied for optimization. Some assumptions were made (e.g. binary states, independent tests). The conversion 80
3.4. Fault Management Techniques can be useful as rules are a method for decision making, while dependency matrices are more easily understandable. The development of the codebook technique is tied to the commercial tool Smarts5 InCharge [Sma]. Assessment The codebook approach has the advantage that it uses longterm experience with graphs and coding. This experience is used to minimize the dependency graph and to select an optimal group of events with respect to processing time and robustness against noise. It can use class models to derive the codebook automatically.
graphs and coding known techniques
The approach can - in some situations - deal with unknown combinations of events. These can be mapped onto known combinations by using the Hamming distance. However, these optimizations are tied to a binary encoding of the dependencies.
robustness against missing input
The codebook can easily be applied to actually perform the correlation (with a better performance than RBR according to the authors).
correlation performance
For the application of the approach in service-oriented event correlation the maintainability of the correlation matrix is a critical issue similar to the rule maintenance in RBR. Frequent changes in the service implementation will require frequent updates of the dependency graph which could be quite time consuming.
maintenance issue similar to RBR
In addition, it is not obvious how to encode complex relationships (e.g. quality degradations, strengths of dependencies, redundancies, concurrent faults) into a simple dependency graph and the resulting codebook. A further drawback is that a common correlation window has to be applied for the matrix [AGS01]. This is inadequate for service-orientation because service-related information is usually longer valid than events on the resource level.
modeling limitations
If a correlation result has shown to be not correct, it is more difficult to backtrack which part of the initial dependency graph has not been accurate than to check RBR correlation rules.
backtracking more difficult
3.4.4 Case-based Reasoning Case-based reasoning (CBR) is an approach that is based on learning from previous experience. General information about CBR and its first applications can be found in [Kol93, AP94], while network management related concepts are given in [Lew93, Lew95, Lew99]. The approach uses symptom reports from the past that have been formalized and entered into a case database together with an identified solution. The solution of a current symptom aims to reuse the solutions documented for related situations. Figure 3.27 shows the basic steps of CBR and explains the main options that are available for each step [Lew95]. 5
Smarts was acquired by EMC.
81
CBR idea to learn from past solutions
Chapter 3. Related Work case retrieval step
The first step is the case retrieval where related cases are identified in the case database. The match can be performed using a set of key terms that are contained in the situation description. These terms can be predefined by experts or can be determined automatically. Relevance matching is a refinement of the method where a subset of key terms is used for certain symptom types. Rules are applied to map a new symptom to a symptom type. Structure matching uses the structure of descriptions for the matching. Here, a set of relation words can be used like “connected-to”, “part-of” as indicators of the structure. The geometric matching requires that some quantified values can be derived from the cases so that a distance to prior situations can be calculated. In contrast to the previous ways of adaptation, analogy-based matching tries to find a match to cases from a different domain. Event−driven case invocation
Case Library
Retrieve
Key term matching Relevance matching Deep structure matching Geometric matching Analogy−based matching
Adapt
Adaptation by substitution Parametric adaptation Procedural adaptation Adaptation by abstraction Critic−based adaptation
Execute
Organize
Manual execution Supervised execution Unsupervised execution Cooperative execution
Sequential memory Hierarchical memory Meshed memory Belief network Master cases
Figure 3.27: The basic structure of CBR and options for each step [JLB04] adaptation step
The second step is the adaptation of a previous solution. The simplest way is null adaptation which means that it is tried to exactly reapply a previous solution. Adaptation by substitution tries to replace parts of the solution by other components, while parameterized adaptation aims to change parameters being used for the previous solution with respect to the difference of input values from the symptoms. A generalized version of a solution is generated in adaptation by abstraction. Procedural adaptation specifies a procedure to adapt a previous solution. For all the presented adaptation techniques the critic-based adaptation can be carried out additionally. It shows the proposed adaptation to a human operator who can change it manually.
execution step
For the execution of a proposed solution it can be distinguished between manual, unsupervised, and supervised execution. 82
3.4. Fault Management Techniques An important influence factor for the runtime especially for large case databases is the organization of the case database. The simplest organization is to use a sequential organization so that new cases are simply added at the end. If a hierarchy of cases can be constructed (e.g. according to symptom classes), the cases can be organized according to that hierarchy (hierarchical organization). If additional links are added to the hierarchy to indicate that different symptoms are basically equivalent as they refer to the same root causes, the organization is called meshed. Another concept promotes the use of master cases which are cases that are kept separately because they are rated to be particularly important in the future. Therefore, the case retrieval primarily targets the master cases. For probabilistic situations belief networks [Pea88] with appropriate likelihood measures can be applied.
organization of case database
Example systems for CBR are SpectroRx6 [Apr] (also uses MBR technologies in related modules), FIXIT [WTM95], Critter [Lew93], and ACS [PNM99]. Usually the case database of a newly installed CBR system is empty so that a learning curve is required to make benefit from the system. SpectroRx includes a possibility to generate cases initially which are related to the network elements that are automatically discovered by the system.
automated case generation
When applied to service-oriented event correlation, changes in the service implementation result in an inaccuracy of the solutions to prior cases. There are two possibilities to deal with this situation. The first possibility would be to search in the database to identify such cases and to somehow update or delete them which may be cumbersome. The other possibility would be to rely on the approach’s ability to learn which will include an adaptation of the prior cases. The effort for frequent changes using the second possibility can therefore be seen as low when neglecting a slowdown in the correlation due to the inaccuracy of cases in some situations.
two possibilities to update a CBR system
Assessment CBR can express specialized knowledge as cases which can be regarded as an easily understandable way of knowledge expression [HP07]. A CBR system is modular in the sense that single cases can be removed from the case database without affecting the whole system. At runtime cases can be acquired easily, but it should be noted that there are usually no cases given in advance.
knowledge representation
The similarity matching in the adaptation step allows to deal with unknown situations by providing knowledge about related cases. This is also helpful if some pieces of information in the input are missing.
robustness
A running CBR system can be regarded as self-updating since new cases can be entered. This learning capability is an important feature for changing environments such as the ones of service management.
learning capability
According to [Kol93] the CBR inference may require less effort than RBR. However, such a comparison has to be treated with care as e.g. the additional 6
Originally from Cabletron Systems which were renamed to Aprisma Management Technologies and then acquired by Concord, now part of Computer Associates
83
Chapter 3. Related Work effort for the CBR adaptation step should not be neglected [SS01]. potential drawbacks
There are also difficulties when applying the approach [Lew99]. The fields which are used to find a similar case and their importance have to be defined appropriately. The method is not able to express general knowledge and missing cases may lead to adaptability problems [HP07]. The organization of cases in a case library may be difficult and may lead to interference problems. The explanation of an automatically derived solution may not be intuitive so that potentially wrong knowledge may be difficult to find.
3.4.5 Probabilistic Approaches probabilistic fault models
In a nondeterministic fault model event correlation aims at finding the most probable explanation of the observed symptoms. Some research has been performed in the past to find appropriate heuristics for solving this problem in polynomial time, including a divide-and-conquer algorithm [KS95]. Another approach to deal with uncertainty is based on belief networks [Pea88] which has been applied to light-wave networks and link faults in dynamically routed networks. Both techniques are tailored towards specific applications and focus on particular types of faults. Their uncertainty model is restricted by not allowing the modeling of non-determinism within relationships between objects.
neural networks for fault diagnosis
Neural networks have not only been applied to the detection of dependencies (see Section 3.2.2), but also for event correlation [WTJ+ 97, Wie02]. The reported approach deals with the correlation of events for mobile cellular networks (GSM). The idea is to let a neural network find a mapping function of an event vector to a set of root causes which has however only been carried out for small examples. Despite of the general advantages of neural networks such as the ability to learn any mapping without prior expert knowledge and their resilience to noise, a neural network based approach has major disadvantages for service-orientation. Changes in the service implementation would require frequent reconfigurations of the neural networks. This can hardly be carried out in a timely manner because training data would have to be acquired and the networks have to be trained again. In addition, a wrong modeling of the neural network (e.g. concerning the input parameters) can hardly be detected due to the non human-readable mapping functions.
probabilistic approach using belief networks
Incremental Hypothesis Updating [SS03] is based on a probabilistic modeling using belief networks. The modeling of dependencies is limited to direct dependencies which means that symptoms are related directly to root causes in a bipartite graph. Redundancies cannot be modeled. The algorithm that is built on these assumptions continuously provides a set of hypotheses over time ordered by a probability measure. It is not limited to a single root cause assumption and does not use a global correlation window. In its version in [SS03] the algorithm incorporates positive events and is modified for resilience to lost or spurious symptoms. The reason why a probabilistic approach was chosen is motivated by the dynamic of change that is witnessed in today’s systems. 84
3.4. Fault Management Techniques A similar modeling is the basis for the passive monitoring part of the system developed in [TASB05].
Assessment In contrast to other domains like speech recognition, probabilistic approaches have not been applied successfully to fault diagnosis in a real production environment yet. The scalability of the approaches in practice can therefore be regarded as unknown even though other current limitations of the latter approach (e.g. redundancies) seem to be avoidable with appropriate extensions.
scalability unknown
The argumentation for proposing these methods is based on the dynamics of service implementation which might not allow to accurately model the dependencies. However, one important difference to domains like speech recognition should not be neglected. Here, the dependencies are understandable to humans and can in principle be modeled which is not the case for other domains. It is e.g. not known how speech recognition in the human brain really works. In contrast to setting artificial probability values which may be difficult to fine tune in practice, it is proposed in this thesis to model dependencies up to a certain degree in an accurate manner and to allow for a flexible variation of the modeling depth according to the needs of the given environment.
probabilistic modeling for fault diagnosis doubtful
3.4.6 Hybrid Approaches The approaches that have been presented before do not exclude each other. In contrary, there are multiple ways of combining these approaches. Presuming the hybrid approach that is proposed in this thesis, the broad overview spanning a variety of domains for combining rule-based and case-based reasoning approaches given in [HP07] is highlighted here. The authors propose a classification scheme (depicted in Fig. 3.28) which is based on the coupling methods that are applied.
methods do not exclude each other
The first distinction that is made is between standalone and coupled approaches. Standalone combination means that RBR and CBR systems are invoked independently and the users compare the results of the systems manually, while coupled systems interact with each other. Among the coupled approaches it is distinguished between sequential processing where the components interact as a pipeline, embedded processing where one component is the primary problem solver and others are embedded into it and co-processing where different modules act in parallel. The sequential processing can happen in a loosely coupled or tightly coupled manner. For the tight coupling it can be differentiated between an invocation of the second component that happens in any case or only under certain conditions. Subtypes also exist for the co-processing type of coupling. Here, the focus can be on cooperation which refers to a continued cooperation to produce a common result and on reconciliation which refers to the merging of results at the end. The cooperation of components can happen implicitly or explicitly. In the latter case an
RBR/CBR classification scheme
85
Chapter 3. Related Work additional controller component is integrated to manage the collaboration of reasoning modules. approaches combining RBR and CBR
coupling
standalone
sequential processing
loosely coupled sequence
embedded processing
tightly coupled sequence
compulsory sequence
conditional sequence
co−processing
cooperation oriented
reconciliation oriented
implicit explicit reasoning reasoning control control
Figure 3.28: Classification of combination possibilities of RBR and CBR [HP07]
In the paper example systems are given for each classification leaf. The approach that is developed in this thesis is (correctly) classified as sequential with loose coupling, while the approach of Jakobson, Buford, and Lewis that is the only one from a related domain is classified as cooperation-oriented with implicit reasoning control. related approach for highly dynamical situations
This approach [JBL04, JLB04, JBL05] combines RBR and CBR to deal with highly dynamical situations (e.g. telecommunication networks, battlefield scenarios). The main tasks of the system are situation awareness and situation diagnosis which refer to the detection of isolated relations in a situation and the analysis of a complete situation, respectively. A situation is modeled as the state of components at a certain point in time. In the proposed architecture an RBR and a CBR system run in parallel. The RBR engine uses temporal and spatial dependencies to correlate reported events, while the CBR engine makes use of prior situation templates. The CBR templates try to match the correlated events to get an interpretation of the current situation which can then influence the further processing in the rule-based engine. Currently, only few details of the system are provided which is developed by a commercial company (Altusys, [Alt]). According to the authors this work has been the first attempt to combine RBR and CBR techniques in the network and systems management domain.
hybrid system for computer service support
For computer service support the CANASTA System [Lew93, RR91] has been designed as a hybrid rule-based/case-based system. The system architecture is multi-layered. The first-level module (symptom/solution module) uses simple rules which are similar to the actions that the support staff would 86
3.4. Fault Management Techniques perform in the beginning. The aim is to find a direct match of the symptoms to a previous solution. In the layer below the deeper analysis module contains a list of decision trees and instructions from troubleshooting manuals. If the problem can also not be solved in this layer, it is treated by the unresolved crash module where similar prior cases are retrieved. In this scenario similarity is e.g. given by same software modules where the problems originated from. For the whole management system, i.e. all the three previously described layers, a case database is in place. It stores whether the problem is resolved at all and, if yes, by which module. The analysis in [HP07] shows that RBR/CBR combinations have been receiving an increased interest in the recent years. The authors see the reason for this in an orthogonality of the approaches in a sense that RBR is a suitable way to deal with general problem knowledge, while CBR is appropriate for storing specialized knowledge.
increasing interest in RBR/CBR combinations
3.4.7 Active Probing The methods that have been presented in the previous sections rely on the passive monitoring of events and their automated correlation to gain some result in the first place which may then be actively diagnosed by operation staff.
passive methods referenced so far
In the recent years other approaches which are subsumed here as active probing techniques have been devised which include active tests in the automated diagnosis. A Java API for this purpose, i.e. for testing resources in fault management, has been addressed in [GBK01]. In [KH04] a technique for the combination of probing results for networking services was presented. A divide-and-conquer approach was presented in [RBO+ 04] where subsets of combined tests are used to test a whole system. For those parts of the system where symptoms are witnessed, more detailed probes are sent so that the root cause can be isolated iteratively. In summary, the system uses preplanned probes for problem detection and adapted active probes for problem diagnosis. The approach in [GKK04] also uses an adaptive probing scheme using synthetic transactions to avoid the theoretically NP-hard diagnosis using predetermined probes.
active probing approaches
In [ORM04, ORM05] an active probing technique for multi-fault diagnosis was devised. The algorithm is based on the assumption that at most one change (up/down) occurs during each iteration. Such a change can then be diagnosed according to inconsistencies in probing results.
multi-fault technique
Active probing can also be combined with event correlation techniques. In [TASB05] the idea is to use additional tests to deal with spurious or lost symptoms in fault management based on a fidelity evaluation. Active probing is combined with passive monitoring (RBR technique) for telecommunication services in [SS06].
combining active probing and event correlation
87
Chapter 3. Related Work Assessment Active probing is a useful technique to specifically gain more information for isolating a root cause. The most promising way is to combine this technique with information gained from passive monitoring.
3.4.8 Netcool as Example of a Commercial Product In order to show the service-orientation in the industry a commercial product is presented here in some details which can be regarded as representative for a state-of-the-art tool. Micromuse Netcool [Neta, Net03, Net04] (acquired by IBM in February 2006) defines a correlation hierarchy which is depicted in Figure 3.29. Service Correlation Policy Correlation Topology Correlation (Root Cause Analysis) Event Reduction and Device−Level Correlation Collected Events Discovered Topology (exclusive data) (inclusive data) Figure 3.29: Netcool correlation methods [Net04]
Input: The input for the correlation is based on collected events and on the network topology. Netcool offers methods to automatically detect the network configuration. Event reduction: On this layer simple rule-based correlation methods are applied to reduce the number of events. Typical examples are deduplication of identical events (includes counting within a time window) and associations of related events (e.g. “link up”/ “link down”). Device-level correlation: This correlation which is also called microcorrelation looks for deviations from expected behavior at the device level. Correlation at this granularity level requires collecting a number of metrics from within the device “MIB” and drawing conclusions across those metrics so that only a “true” event is returned to the operator console. Topology correlation: Topology correlation (in terms of Netcool also denoted as topology-based root cause analysis) is a tool within Netcool that relates events on one device to those on other connected devices. The result is a suppression of alarm notifications that are symptoms of failures elsewhere in the infrastructure. The method applied at this stage has similarities to the codebook approach, but uses graph diagrams. 88
3.4. Fault Management Techniques Policy correlation: Policy-based correlation methods in the Netcool suite typically rely on external knowledge about events coming in at the collection layer. For example, a critical alarm might be reported showing that a system is down. But if an organization knows (because of information stored in an external data source) that maintenance is currently being performed on that system, the event can be suppressed or de-prioritized, e.g. changed from a critical to a benign event. Service correlation: In Netcool performing correlation at the service layer means relating incoming raw events or correlated data to defined, endto-end services within the organization. This requires establishing a “service model” that defines interdependencies between the service and the underlying infrastructure. The status of the service is correlated to the underlying events or alarms to generate information about the status of the overall service. The tool is applied for identifying service-affecting problems, prioritizing and accelerating operational responses, and communicating service status to affected constituencies within the organization. The service correlation in the tool has limitations with respect to the requirements that have been derived. The tool is not able to include customer information into the correlation workflow and is limited to a bottom-up correlation where effects on the resource level are mapped to services which may not be precise enough. It does not include measurements of the service quality and active probing at the SAP. An organization that wishes to apply the tool for service management has to devise a service model on her own.
limitations in service orientation
3.4.9 Trouble Ticket Systems For problem resolution and processing of customer requests a storage method for documents and actions involved in the processing is needed. A method for doing so is to define a field structure for these documents which are then called trouble tickets (TTs) [Lew93]. For problem management a TT contains documented failure and other problem descriptions [DV95], while a TT for configuration management can also document a change in the configuration. A TT has a status like open, accepted, rejected, diagnosed, assigned, in progress, resolved, verified, and closed. Other information fields contain ticket identification, issuer identification, component/service affected, time stamp, problem description, and information concerning the trouble ticket processing (service desk contact, assigned expert, priority, etc). An important design issue is whether free text is allowed for certain fields or whether a choice between given keywords has to be made. The free text option gives more possibilities to describe the problem, but can make the classification of TTs and the search for a certain TT more difficult.
content of trouble tickets
A system to manage and store the TTs is called a trouble ticket system (TTS, [HAN99]). While a minimal TTS only needs to consist of the storage component itself and input/output components, several extensions are possible (see
trouble ticket system
89
Chapter 3. Related Work Fig. 3.30). The input/output components need to be enabled for multiuser access and have to be accessible via different technical interfaces like E-Mail, WWW, or documentation systems.
refinement
minimum TTS output
expert system diagnosis
Trouble Ticket Database
Knowledge Database filtering
actions input
Figure 3.30: Components of a trouble ticket system [HAN99] action execution extension
Several actions are usually linked to the TTs. Therefore, an action module can be added to the TTS in order to enable the direct execution of actions. The component is instrumented by rules so that certain field values in a TT lead to associated actions.
refinement extension
For statistical means like the calculation of the mean time for the processing of TTs or to extract the most frequent symptoms and faults, a refinement component can be added. Starting from these statistics, other characteristics can be derived concerning the QoS, staff workload (service desk staff, second level support) or for improving the workflow. In addition, trends like an increasing number of problems with a set of components can be witnessed. Repeated processing of similar user requests which are based on an inappropriate service usage by the users can be detected and can lead to an update of the FAQ section on the usage instructions web page of the corresponding service. The refinement component can also be used to get an overview of the current situation by e.g. showing all current critical TTs which are unresolved.
filtering extension
A filtering component can be applied to reduce the number of tickets that are stored by the TTS. This is useful to improve the quality of the database to allow for an easier retrieval of meaningful TTs.
quick tickets
In general, a TT is generated for each problem that cannot be solved by the service desk immediately making it necessary to forward the problem to experts. However, a ticket might be generated in some situations to document the advise given to users and for statistical purposes. A ticket generated for this purpose is called quick ticket (QT). It contains only basic information and is not assigned to an expert.
TT diagnosis
A TTS has to be integrated into the management environment as depicted in Fig. 3.31. The diagnosis of TTs can be supported by the techniques presented above [Lew93]. In particular, it can be combined with case-based reasoning 90
3.5. SLA Management telephone
web access
IA client
user provider
hotline
expert
IA server systems management platform
Trouble Ticket System event correlator
network management platform
... management tools network and administrative X.500 systems information documentation data repositories
Figure 3.31: Integration of a trouble ticket system [HAN99]
when treating a trouble ticket as a case [DV95]. This means that similar TTs can be retrieved to solve a current TT. In addition to the commercial BMC Remedy ARS [BMCa], which was mentioned in the LRZ scenario, and other commercial tools, there are also open source TTS. Apart from dedicated TTS such as OTRS [OTR], it may also be possible to adopt software bug tracking systems (GNATS, [GNA]). Currently, the open source systems have some limitations of their functionality so that they do not seem appropriate for large scale deployment, but they are useful for smaller scenarios.
3.5
available systems
SLA Management
Service fault diagnosis has to be regarded as part of the provider’s fault management and also in context with service management in general. The related context within the overall service management can be referred to as SLA management. While the interfaces of fault diagnosis have already been shown in a high abstraction level in the description of ITIL and eTOM (see Section 3.1), this section deals with the technical solutions for these areas and their interplay with service fault diagnosis.
context of fault diagnosis
After the presentation of possibilities to define SLAs, some more information is given about the specification of QoS parameters and their measurement. Finally, methods for impact analysis and recovery management are presented.
section outline
91
Chapter 3. Related Work
3.5.1 SLA Specification and Management In [Pas04] the usual contents of SLAs are summarized as follows which relate to the roles, service features, and responsibilities of the SLA. • Contracting parties including external parties which help for monitoring and conflict resolution • Specification of services including length of subscription and QoS parameters for which measurement, monitoring and reporting methods are defined to judge the fulfillment of the SLA • Legal consequences of failing to meet the QoS guarantees which comprise penalties and possibilities to terminate the contract • Process definitions for incident management, change management and for resolving conflicts • General terms, payment conditions, and legal circumstances SLA types
In ITIL subtypes of SLAs are defined to differentiate between different scenarios. An operational level agreement specifies an SLA with an organization-internal customer. A contract with a subprovider which is used to ensure the fulfillment of other SLAs is called underpinning contract.
SLA structures
There are also three kinds of SLA structures which are differentiated. A service-based SLA is valid for all customers and has no individual conditions. In contrast, the customer-based SLA specifies conditions that are individual to this customer. The third kind called multi-level SLA is a composition of both other types to allow for a partial customization. It has a three level structure which aims to reduce the maintenance effort by allowing for the reuse of its upper parts. The corporate level contains general conditions for all customers. The customer level below contains customer-specific extensions which are independent of a specific service, while the service level (lowest level) specifies conditions only applicable to a specific service for one respective customer. The usual durations of SLAs are one year up to five years, but can be significantly shorter (e.g. for Grid services). 80% of the SLAs undergo changes in their lifetime [Pas04].
SLA language overview
SLA languages In addition to a protocol for SLA negotiation (SNAP, [CFK+ 02]) a variety of languages has been proposed to formalize SLAs in XML such the Quality Management Language [FJP99], Contract Definition Language [BCS99], or Web Service Level Agreement (WSLA) [KL02] and the resulting standard WS-Agreement [WSA05]. The latter one, for instance, defines a set of potential SLA elements which are parameterized for a given scenario. SLA elements are also proposed in the SLAng language [LSE03].
workflows as SLA basis
In [Sch00, Sch01b] workflows are combined with SLAs to allow for customer-orientation of contracts. In addition to providing a workflow for 92
3.5. SLA Management the specification of SLAs, the SLAs themselves define QoS parameters in relation to workflows of the service usage. Service Level Management A variety of issues arises in the context of service level management (SLM) for which a good overview can be found in [Lew99]. Problems arising when dealing with SLAs across domain borders are addressed in [BCS99].
SLM issues
SLA management is addressed in ITIL by defining a specific SLA management process. The NGOSS framework addresses SLA management by providing a special SLA management handbook which is quite detailed and is not limited to telecommunications services.
ITIL/NGOSS recommendations
SLM tools from several vendors are available in a significantly growing market [Pas04]. Limitations of these tools are the fixed implementation of contract conditions and metrics which are only customizable using predefined parameters. The understanding of SLM differs among the tools [LR99]. Some vendors promote statistics reporting as the essence of SLM (e.g. InfoVista [Inf] which provides network, systems, and application statistics), while other vendors promote application monitoring, service deployment, business process re-engineering, supplier/consumer negotiation, or contract development as the essence of SLM.
SLM market
3.5.2 QoS Specification The selection of QoS parameters in SLA management bears a conflict between provider and customer which is called semantic disparity problem [LR99]. Parameters that are easy for providers to measure do not translate well into parameters that are readily understood by customers and may not serve their needs. In contrast, parameters that are readily understood by customers are not easy to measure by providers.
semantic disparity problem
Parameters that are easy to measure include component uptime/downtime, mean time between failure and repair, link utilization, and packet loss. The actual goal for the customer is happiness which is difficult to measure. Measurements of application reliability, response time, jitter can be regarded as indicators for that.
parameter features
There are three approaches to deal with this problem. Techno-centric approach: Providers show customers how low-level service parameters translate into high-level parameters which reflect the health of the customer’s business processes. Such tools and methods are readily available. Happy medium approach: Provider and customer search for parameters that are both easily measurable and meaningful for the customer. This approach is appropriate in many situations where such parameters can be identified. 93
Chapter 3. Related Work User-centric approach: Providers find some way to measure some servicerelated parameters of interest to customers, typically availability, reliability, and response time. This approach calls for appropriate management tools and such tools are still in development. Due to the increasing competition in the service market, the provisioning of such parameters can be an important competitive advantage of a provider in comparison to others. mapping of parameters
Another problem arising in this context is the SLM translation problem. It means the problem to derive inferred, higher level service parameters from raw service parameters. In [DK03] it is proposed to map WSLA quality metrics onto resource metrics. For doing so, the CIM resource representation is extended with additional classes. In [DR02, DR03] a language called QUAL is proposed for mapping QoS parameters onto quality attributes of devices called QoD (quality of device) parameters which can be regarded as general approach to the work carried out for WSLA and CIM.
monitoring by third party
Another issue is the possibility to allow a third party to monitor the service quality (see [BSC04] for a discussion of how to integrate the third party into the customer provider interaction). This could be useful to decide whether the service has been provided correctly or not (independent from customer and provider). Customer-oriented QoS Measurement In his PhD thesis Markus Garschhammer [Gar04] provides a methodology for defining and measuring QoS parameters in a customer-oriented way addressing the following requirements. Provider independence: The definition of QoS parameters has to be independent from the provider’s service implementation. This is needed to make the service offer transparent to the customer and to allow a comparison with the offers of other service providers. In case of a bid invitation where a customer defines a service which he would like to have, such a provider independent definition would also be useful. Service life cycle: The QoS definition should be applicable to all phases of the service life cycle. While most QoS definitions only deal with the usage phase of a service, it should also be possible to define QoS parameters during the other phases. Genericity: The QoS definition should be applicable to all kinds of services and should therefore be as abstract as the MNM Service Model. Expressiveness: The QoS definition should be as declarative as possible so that it can be read by a human reader (customer-centric). On the other hand, the definition has to be precise enough to avoid ambiguities. Both aims help to improve the understanding between customer and provider. QoS for management: While the QoS definition today mainly deals with the usage functionality of a service, it should also be possible to define QoS 94
3.5. SLA Management parameters for service management. If e.g. a user of the LRZ Web Hosting Service would like to change the content of her hosted web sites, the time it takes until this change will be performed could also be part of the SLA. The approach is based on the MNM Service Model (see Section 2.1) which contains a QoS parameter class without specifying the way of measuring its fulfillment. To achieve a QoS measurement independent from the service implementation, the idea is to perform the QoS measurement attached to the SAP/CSM access point. customer
service client
provider service access point
service access point listener primitives QoS event generator QoS event QoS event correlator measured QoS value
CSM client
CSM access point
statistical postprocessing measured QoS
service mgmt implementation
Figure 3.32: QoS measurement process [Gar04]
The QoS measurement process displayed in Fig. 3.32 consists of four steps. Listening to SAP calls: A call at the SAP is the start of the QoS measurement. As it can not be presumed that such a call can already be detected for all kinds of interactions, a class called “SAP attachment” is added to the MNM Service Model. This class adds a functionality to the SAP which allows a detection of SAP calls (and responses) and provides information about the SAP calls as “primitives”. Generation of QoS events: The result of this activity is the provisioning of “QoS events” which is done by the class “QoS event generator”. This class gets “primitives” as inputs and processes them in a way that more meaningful events with respect to the SLA fulfillment are generated. Such events can be the result of the filtering of primitives or the grouping of similar primitives into a single event. It is also possible to define events based on a more complex occurrence of primitives. QoS event correlation: In the “QoS event correlation” class a correlation of QoS events is performed. The result of the correlation is an instance of 95
extension of MNM Service Model
Chapter 3. Related Work the class “QoS measurement value”. A correlation could e.g. be performed for two events which were generated for the request of a web site. It can be figured out that the second event indicates the completion of the web site request indicated by the first event. The time stamps of both events can then be used to calculate the access time. Statistical postprocessing: The “postprocessing” class receives the QoS measurement values and performs a statistical analysis to determine whether the agreed QoS has been met. applicable for usage and management QoS proxy for third-party monitoring
The QoS measurement cannot only be used to measure the usage QoS, but also to measure the management QoS. For doing so, the listening to interactions has to be performed at the CSM access point. The approach can also be extended for an independent third party that monitors the service quality. In this case the third party has to get access to the SAP primitives. A possibility for doing so is to introduce a SAP proxy between the SAP and the service client. The primitives are then measured at the SAP proxy and used for the measurement process which is then performed by the third party. The measurement result can be made available at an interface accessible by customer and provider.
3.5.3 Impact Analysis and Recovery Management fault recovery phase
As explained earlier, fault management can be divided into fault detection, diagnosis, and recovery. The output of the diagnosis that is addressed in this thesis are resource faults for which a suitable way for fault recovery has to be identified. This decision should be based on the impact that a current fault has on the provided services. Here, two approaches for addressing this issue are presented.
impact estimation for decision making
Management by Business Objectives Bartolini and Salle [BS04, SB04] approached the management of SLAs from a business perspective called Management by Business Objectives (MBO) (also named Management by Contract in earlier versions). A modeling of SLAs and an algorithm to decide which effort should be applied to meet an endangered agreement are presented. A formalization of the cost of violating the agreement is needed as input which is not part of the approach. It is important to note that such an input should not be limited to financial penalties in the SLA, but also has to formalize long term effects on the provider’s reputation in the market. In [BST06] an example of incident management is given where incidents are prioritized with respect to business objectives. A forecasting function is used to determine the impact on SLAs. A related publication [RSM+ 07] presenting a tool for scheduling changes is also relevant in this context since recovery actions as a special kind of changes also need to be scheduled with respect to similar constraints. 96
3.5. SLA Management Framework for Impact Analysis and Recovery of Resource Failures with Respect to SLAs In the PhD thesis of David Schmitz [HSS05b, HSS05a, Sch07] a framework for service fault impact and recovery analysis is developed. Its idea is to start from an actual or assumed resource failure and to retrieve affected services and customers. The framework can therefore be used on a short term perspective to decide about actions to be taken and also on a mid term perspective to identify critical resources which can serve as input for further planning activities. The framework consists of a set of components depicted in Fig. 3.33 and their interactions which are explained in the following.
SLA database QoS measurement
5: current service QoS
service usage monitoring and prediction 6: affected services
4: affected services
service MIB
3: affected services
SLA verificator
7: service usage
8: SLA information
service management
framework purpose
service usage database
customer service management
10: recovery information 9: expected cost
2: affected resources network and systems mgmt 1: resource failure(s)
network topology
systems configuration
recovery actions repository
recovery management
Figure 3.33: Service fault impact and recovery framework [HSS05a]
The solid arrows indicate the general workflow to perform the impact analysis and fault recovery. At first, the network and systems management which denotes a resource management solution receives one or more resource failures as input (step 1).
resource failures as input
Using the dependencies on the resource level which are contained in the network topology MIB and in the systems configuration, other resources which are affected by the failure can be identified. If there is e.g. a hard disk failure on an end system, it is possible that processes running on this system will not work properly anymore. Information about affected resources is transferred to service management (step 2).
impact on other resources
In the service management the services which use the malfunctioning resources are identified traversing the dependencies between services and resources. At this point the severity can be derived to some extent. If e.g. a service is provided using five redundant servers and one of these servers is
impact on services
97
Chapter 3. Related Work currently not reachable, the impact on the service quality may be low. In addition, the dependencies between services are used to retrieve other affected services. Information about both types of dependencies is contained in the Service MIB (compare Section 3.2). At this stage it would be possible to draw conclusions regarding the service quality, but this QoS would not be implementation independent and is therefore not regarded as sufficient. The list of all affected services including the expected QoS degradation is transferred to the SLA verificator (step 3). The SLA verificator has access to the SLA database which contains the SLAs to be considered and is responsible for determining the actual impact on customers using the following steps. QoS impact determination
While the QoS is derived by service management in a provider-oriented way, the quality a user actually receives should also be taken into account in the impact analysis. This customer-oriented quality has to be measured in any case as it is used for the definition of customer-oriented SLAs. Here, this kind of measurement can be regarded as a control procedure for the providerinternal derivation result. Therefore, the list of affected services is sent to the QoS measurement (step 4) and information about the severity of the service quality degradation is transferred back to the SLA verificator (step 5). The QoS measurement component specified according to the work of Garschhammer intercepts interactions at the SAP and can therefore determine the service quality in a customer-oriented manner since no implementation-dependent knowledge has to be used.
influence of current and predicted service usage
To determine the expected costs for not correctly providing the service, the current service usage by customers (and their users) is taken into account. If e.g. a service is not working properly, but it is only used by few customers whose SLAs do not contain severe penalties, then the impact can be classified as low. Prediction models can be applied to get an expected service usage for future time intervals. To get such usage information, the affected services are sent to the service usage measurement and prediction (step 6). The result is received by the SLA verificator in step 7.
customer information and recovery management
To keep the customers informed about the status of the services with respect to the SLAs, information gathered so far is transferred to the CSM (step 8) which is designed according to Section 3.3.1. From the collected information the SLA verificator can now determine an expected cost function over time for not repairing the resource failure(s). This piece of information together with the resource failure(s) and corresponding repair possibilities is reported to recovery management (step 9). It decides which recovery steps should be performed and tracks the recovery progress. For doing so, it has access to a repository that stores potential recovery measures for the resources. The customers are kept informed by transferring information to the CSM (step 10).
98
3.6. Summary
3.6
Summary
A summary of this chapter is given in the following to highlight the contributions and limitations of the state-of-the-art in comparison to the requirements of service fault diagnosis.
Workflow requirements The analysis of state-of-the-art workflows concentrated on the widely adopted best practice frameworks ITIL and eTOM which are assessed in Table 3.1. Requirement details Genericity (G1) Scalability (G2) Low effort (G3) Workflow granularity (W1) Techniques and tools (W2) Cross-layer interaction (W3) Workflow monitoring (W4)
ITIL ++ + 0 – +
eTOM + + 0 0 + 0
Table 3.1: Workflow analysis summary
Both frameworks aim to be generic which in particular applies to ITIL, but is also fulfilled in eTOM despite of its telecommunication origin. The frameworks aim to be applicable for large scale-services so that the scalability is ensured. The effort for implementing the workflows and their maintenance can only hardly be judged as this is very much dependent on the scenario and on the way this implementation is carried out.
generic and scalable
The workflow granularity is a major weakness of ITIL as the description of workflows is very abstract and sometimes even inconsistent. For example, it is not clear how to classify an incident as “major” so that it needs a special treatment in comparison to others. The workflows within the management processes, in particular Incident Management, are not precise in the way that these subprocesses should interact. While the workflows in eTOM are not further decomposed at a certain level, their derivation has been carried out in a systematic manner until this point.
high-level workflows
The tool support in both frameworks is addressed only by mentioning briefly some methods which may be applied. It is basically limited to giving references which are not really integrated into the presented workflows.
missing tool support
The collaboration across layers is addressed in eTOM in a much more systematic way than in ITIL. The layers are clearly separated in a way that is suitable to the general scenario. An advantage of ITIL is the assignment of roles which can however easily be adopted by eTOM. For the workflow monitoring the notion of key performance indicators is introduced in ITIL which
layer structure in eTOM preferable
99
Chapter 3. Related Work is a useful method to monitor the performance of the fault diagnosis. eTOM does not provide a direct assistance for this. extension of eTOM promising
As a consequence, an extension of the workflows in ITIL and eTOM needs to be carried out as these workflows are not detailed enough. It seems more promising to use eTOM as basis for this due to the systematic decomposition of tasks and the suitable definition of layers. Tool support has been identified as a major challenge which is often crucial for implementing a workflow in practice. Management information repositories The section about management information repositories presented four standards and the research approach “Service MIB”. It should be noted that Internet Management and CIM are much more concrete than SID and in particular CMDB so that the judgment of the latter ones is based on what would be expected from an implementation. The same holds for the Service MIB. The assessment of the management information repositories is given in Table 3.2. Requirement details Genericity (G1) Scalability (G2) Low effort (G3) Scope of managed objects (M1) Fault management attri. (M2) Dependencies (M3)
SNMP – + 0 – + -
CIM + 0 + 0
CMDB + 0 0 + 0 0
SID + 0 0 + + 0
SMIB + + 0 ++ + ++
Table 3.2: Management information repositories summary
scalability limitations in CIM
Apart from SNMP (Internet Management) that is mainly limited to Internet devices, the information repositories are not limited to a specific application domain. The scalability of SNMP can be regarded as positive as its MIBs are widely adopted. In contrast, the very detailed modeling in CIM makes it difficult to model even small scenarios with the model. ITIL’s CMDB, SID and the Service MIB clearly address this goal, but it cannot be finally concluded for SID and the Service MIB to what extent it can be reached. The low effort requirement is closely related to the scalability in this context.
limited scope in SNMP and CIM
The scope of managed objects is limited to resources in Internet Management which also applies to modeling in CIM. Implementations of the CMDB and SID should in principle contain service related information which is in focus of the Service MIB.
fault management attributes addressed
Within the limited scope of Internet Management and CIM fault management attributes are considered. The high-level nature of CMDB does not give details about this issue, but it should in principle be covered. Information about this should be contained in implementations of SID and the Service MIB.
100
3.6. Summary A major drawback of today’s approaches is the modeling of dependencies (see also the detailed analysis in [Mar06]). Dependencies are not covered by Internet Management in a direct manner, but they are hidden at different places. CIM contains several dependency classes which are limited to resource-oriented management and are not suitable for the needs of serviceorientation (e.g. since a service is defined as being provided on a single host). The CMDB recommendations only state that component workflows should be described which indirectly refers to the dependencies, while in SID such information is also not treated in detail. The Service MIB aims in particular to fill this gap and specifies the dependencies in the calculation of service attributes.
limitations of dependency modeling
In sum, SID and the Service MIB are promising approaches which are currently addressing the limitations that have been stated. As these models are not fully specified yet, this thesis will provide an own model tailored to the specific needs of service fault diagnosis. It incorporates the dependency modeling that has been devised in [Mar06].
specific service fault management model in this thesis
Fault management interfaces Apart from briefly referencing the generic recommendations that are given in ITIL and eTOM for the service desk function and the CRM processes, two approaches were analyzed in depth for implementing a fault management interface. While the CSM contains detailed workflows and provides templates for information to be exchanged, the IA gives a specific method to collect information for symptom reporting. The contributions and limitations of these approaches are detailed in Table 3.3.
specific approaches for service fault management
Requirement details Genericity (G1) Scalability (G2) Low effort (G3) Symptom reporting function (F1) Symptom prediagnosis (F2) Plausibility checks (F3) Change of reports (F4)
CSM + + 0 + 0 +
IA + + 0 + + + 0
Table 3.3: Fault management interfaces summary
The CSM and IA are not limited to specific kinds of services so that they fulfill the genericity requirement. Their implementation at the LRZ (partially in case of the CSM) shows that these concepts are also useful for large scale environments. The effort for maintaining the CSM and IA depends on the actual implementation.
generic and scalable approaches
The possibility to report symptoms is addressed by both approaches, but in a different manner. The CSM recommendations provide workflows of what needs to be done (in a greater depth than ITIL/eTOM), while the IA proposes a special methodology for collecting the information. The symptom prediagnosis (including e.g. the attempt to reproduce the reported symptoms) is not
workflows in CSM, decision trees in IA
101
Chapter 3. Related Work explicitly addressed in the CSM, while it is a feature of the IA decision tree that may contain specific tests. Plausibility checks are covered by the CSM in a way that at least the identity of customers should be verified when reporting certain symptoms. The IA can again include specific tests in the decision tree. Further workflows for changing reports are detailed in the CSM. In contrast, the IA did not specify workflows to change reports explicitly, but it is possible to design specific decision trees for this. combination suitable approach
As a consequence, the service fault diagnosis should make use of both the CSM and the IA where the IA should become part of the CSM implementation. The reporting workflow should then be carried out with the CSM and should result in a formalized symptom report that should serve as basis for further investigations. An organization that uses third party subservices should demand that CSM interfaces are also provided for these subservices so that in particular appropriate fault management information is provided.
fault diagnosis methods
Service symptom diagnosis The section on fault diagnosis methods focused on a set of techniques that have been applied to fault diagnosis using passively monitored events. In addition, recently developed techniques for active probing have been highlighted. An overview of their assessment is given in Table 3.4. Requirement details Genericity (G1) Scalability (G2) Low effort (G3) Learning capability (S1) Early matching (S2) Multiple root causes (S3) Testing (S4)
MBR + 0 0 + 0
RBR + + 0 0 0 0
codebook + 0 0
CBR + 0 0 + 0
probing + n/a 0 +
Table 3.4: Service problem diagnosis summary
generic except of codebook approach
Except the codebook approach all the presented techniques are in principle able to deal with issues on the service level. Limitations exist for the codebook approach where all information has to be encoded into the correlation matrix which may not be possible for arbitrary relations on the service-level (e.g. concerning SLA conditions and redundancies). However, workarounds to enable the codebook approach to deal with service-related information may be feasible.
scalable proved by real world use
The scalability of RBR and the codebook approach has been proven due to the widespread use of these techniques. The same holds in principle for MBR and CBR even though these methods are not applied by many vendors. Active probing techniques have only been tested in demonstration systems yet.
maintenance challenges
The maintenance issue is closely related to the capability of these techniques to adapt to new situations when the service implementation has been changed. 102
3.6. Summary This issue is a serious challenge for all techniques where CBR has a slight advantage with its learning capability. Maintenance problems have been reported mainly for RBR techniques, but they are also given for MBR models and codebook input graphs. For active probing it is also necessary to adapt the combination of probes according to the implementation changes. The learning capability of CBR is an advantage of this method for the learning criterion, but also RBR has the advantage in comparison with other techniques that the reason for a failed correlation can be more easily identified by checking the rules that have been involved in the correlation.
learning capability
Early matching means to automatically identify the relationship of symptoms which should be possible for MBR, RBR and the codebook approach (depending on the instrumentation of the system). In a pure CBR approach each symptom would be treated separately so that this matching would not be obvious. This criterion is not applicable to active probing where all symptoms are triggered by the method so that no matching of input from different sources is necessary.
automated symptom correlation
A single root cause assumption does not have to be made in MBR and RBR, even though it is frequently used in the latter approach. The codebook approach is designed for a single root assumption and for the cases in CBR it is also typical that a single case describes a more frequent situation with only one root cause. As the term active probing is used here to summarize several methods, this feature depends on the actual implementation.
single root cause assumption
Apart from active probing, the four other methods are acting passively so that no tests are carried out to improve or verify the correlation results as part of the automated diagnosis.
testing
As explained in Section 3.4.6, it is possible to combine the techniques presented above for which a variety of possibilities exists. Difficulties in the application of MBR, which would require a detailed modeling of the service behavior, and the codebook approach, which has some limitations concerning its modeling capability, make it seem promising to combine RBR and CBR. This combination seems useful to link the representation of general knowledge (RBR) and specialized knowledge (CBR). In addition, active probing techniques should be integrated in order to improve and verify the correlation result.
combination of RBR, CBR and active probing promising
Embedding into overall management solution The section on SLA management provided some general background information on SLAs and QoS parameters. For building a consistent approach to service fault management and service management in general, three methods have been presented. Management by Business Objectives and Schmitz’ Impact Analysis are approaches for the phases in service fault management following the service fault diagnosis in this thesis. Garschhammer’s QoS Measurement approach is useful in the context of SLM. An assessment of the approaches is given in Table 3.5.
methods for service management
103
Chapter 3. Related Work Requirement details Genericity (G1) Scalability (G2) Low effort (G3) Impact and recovery management (E1) Service management (E2)
MBO + + 0 + 0
Impact + + + + 0
QoS meas. + + 0 +
Table 3.5: Embedding into overall management solution summary
generic approaches
All three approaches do not have limitations for the services to be managed and they all are also aimed to be applicable for large-scale services. While MBO is based on ITIL, the two other approaches are compliant to the genericity of the MNM Service Model. A low maintenance effort is one of the major goals in the Impact Analysis. It is not explicitly targeted in the MBO and QoS measurement approaches.
collaboration with Impact Analysis
MBO and Impact Analysis are basically addressing the same issue and are in principle suited for collaboration with the approach developed in this thesis. However, the joint work in the past [HSS05b, HSS05c, HSS05a] for the development of the Impact Analysis has always addressed a combined information modeling for both approaches which should allow for an easy coupling.
collaboration with QoS Measurement
The QoS Measurement is suitable as an SLM management solution with the same abstraction level as the one of this thesis. In addition, the method’s monitoring results can be used as input for the diagnosis. Conclusions The major steps that result from the analysis of related work are the following. 1. A workflow has to be developed that details the steps for service fault diagnosis. It is useful to design it as a refinement of eTOM where appropriate and also to include some aspects from ITIL. 2. Information required for service fault management has to be specified making use of CIM, SID, and the Service MIB concepts. For dependency modeling the work from Marcu can be extended. 3. The CSM interactions should be used in combination with IA decision trees. The IA output has to be refined so that it can be used as input for an automated fault diagnosis. 4. An architecture for performing the service fault diagnosis has to be developed. It should combine RBR, CBR and active probing techniques to fulfill the requirements given.
104
Chapter 4 Framework for Service-Oriented Event Correlation
Contents 4.1
Motivation for Service-Oriented Event Correlation . . . 107
4.2
Refinement of the Requirements . . . . . . . . . . . . . 108
4.3
Event Correlation Workflow . . . . . . . . . . . . . . . 110 4.3.1
Service Event Generation from User Reports . . . 110
4.3.2
Service Event Generation from Provider’s Service Monitoring . . . . . . . . . . . . . . . . . . . . . 112
4.3.3
Resource Event Generation . . . . . . . . . . . . . 112
4.3.4
Service Event Correlation . . . . . . . . . . . . . 113
4.3.5
Resource Event Correlation . . . . . . . . . . . . 116
4.3.6
Aggregated Event Correlation . . . . . . . . . . . 117
4.3.7
Root Cause Candidates Verification . . . . . . . . 118
4.3.8
Symptom Report Update . . . . . . . . . . . . . . 119
4.3.9
Correlation Failure Backup Workflow . . . . . . . 120
4.3.10 Workflow Summary . . . . . . . . . . . . . . . . 122 4.3.11 Relationship to ITIL/eTOM . . . . . . . . . . . . 122 4.4
Event Correlation Framework . . . . . . . . . . . . . . 124
4.5
Hybrid Event Correlation Architecture . . . . . . . . . 129
4.6
4.5.1
Motivation and Basic Architecture . . . . . . . . . 130
4.5.2
Development of the Correlation Algorithm . . . . 132
4.5.3
Definition of Service Events and Resource Events . 152
4.5.4
Management of Rule Database . . . . . . . . . . . 153
4.5.5
Management of Case Database . . . . . . . . . . . 154
Information Modeling and Management . . . . . . . . 155 4.6.1
Model for Service Fault Diagnosis . . . . . . . . . 155 Basic Class Model . . . . . . . . . . . . . . . . . 155 Detailed Class Model . . . . . . . . . . . . . . . . 157
105
Chapter 4. Framework for Service-Oriented Event Correlation 4.6.2
Modeling of Events . . . . . . . . . . . . . . . . . 164
4.6.3
Rules . . . . . . . . . . . . . . . . . . . . . . . . 167
4.6.4
Cases . . . . . . . . . . . . . . . . . . . . . . . . 172
4.7
Assessment Metrics for a Given Scenario . . . . . . . . 174
4.8
Collaboration with Impact Analysis . . . . . . . . . . . 175
4.9
Assessment . . . . . . . . . . . . . . . . . . . . . . . . . 176 4.9.1
Workflow Requirements . . . . . . . . . . . . . . 177
4.9.2
Management Information Repositories . . . . . . . 178
4.9.3
Fault Management Interfaces . . . . . . . . . . . . 179
4.9.4
Service Symptom Diagnosis . . . . . . . . . . . . 179
4.9.5
Embedding into Overall Management Solution . . 180
4.10 Summary . . . . . . . . . . . . . . . . . . . . . . . . . . 181
framework design using event correlation
In this chapter, which forms one of the main contributions of this thesis, a framework for service fault diagnosis is developed. The central component of the framework is a hybrid event correlator which performs the fault diagnosis. This kind of correlation is called service-oriented event correlation in contrast to the correlation found on the resource level.
idea and requirements
The idea for the development of this component, i.e. the motivation for applying event correlation techniques to service fault diagnosis is given in Section 4.1. The idea leads subsequently to a refinement of the requirements identified in Section 2.4 into technical requirements which is carried out in Section 4.2.
workflow and framework
For the development of the framework a workflow is defined in Section 4.3 which describes the steps to be taken using UML activity diagrams. The steps are used in the following to identify necessary components for the service fault diagnosis framework which is done in Section 4.4. A special section (Section 4.5) is dedicated to the event correlation component describing its detailed architecture.
information modeling
An object-oriented class model and further artifacts are specified in Section 4.6 to model different kinds of information needed for the correlation. For the application of the framework to a given scenario some metrics are discussed afterwards in Section 4.7 which are helpful to assess the effectiveness of the framework’s application during operation.
fault management framework and assessment
Furthermore, a joint framework for service fault management is presented which is formed by the developed service fault diagnosis together with Schmitz’ service fault impact and recovery framework [Sch07] (see Section 4.8). An assessment of the achievements with respect to the requirements and a short summary conclude this chapter. 106
4.1. Motivation for Service-Oriented Event Correlation
4.1
Motivation for Service-Oriented Event Correlation
As outlined in Section 3.4, event correlation techniques have proven to be useful for fault diagnosis in the area of network and systems management. In this area they correlate events describing symptoms of unexpected network behavior to automatically retrieve more meaningful events with regard to the root cause identification. Their application leads to a reduction of the number of potential root causes so that only a few remaining candidates have to be checked by operation staff.
event correlation for network and systems management
The idea for dealing with user reports concerning service quality degradations is to treat these reports in a manner which is similar to the processing of network and systems management events. In addition, symptoms detected by the provider’s service monitoring should also be included in the event correlation.
user symptom reports as input for event correlation
Targeted benefits The aim is to allow for automation in the service fault diagnosis which is a key contribution to making the diagnosis more efficient and consequently save costs for the fault handling. Besides, the use of event correlation techniques on the service level leads to a correlation of user reports addressing similar faults at an early stage which allows for an aggregated processing of these reports so that some duplication of work for related user reports can be avoided.
early matching of reports for effort reduction
Apart from being more efficient, the automated mapping saves time in the event diagnosis phase and therefore helps to minimize the overall event resolution time. This is very important with respect to SLAs which often contain statements like mean time to repair (MTTR) or mean time between failures (MTBF) guarantees.
timeliness
Extension of correlation techniques The event correlation techniques which are applied to network and systems management do not per se suit to all characteristics of service management. New challenges arise for the definition of service events which denote the formalization of a user report about a service quality degradation. In addition, the techniques often use binary states, i.e. either assuming a fault or no fault in a component at a given point in time. This is not sufficient for service management as quality degradations (in terms of SLA definitions) have to be dealt with. This e.g. relates to transactions which take longer than promised so that one or more of the transaction steps have to be identified as being not compliant to the time constraints. Therefore, a single root cause assumption is not acceptable for a service-oriented environment.
service event = formalized report about service quality degradation
107
Chapter 4. Framework for Service-Oriented Event Correlation
4.2
Refinement of the Requirements
refinement w.r.t. event correlation idea
The requirements (compare Section 2.4) are revisited with respect to the choice of event correlation techniques for the diagnosis. A refinement of some requirements is given which is a consequence of the characteristics of event correlation.
no limitation for services
General requirements The use of event correlation techniques must not have an influence on the kind of services for which a diagnosis can be performed (requirement G1). It should still be applicable to any kind of service according to the definition given earlier.
no limitations from common event correlation assumptions
Some event correlation techniques make assumptions which are not acceptable for the framework. The assumption that there is only one root cause at a given point in time is not favorable for real world scenarios. Modeling limitations such as only binary states which do not allow for modeling quality degradations or the assumption of non-redundant service management are also violating the genericity.
correlation performance
An important criterion with respect to the scalability (criterion G2) is the correlation performance. While it is very critical in network and systems management where hundreds or thousands of events per second have to be processed in an event storm, the number of service events resulting from user reports is usually much lower. However, these very critical events have to be matched to a potentially large number of resource events. Furthermore, tests to improve the correlation result may be requested during the correlation which generate additional events.
technique suitable for frequent changes
The way services are provided today has become very dynamic, i.e. there are frequent changes in the collaboration of services as well as in the configuration of the underlying resources. Therefore, the correlation technique should allow for an easy update of information needed for the correlation when changes in the service implementation are performed (criterion G3).
tool support
Workflow requirements The selection of event correlation techniques is a step towards addressing criterion W2 since tool support for event correlation techniques exists so that it can be assumed that the diagnosis on the service level can build on these tools.
cross-layer interaction
The interaction with the CSM interface in this case means that preprocessed service events have to be delivered as input for the event correlation (compare criterion W3). The collaboration between service level and resource level will require the interaction of event correlation systems. As it has become common practice for service providers to use event correlation systems for managing the network and end systems, it can be assumed that a correlation of resource events is already in place within an organization (otherwise, the implementation of the framework also requires the installation of event cor108
4.2. Refinement of the Requirements relation on the resource level). For the workflow this means that an efficient way of linking the correlation on both levels has to be developed. It is desirable to have meaningful metrics with respect to the event correlation which show whether the service fault diagnosis is performing as needed in operation. In order to allow for timely reaction these metrics should be available on time or with short delay (criterion W4).
monitoring metrics
Management information repositories The management information repositories have to store all information needed for the correlation which comprises the information listed in the requirements section. In addition, they have to support the timeliness of the correlation by offering efficient data structures and retrieval methods.
correlation technique compliant information
Fault management interfaces At the CSM interface reports about service quality degradations have to be transformed into service events which are input to the service fault diagnosis. Therefore, a formalization procedure is needed to translate and enrich reports into the standardized format of the service events.
formalization of symptom reports
Service symptom diagnosis The chosen technique should have a learning capability feature as the complexity of service composition that is found today can lead to an inaccurate correlation knowledge base and therefore a misguided correlation (criterion S1).
learning capability
The early matching of information (criterion S2) here means to early correlate service events. This correlation has to be based on information about dependencies that exist between the services. Service events which result from tests to services can also help to perform the correlation already at this stage.
early matching
The event correlation has to foresee the possibility that there may be multiple root causes for the events within a given time window. This requirement (S3) is in contrast to the assumptions being made in many commercial event correlation tools.
multiple root causes
The testing (criterion S4) of resources and services has to be included into the correlation workflow. Therefore, the results of such tests should be formatted in a similar way as the other information, i.e. these results should also be service events and resources events. There is a trade-off how many of these events should be included into the event correlation process (improved correlation accuracy versus increased correlation time and effort).
testing of services and resources
Embedding into overall management solution The use of event correlation techniques within the service fault diagnosis does not mandate a refinement of the criteria for collaboration with impact analysis and SLA management since it is an internal technique. Nevertheless, it will be shown later that
correlation internal fault diagnosis technique
109
Chapter 4. Framework for Service-Oriented Event Correlation the choice of event correlation allows for a deeper linking with the impact analysis if similar techniques are used for it.
4.3 development of event correlation workflow
Event Correlation Workflow
In this section a workflow is developed to detail the steps which need to be performed in service fault diagnosis. After the presentation of different ways how the events are generated, the event correlation workflow itself is decomposed into three steps which are defined according to the different kinds of dependencies. The workflow contains several feedback loops to improve the correlation result. It results in a candidate list of potential resource faults.
4.3.1 Service Event Generation from User Reports symptom recording workflow
A user would like to report a symptom concerning the service quality which has to be transformed into a service event. As shown in Fig. 4.1, in which the whole workflow for the service event generation is depicted, the symptom is reported to the CSM. Information needed for the service event has to be gained in a step-by-step workflow because it cannot be assumed that a user provides all required information on her own. Due to the need to ensure the information accuracy, symptom reproduction routines are included in the information gathering workflow. The symptom reception might end in identifying an incorrect service usage by the user so that no further steps need to be taken by the provider. However, this information is also recorded to e.g. update the service’s FAQ pages or to improve the service usage functionality.
match to known faults or maintenance
Another possibility is that the symptom is already known and its treatment is under way or that the user is not aware of a scheduled maintenance affecting the services. The knowledge about affected services can be the result of an impact analysis which has been performed for currently unavailable resources and unavailable services (especially when subscribed from subproviders). However, the provider should be careful not to mismatch service quality degradations to known problems which could lead to the disregard of newly occurred resource/service problems. Therefore, a reasonable policy is to include symptoms in the further correlation workflow if doubts exist.
plausibility checks
If there is no match to known information, some final plausibility checks are performed (e.g. using the accuracy of prior reports from the user to add a credibility to the report) so that some more information for ensuring its accuracy is added to the symptom report which is now called service event. Furthermore, the user may be required at this or at a former stage to authenticate (not shown in the workflow figure). The service event is sent to service management afterwards.
110
4.3. Event Correlation Workflow customer service management
user
service management
notices service quality degradation
collect symptom information
wants to report symptom to CSM
answer question or perform symptom reproduction test
[more details needed]
[information sufficient]
check own responsibility
[cause in user domain]
report to user
[provider internal cause] check known problems and maintenance
[symptom caused by known problem or maintenance] report to user
[symptom cause unknown] generate service event send service event to service management
Figure 4.1: Service event generation from user reports
In addition to the service symptom reporting functionality, the user can also inform the provider that a symptom can no longer be witnessed or that a change in the witnessed symptom occurred. As the update of events has to consider the progress that has been made in the processing of the original event, the workflow for this situation is given separately after the workflow for the event correlation (compare Section 4.3.8).
change of symptom reports in separate workflow
In eTOM the service event generation from user reports would be part of the CRM and here in particular of the Customer Interface Management and the subprocess Isolate Problem and Initiate Resolution of the Problem Handling process. In ITIL it would be part of Incident Management. The workflow integrates ITIL’s recommendation to match incidents to known problems or
eTOM CRM and ITIL Incident Management mapping
111
Chapter 4. Framework for Service-Oriented Event Correlation maintenance information.
4.3.2 Service Event Generation from Provider’s Ser-
vice Monitoring three kinds of service monitoring
The provider tries to avoid the reporting of service quality degradations by users as these already imply a user inconvenience having occurred. As explained in Section 2.3, three kinds of monitoring can be distinguished. On the provider side the service is monitored using the internal knowledge about the service configuration. This kind of monitoring can partially still be regarded as resource monitoring since - in addition to the access to subservices - the resources of the service are accessed directly. Even though a well-configured internal service monitoring can detect a large part of the potential symptoms, this kind of monitoring should not be regarded as sufficient. Due to the complexity of the collaboration of resources and services in the service implementation, it is likely that some symptoms can only be detected assuming an external perspective. Virtual users can be installed which perform typical user interactions at the SAP. However, this monitoring cannot track all potential symptoms either since real users may use another way of service access. Therefore, the client code could be instrumented to collect information needed for service monitoring and fault diagnosis.
integration as service events
The idea for dealing with symptoms recognized by the service monitoring is to integrate them in a similar manner into the correlation workflow. This is performed by generating service events out of these service monitoring-based symptoms.
monitoring schedule
The monitoring itself is done on a regular basis and on demand. The regular monitoring is defined according to the offered functionalities, their QoS parameters, as well as the customers and their SLAs. In addition to monitoring the quality of the own services, it is also useful to check the reliability of thirdparty providers. The on demand monitoring (i.e. specific tests) is needed for improving the correlation result and is part of the correlation workflows (see below).
eTOM Monitor Service Quality and ITIL Problem Management mapping
In eTOM this workflow for the regular monitoring of services is placed in perspective of service management, more precisely the subprocess Monitor Service Quality in Service Quality Management. If service events from suppliers are involved, it also tackles the S/P Problem Reporting and Management and the S/P Service Performance Management. In ITIL it is part of (Proactive) Problem Management.
4.3.3 Resource Event Generation ways for defining resource events
The vendors of devices usually define a set of events which originate from the equipment (e.g. via SNMP traps) in case of symptoms. Another common way of event definition is their specification for the needs of network 112
4.3. Event Correlation Workflow management tools. Complementary to these given events additional kinds of resource events may have to be defined and generated with respect to SLAs. For example, high utilization of a link or high CPU loads are not regarded as faults in terms of resource fault management. These issues are treated within resource performance management. However, these circumstances may e.g. lead to delays in the service usage which could endanger the agreed service quality. As a consequence, service fault management which also deals with service performance degradations (as defined in the definition of terms in Section 2.1) has to collaborate both with resource fault management and resource performance management. For doing so, additional resource events have to be defined to indicate resource performance issues (e.g. CPU utilization threshold exceeded, link utilization threshold no longer exceeded). Supplementary to waiting passively for events active testing procedures are in place to check the proper operation of the resource infrastructure. Similar to the service level these active tests should happen on a regular basis (e.g. depending on the importance of resources, their redundancy, likelihood of failure) and on demand. The on demand tests are helpful for improving the correlation result. They are part of the correlation workflows.
events from active tests
This workflow is part of resource management in eTOM, specifically of Survey and Analyze Resource Trouble in Resource Trouble Management and of Monitor Resource Performance in Resource Performance Management. In ITIL it is part of (Proactive) Problem Management.
eTOM Survey and Analyze Resource Trouble mapping
4.3.4 Service Event Correlation As described within the generic scenario (see Section 2.3), three kinds of dependencies (inter-service, service-resource, inter-resource) are distinguished. The idea of the correlation workflow is to differentiate between these kinds of dependencies in defining a correlation step for each of them which is done in this and the following two sections.
three correlation steps for three kinds of dependencies
The motivation for the separation is to reduce the number of potentially related events within the steps. The service events and resource events that are present at the start of the correlation are usually not directly related so that it is not reasonable to put them together right from the beginning. Therefore, service events are correlated to other service events so that correlated service events are received which now need to have a mapping to the resource level. Similarly, resource events are correlated to other resource events in the first place. Depending on a given scenario it may be reasonable to split up the correlation even further, e.g. by dividing the events according to the network region. The separation also has the advantage that service and resource management are still clearly separated as proposed by eTOM.
motivation for separation
In the correlation of service events an early matching of related events is targeted. The aim is to identify one or more services out of the set of offered services which are likely to suffer from a fault within a common resource.
early matching
113
Chapter 4. Framework for Service-Oriented Event Correlation servA
servB
servC
services dependencies
servD
servF
servE
subservices
Figure 4.2: Example of service dependencies (lightning denotes symptom reports) service event correlation example
The following example helps to understand what is achieved in this step. The assumption of the example is that all actions happen within a given correlation time window. A provider offers services servA, servB, servC to customers and uses subservices servD, servE, servF for their internal realization. Their dependencies are given in Fig. 4.2 in a simplified way (the modeling of dependencies in subject to Section 4.6). If there are service events for servA and servB, but not for servC, it can be concluded that a fault in the resources of servD would explain the symptoms for servA and servB. This seems to be more likely than to assume independent faults in the resources of servA and in the resources of servB. As there is no service event for servC, it is less likely to assume faults within servE and servF as faults within these services would also lead to faults in servC, but no events have been reported for this service. In general, it can be witnessed that additional tests are helpful to clarify the situation. Test interactions could be performed at servD to monitor whether this service is working as expected.
event input and correlation loop
Fig. 4.3 depicts the service event correlation workflow. The starting point is a service event which has been generated via the CSM or the service monitoring. The latter denotes symptoms detected by the provider-internal service monitoring or the virtual users which perform tests of the service. An event store within the service event correlator is accessed to retrieve events which may be related to the current event and the correlation is performed. After that, correlated events for services whose resources may contain the originating root cause(s) are generated and service events being interesting for further correlation are stored back into the event store. In case the correlation result is not satisfactory, a feedback loop is contained to generate additional events. These events result from tests of the services being offered.
possibilities for the treatment of service events
The event correlation can foresee a different treatment of events depending on their source which is based on trade-offs for the provider. Events which originate from user reports have to be addressed in any case to ensure the fulfillment of SLAs. For service events originated from service monitoring and service testing it is not necessary per se to identify the root cause of the symptom since these may not necessarily affect users (see also Section 4.3.9). Due to the configuration of service monitoring and service testing to ensure the fulfillment of SLAs, the symptoms are usually also tracked down to originating faults. The criteria for this are the expected impact of the potential root causes of the symptom as well as effort considerations for the root cause analysis. The latter criterion should be used to determine the priority of the 114
4.3. Event Correlation Workflow customer service management
send service event to service management
service management
supplier/partner management
generate service event from service monitoring
retrieve potentially related service events
send resulting service events
correlate service events
[correlation finished]
perform additional service tests
[additional tests required]
send subprovider service events
send correlated service events to aggregated correlation
decide on reporting to supplier
Figure 4.3: Service event correlation using inter-service dependencies
analysis. If a correlated service event shows that a service subscribed from a subprovider does not work properly, this should be reported to the subprovider via its CSM. Since SLAs with the subprovider may contain statements like a maximum number of symptom reports for which a guaranteed response time is valid, the provider should take care not to report symptoms which are finally identified as being caused by the provider herself. At this stage of the correlation therefore the trade-off between root cause analysis speed and effort will usually favor to wait for the result of the aggregated correlation.
service event forwarding at subservice SAP
In eTOM service event correlation would be regarded as a detailing of the Diagnose Problem subprocess in Service Problem Management when neglecting the service quality aspect (see discussion at the end of the section). In ITIL it would be considered as part of Problem Management’s Problem Control.
eTOM Diagnose Problem process mapping
115
Chapter 4. Framework for Service-Oriented Event Correlation
4.3.5 Resource Event Correlation resource event correlation workflow
The starting point for resource event correlation is a resource event originated from the active or passive monitoring of resources. Here, passive monitoring means to react to events being issued by the managed resources, while active tests perform actions to check features of the resources. Similar to the service event correlation, a feedback loop is in place to generate additional resource events for the correlation which are the results of active resource tests. The result of the correlation on the resource level is a set of correlated resource events which are transferred to the resource event correlator. The correlation workflow on the resource level is depicted in Fig. 4.4. resource management
service management
passive resource event detection
active resource event detection
retrieve potentially related resource events send resulting resource events correlate resource events
[correlation finished]
perform additional resource tests
[additional resource tests required]
send correlated resource events to aggregated correlation
Figure 4.4: Resource event correlation using inter-resource dependencies resource event correlation not sufficient
It is important to understand why the resource event correlation cannot be regarded as sufficient for the diagnosis, because one could assume that all broken resources have already been identified by this kind of correlation so that additional considerations on the service level are not required. For example, a correlation based on the network topology might already show that a switch is broken. Therefore, one could argue that this result can be forwarded to the resource fault management so that the device is replaced. However, this 116
4.3. Event Correlation Workflow is not sufficient as the provider may already have received service events complaining about symptoms caused by the broken switch. As a consequence, a relationship has to be built to the service events which cannot be provided by the resource event correlation. Another important aspect which is not covered by the resource event correlation are faults in subscribed subservices. As no resources of the provider are root causes of the symptoms in this situation, resource event correlation will fail to diagnose the root cause. Even more important, there are resource events which are indications of critical situations with respect to the service offers. However, this conclusion can only be drawn when broadening the local view that is typical of resource events. For instance, thresholds may be defined for the lengths of waiting queues within routers. From a resource-oriented perspective exceeding some of the thresholds might not be regarded as critical as long as there are no packet drops. Nevertheless, a service event concerning a transaction using multiple of the routers might show that the delay for the transaction is exceeding an agreed upper limit. This service event assumes a global view that is not given when regarding the routers one by one. Therefore, the consequence of the service event might be to change the routing of some minor important traffic or to prioritize the transactions.
global view given only by service events
In eTOM resource event correlation is a recommended method for the Survey and Analyze Resource Trouble subprocess in Resource Trouble Management. It is however not mentioned for the Resource Performance Management processes. In ITIL it would be considered as part of Problem Management’s Problem Control.
eTOM Survey and Analyze Resource Trouble mapping
4.3.6 Aggregated Event Correlation The result of previous event correlation steps are correlated service events and correlated resource events which are transferred to the aggregated event correlation (see Fig. 4.5). The service-resource dependencies are now used to correlate them with each other to identify a candidate list of resources which are suspected to be not working as required. In addition, services from subproviders may be identified as not working properly.
aggregate event correlation workflow
Similar to the service event correlation and the resource event correlation, a feedback loop is contained to request tests which result in additional resource events for improving the correlation result. Obviously, it is not possible to generate resource events for services being subscribed from a third-party provider.
feedback loop
An example of the use of the feedback loop is the following. A correlated service event may indicate that it is likely that there is a fault within the resources of a service, but no matching resource event is found. Then, additional resource tests can be triggered to verify the proper operation of the resources for this service. Due to the top-down traversal of dependencies for diagnosis, it is not useful to trigger tests for additional service events here because this should be done as part of service event correlation before.
feedback loop example
117
Chapter 4. Framework for Service-Oriented Event Correlation service management
send correlated service event to aggregated correlation
resource management
send correlated resource event to aggregated correlation
retrieve potentially related events send resulting resource events correlate service events and resource events
[correlation finished]
perform additional resource tests
[additional resource tests required]
build root cause candidate list
Figure 4.5: Aggregated event correlation using service-resource dependencies information for impact analysis
At this stage it can be witnessed that the event correlation can also provide information for impact analysis if desired. If there are resource faults or resource quality degradations, it is interesting to know whether the service level is already affected by this. This can be done by correlation to already reported service events or by generating additional service events using active tests. However, a complete impact analysis has to include information about the SLA conditions. The mapping to ITIL and eTOM of the aggregated event correlation is the same as for service event correlation. However, this workflow is at the border between service and resource management.
4.3.7 Root Cause Candidates Verification candidate list refinement
The aggregated event correlation results in a candidate list of resources which have to be checked using additional more elaborate testing methods. Some of these methods may require more effort and/or take more time so that it is not 118
4.3. Event Correlation Workflow useful to directly integrate them into the correlation workflow. These methods can be automated or semi-automated. Furthermore, additional information can be used at this stage to receive a ranking of the resource candidates. For example, the experience of the past concerning failure rates of resources can be used (e.g. that software version inconsistencies are more likely than hardware failures). Finally, one or more root causes are identified by the resource fault management staff and have to be repaired or replaced. Depending on the benefit of the improved availability versus the additional effort, it can be reasonable to install a temporary workaround for some faults. The decision how to take care of the problems is out of scope of this thesis. It is addressed by service impact and recovery analysis.
transfer to other fault management workflows
This workflow is still part of the diagnosis workflow and is primarily part of resource management in terms of eTOM. However, it also needs to be tracked from the service management perspective. In ITIL this process refers to the Problem Management’s Problem Control process.
eTOM Survey and Analyze Resource Trouble mapping
4.3.8 Symptom Report Update A user may want to report an update of the symptoms to the CSM interface. Here, it needs to be differentiated between new symptoms and the change or refinement of information reported earlier. The report of a new symptom which does not intend to correct a previously given report can be treated like the input of a new service event in Section 4.3.1. For example, a user may report that the service is now working properly again which can then be correlated to the previous service event about the symptoms occurred. A correction of a previously reported event is also not necessary if the symptom still exists. In this situation it is sufficient to report the current condition.
new symptoms treated as completely new input
A more complicated situation is encountered if an already reported observation should be updated. This means that the service event, which may already have been processed, needs to be changed. This situation can arise for instance if a user has unintentionally provided wrong information and notices it afterwards. In the workflow (see Fig. 4.6) for dealing with this situation it has to be differentiated between the different processing stages.
correction of service events
The first step is to check whether the service event has already been correlated. If the service event has not been correlated yet, it can simply be updated and put back into the event correlation workflow. Otherwise, it can be tried to roll back the correlation of the service event. This means that all events that have been correlated to this event are put back into the correlation workflow as uncorrelated events. Such a roll back may be difficult if some time has already passed so that the renewed events are not valid anymore because they are not part of the event correlation window. A roll back may be impossible either if the resource candidate list has been transferred to the resource fault management.
correction workflow
119
Chapter 4. Framework for Service-Oriented Event Correlation user
customer service management
service management
resource management
reports updated information for a previous symptom receives report and forwards it
check processing of service event [service event still uncorrelated] update service event
[service event already correlated]
check potential correlation rollback
[rollback possible] [correlation already continued]
regain original events and update service event
inform resource management
manual recovery of situation
Figure 4.6: Workflow for correcting service events similar process mapping than initial report
In eTOM this workflow is part of the Customer Interface Management process and the subprocess Isolate Problem and Initiate Resolution of the Problem Handling process. In ITIL it would be part of Incident Management.
4.3.9 Correlation Failure Backup Workflow motivation for backup workflow
A situation that has not been explicitly regarded in the workflows yet is that a service or resource event may not be correlated and therefore remains in the event store which means that no root cause is identified. This can happen in all of the three event correlation steps. To deal with this situation escalation times have to be defined for the events until a manual analysis of the events has to be triggered. For service events from users these escalation times should usually be quite short so that no time is wasted until the manual correlation starts. For these kinds of events this situation should normally not happen, while it can be tolerated that some more resource events are generated than needed. The escalation times do not have to be mixed up with event correlation windows which specify time intervals being used as basis for the correlation. The 120
4.3. Event Correlation Workflow service management
check detects expiry of service event validity
resource management
check detects expiry of resource event validity [event root cause not relevant]
[event root cause not relevant]
[event root cause has to be found]
drop event
try to retrieve information about similar situations
[event root cause has to be found]
drop event
try to retrieve information about similar situations
send to resource management
manually find root cause candidates
Figure 4.7: Workflow for dealing with uncorrelated events
provider has to take care of these additionally. The workflow for the backup solution is depicted in Fig. 4.7. Events that have not been correlated in the service event correlation, resource event correlation, or aggregated event correlation are reported to service fault management and resource fault management. Here, criteria with respect to estimating the importance of the event are used to decide that a solution should be found in a semi-automated or manual fashion. These criteria are centered on the potential impact that the event might have so that static event class conditions or methods from the impact analysis can be applied at this point. If root cause candidates should be identified for this situation, previously recorded knowledge about similar situations should be applied if available. Finally, root cause candidates for the uncorrelated event are reported to resource fault management.
steps of backup workflow
In eTOM this workflow would be part of the Diagnose Problem subprocess in Service Problem Management for service events and for the Survey and Analyze Resource Trouble subprocess in Resource Trouble Management for resource events. In ITIL it would be considered as part of Problem Management’s Problem Control.
matching to different layers in eTOM
121
Chapter 4. Framework for Service-Oriented Event Correlation
4.3.10 Workflow Summary workflow figure
In Figure 4.8 a summary of the event correlation workflow is given (an improvement of the proposal in [HSS04]). It shows the main event correlation workflow making use of the partial workflows which have been elaborated so far. Gray boxes indicate workflow steps which have additionally been introduced for the service-orientation in contrast to the event correlation on the resource level.
summary of main steps
On top the sources of events are depicted. For the service events there is a differentiation between the passive reception of events at the CSM interface and the active monitoring of services. For the correlation on the resource level events result from active and passive monitoring of resources. The events are correlated separately in the first place in the service event correlation and the resource event correlation. The correlated events are forwarded to the aggregated event correlation. As shown in the figures for the three correlators, feedback loops are available which trigger additional tests of services or resources. The aggregated event correlation results in a candidate list of resources and subservices where the latter ones have been subscribed from other providers (otherwise, it would have been possible to identify the resources of the subservice). In case of uncorrelated events the backup workflow is used to find root cause candidates (resources and/or subservices). The resources contained in the candidate list are then checked via the resource management, while service events concerning the subservices are reported to subproviders via the corresponding CSM interfaces. In the following an impact analysis of assumed or verified faults can be conducted (see discussion in Section 4.8).
4.3.11 Relationship to ITIL/eTOM The workflow which is defined for the service fault diagnosis can be regarded as a refinement of ITIL and eTOM processes [Han07] (compare Section 3.1). comparison to ITIL
In ITIL it covers both the Incident Management and Problem Management processes. The service event generation from a user report would belong to Incident Management so that a service event is similar to an incident in the first place. However, the symptom reproduction, plausibility checks, and comparison with known errors/maintenance steps try to improve the quality of service events so that they get more meaningful than simple incidents. The later workflow steps can be regarded as a refinement of Problem Management by defining more detailed steps of what has to be carried out.
eTOM process mapping
In eTOM the defined workflow is a refinement of the Assurance process. It starts from the Problem Handling process via Service Problem Management down to Resource Trouble Management. While event correlation techniques are briefly mentioned as a technique which can be applied for Resource Trouble Management, it is a new concept to use these techniques also for Service Problem Management. In particular, the Diagnose Problem subprocess is de122
4.3. Event Correlation Workflow
customer service management
service management
resource management
supplier/partner management
FIGURE 4.1, 4.6 symptom reporting at CSM
service event
resource passive monitoring
resource active monitoring
service active monitoring
FIGURE 4.3
resource event
service event correlation
fault detection
FIGURE 4.4
fault diagnosis
resource event correlation
[uncorrelated or partially correlated events] [successful correlation]
FIGURE 4.5
[successful correlation] [uncorrelated or partially correlated events]
aggregate event correlation [uncorrelated or partially correlated events] [successful correlation]
backup candidate identification
FIGURE 4.7
candidate list candidate examination
report subservice symptom to subprovider CSM get information about subservices
root causes
fault diagnosis impact and recovery management
fault recovery
workflow steps for resource event correlation additional event correlation steps for service−orientation
Figure 4.8: Event correlation workflow
123
Chapter 4. Framework for Service-Oriented Event Correlation tailed for this purpose. fault management versus performance management on the service level
In eTOM a differentiation is made between fault management and performance management which is used for the different layers. While this differentiation has proven to be useful for network and systems management, the difference between these functional areas is fuzzy on the service management level. It is not clearly defined in eTOM what a service fault is in contrast to a service performance issue and as the discussions in earlier parts of the thesis show there is no real difference. Performance management on the service level has to collaborate with performance management on the resource level, but also with fault management on the resource level as a fault can also affect the service quality without resulting in a complete unavailability of the service. As it will be shown later, the methods for fault and performance management with respect to the diagnosis are applicable to both functional areas. Instead, it is preferable to clearly make a distinction between monitoring and analysis workflows (splitting up the joined Survey and Analyze Resource Trouble process and clearly locating the service monitoring).
4.4
Event Correlation Framework
section outline
In this section a framework is developed for supporting the workflows developed in the previous section. The starting point is a simplified framework whose components are detailed in the following subsections. A special section (Section 4.5) is dedicated to the event correlation component on the service level.
event correlation components
The simplified event correlation framework is depicted in Fig. 4.9. On the service management level an event correlation component is in place to perform the service event correlation and the aggregated event correlation. Even though these steps have been logically separated in the workflow, it will be shown that these are very similar in nature and can therefore be executed by the same component. The resource event correlation is performed by a component being part of resource management (resource event correlator).
input components
Input for the service event correlation is received from the Customer Service Management which denotes a component designed according to Langer and Nerb’s CSM (compare Section 3.3.1) and from the QoS probing and measurement. The latter component performs tests of the service quality on a regular basis and on demand according to the work of Garschhammer (compare Section 3.5.2). For the communication with subproviders other CSM interfaces are used, in particular to check whether a fault is located within a subservice.
information repositories
At the service management level two kinds of repositories are used, namely the Service MIB (compare Section 3.2.1) and repositories for storing correlation-related information. The correlation information generator is used to transform information contained in the Service MIB so that it can be ap124
4.4. Event Correlation Framework Customer Service Management service event
Service MIB QoS probing and measurement
service management
service event service event correlator
subservice symptom report
subservice CSM client
correlation information generator
correlation database
service event candidate list
resource event event correlation flow
resource management
resource event correlator
information flow additional event correlation component
Figure 4.9: Framework for service-oriented event correlation (simplified version)
plied for the correlation and stores it to the correlation database.
Customer Service Management In the workflow (compare Section 4.3.1) service symptom reports from users are transformed into service events. As shown in the examination of related work, the CSM approach can be detailed towards this purpose. It is depicted in Figure 4.10 showing its interactions with other components. Since the CSM is a broader concept for the exchange of service management related information, the further examination focuses on interactions related to service fault diagnosis, in particular the entry, change, and withdrawal functionality of user reports.
CSM for user interaction
While CSM states that such a functionality has to be provided, no consideration is made about the possibilities of its automation. Therefore, the idea is to integrate the IA concept (compare Section 3.3.2) into these interactions as it allows for a formalized entry of the symptom information which requires no involvement from the provider. Implementation options for the IA can be web-based front ends or speech dialogue systems. The latter may especially be useful as an out-of-band communication mechanism in case of data network connectivity problems between user and provider.
integration of Intelligent Assistant
The provider has to define a format for the service events containing information such as the service, time of symptom occurrence, SAP, etc (compare Section 4.5.3) and design a decision tree for the IA. The decision tree has to be traversed so that all the required information is requested. It should include
design of IA decision tree
125
Chapter 4. Framework for Service-Oriented Event Correlation user exchange of management information
Customer Service Management
enter/change/withdraw service symptom report
Intelligent Assistant
test service/ subservice
QoS probing and measurement
generate service event test resource
service event correlator
resource management
Figure 4.10: Customer Service Management component
situations where the user has made a mistake in the service usage. The traversal of the decision tree has to comprise tests of the service itself, subservices and resources in order to try to reproduce the symptoms. These tests may result in additional events apart from the service event if subservice or resource symptoms are detected. The detection of such a symptom does not allow to discard the original service event since it is needed for further information to the user concerning the symptom treatment as well as for statistical purposes. link with known errors/ maintenance
The traversal of the decision tree has to be tied to the known errors/ maintenance information. Each step may be linked to resources or (sub)services so that it can be indicated to users when a symptom for these resources or (sub)services is already known.
input quality assurance
The automated processing of the input makes it necessary to have reliable input information. Therefore, the credibility of the user report has to be ensured, especially if an automated reproduction of the symptom is not possible or has failed. The user should be required to provide credentials to verify her identity. A credibility score could be calculated from former reports of the user also considering other factors like SLA penalties.
update of reports
The user may access already reported symptoms which have been transformed to service events and may withdraw or change the symptom report which should also be possible when using the CSM. It may also include the IA if a special decision tree is designed for correcting and adding information. The considerations for the workflow can be found in Section 4.3.8.
motivation
QoS probing and measurement The provider needs to have the possibility to monitor the quality of service which is actually delivered to users (com126
4.4. Event Correlation Framework pare Section 4.3.5 why a pure monitoring of resources is not sufficient). As explained in Section 4.3.2 an external perspective is needed to monitor the services in addition to the provider-internal service monitoring. As shown in the examination of related work (compare Section 3.5.2), the QoS measurement procedure proposed by Garschhammer [Gar04] can be applied for this purpose. This procedure is based on measuring the QoS via tracking the interactions at the SAP. For the service monitoring the idea is to simulate typical user interactions to test the offered service functionalities. In case of a detected service malfunction a service event is generated which is input to the service event correlator similar to the service events generated from customer reports.
use of QoS measurement methodology
This kind of testing methodology should also be applied by the provider to test own subservices as well as subservices from subproviders. It is also helpful for the early detection of symptoms prior to customers.
use also for subservices
The QoS probing and measurement is not only used for the service monitoring on a regular basis. It is also applied for the feedback loop that has been defined for the service event correlation.
on demand test for feedback loops
Resource management As the service implementation is based on resources, a resource management component is needed. Its tasks include the event generation and correlation workflow steps on the resource level as well as for the examination of the resource candidate list. As presented in the related work chapter (compare Section 3.4) a lot of research has already been carried out in this area resulting in suitable commercial and open source products.
motivation
Resource management has to contain an event correlation component to correlate resource events. The correlation algorithm in Section 4.5 includes a proposal how to perform the correlation on the resource level, but it is also possible to use another approach here. Most likely rule-based reasoning is applied since this approach has been adopted by most vendors.
event correlation component on resource level
It is important to note that additional resource events have to be defined to serve the correlation on the service level. In Section 3.4 the SMONA architecture is referenced which can be applied for this to enrich events. Apart from the abstraction of vendor specific information, it can be applied to generate events for the needs of service monitoring and foresees a component for instrumenting the monitoring accordingly.
SMONA use to enrich events
In addition, it is necessary to have means to actively test resources and to generate additional events from the resource monitoring. This constraint arises from the feedback loop in the resource event correlation and the aggregated event correlation.
resource testing
Resource management needs to have knowledge about the network topology and the configuration of systems which is needed for the correlation on this level.
information required
127
Chapter 4. Framework for Service-Oriented Event Correlation service event correlator
Service management Several components belong to the service management. The most important of them in the context of service fault diagnosis is the service event correlator which is used to correlate service events with each other and with aggregated resource events. Therefore, it carries out the service correlation and aggregated correlation steps defined in the workflow. Details on the design of this component are given in Section 4.5.
Service MIB
For supporting the service management a Service MIB according to the design of Sailer is needed which stores information necessary for service management (compare Section 3.2). It contains in particular the inter-service dependencies and service-resource dependencies. The QoS parameters for the services are also contained in the MIB which is important for the QoS probing and measurement. Service management also needs interfaces to communicate with subproviders using the provided CSMs. The workflow in service management, i.e. the tracking of the event processing should be supported by a TTS. This system should also be applied to support the manual diagnosis and should keep statistics to monitor the performance of the service fault diagnosis.
figure of complete framework
Framework summary As a summary a complete figure of all framework components is given in Fig. 4.11 which is explained in the following in comparison to the simple framework depicted at the beginning of this section. It already contains details of the event correlation design which are motivated and presented in the next section.
framework layers
The framework is divided into the three layers CSM, service management, and resource management, and additionally contains a CSM interface to suppliers which reflects the eTOM structuring of management layers.
CSM layer
The CSM uses the IA decision trees for formalization of the user input and performs tests of services and resources during the traversal of the tree by using the corresponding management units.
service management layer
On the service level the QoS probing and measurement is responsible for the regular and on demand testing of services. Some details of the service event correlator are shown in the figure, i.e. its rule-based reasoning and casebased reasoning modules. Accordingly, the correlation knowledge is split up between a rule database and a case database. The generation of correlation knowledge out the Service MIB which contains service configuration information is explained in the following section. For the administration of the correlation workflow a TTS is in place which is mainly collaborating with the event working set and the CBR module.
resource management layer
On the resource level a management system is required which contains a correlation component together with a correlation knowledge base. This knowledge base makes use of network topology and system configuration information. 128
4.5. Hybrid Event Correlation Architecture Intelligent Assistant Customer Service Management
probe resource
service event
probe service
probe service
service event related events
rule−based reasoner
event working set
store event
service management service event correlator no rule match
find cause
subservice symptom report
probe resource
trouble ticket system
QoS probing and measurement
case−based reasoner
Service MIB
rule generator
service event subservice CSM client candidate list
resource event
resource management resource probing and monitoring
resource event
resource event correlator
rule database
case database
correlation knowledge base
event correlation flow correlation knowledge base
network topology systems configuration
information flow additional event correlation component
Figure 4.11: Framework for service-oriented event correlation (refined version of [HS05])
4.5
Hybrid Event Correlation Architecture
In this section the design of the event correlator which is part of service management is explained in detail (compare Fig. 4.12). As a result of the examination of the event correlation techniques in Section 3.4, a hybrid correlation architecture has been chosen. Its motivation and basic architecture which also explain the interaction of correlation components are given in the beginning. This verbal description of the workflow is then transformed into a pseudocode algorithm for the correlation. Due to the complexity, this algorithm is developed in several steps by removing more and more of initially made assumptions. Finally, it is explained how service and resource events are specified and how rules and cases are generated and managed. The information model129
section outline
Chapter 4. Framework for Service-Oriented Event Correlation ing for events, rules and cases is given in Section 4.6. design motivation correlation components
basic workflow
stepwise algorithm development
correlation algorithm
event definition
Service MIB
rule−base management
service events, resource events
case−base management
rules
cases
Figure 4.12: Detailed development of the correlation architecture
4.5.1 Motivation and Basic Architecture single technique not sufficient
The examination of event correlation techniques has shown that each of them has some drawbacks for its application to service-oriented event correlation. Therefore, the idea is to combine rule-based reasoning and case-based reasoning techniques so that the benefits of both approaches are linked together to avoid the limitations. The hybrid architecture is depicted in Fig. 4.13. service event event correlator rule−based reasoner
root cause candidate list
related events store event
event working set
resource event
no rule match
case−based reasoner
similar prior cases
Figure 4.13: Hybrid event correlation architecture rule-based reasoning
Apart from the existence of efficient correlation algorithms, the expressiveness of knowledge representation in the rules has led to the choice of an RBR 130
4.5. Hybrid Event Correlation Architecture module. This module receives the service events at first and tries to automatically correlate them in order to derive a resource candidate list. The addressing of the limitations of the approach, namely the rule set maintenance issues and the missing learning capability, is done using the Service MIB and the CBR module, respectively. The provider needs to have a configuration management solution on the service level in any case so that configuration changes can be performed in a safe manner. As the examination of related work (Section 3.2) has shown, the Service MIB is a suitable approach for modeling and managing the required information so that the framework design contains a Service MIB component. For the service fault diagnosis the idea is to extract and transform the information that is already contained in the Service MIB to have a basis for the correlation. For the rule base it means to transform the dependencies contained in the Service MIB into rules in an automated manner which is explained in Section 4.5.4. The automated derivation of the rules ensures that unintended rule interactions become less likely opposed to encoding the rules by hand.
rule derivation from Service MIB
The approach uses the MBR idea to model each service together with its functionalities by using the rules. It cannot be classified as model-based in a narrower sense since there are no interacting software objects to represent the services.
relationship to model-based reasoning
Due to the complexity of service management, there are situations where the Service MIB and therefore the derived rules do not correctly reflect the current situation. As a consequence, the rule-based reasoner is not able to correlate the events so that events remain uncorrelated or are wrongly correlated. For dealing with these situations a CBR module is applied to assist the operation staff in finding the root cause. The idea is to build a case database of previous situations which also had to be solved by hand. A match of the description of the current situation to a previous one should be identified in order to apply a similar solution which reflects the learning capability of CBR. More details about the CBR cases are given in Section 4.5.5.
case-based reasoning component
The event working set is a temporary store for events that have not finally been correlated by the rule-based reasoner. It is accessed in the workflows for service correlation and aggregated correlation to retrieve related events. An event is contained in the working set until it is either correlated or the time window for a successful correlation has been exceeded. In the latter situation the event is forwarded to the case-based reasoner or dropped according to its importance.
event working set
Setting the validity time for an event for its consideration in the rule-based component is a crucial issue for the event correlation. On the resource level usually common correlation windows are used for all events so that an event which is older than a certain threshold is removed. However, this simple method is not recommended for the service event correlation because the service events usually have a different time resolution than the resource events. For example, an event about a malfunction of a service access should have a longer validity than the reporting of a temporarily high CPU load on a net-
time for automated correlation
131
Chapter 4. Framework for Service-Oriented Event Correlation work device. For events which are generated on a regular basis the validity time can be selected in a way that valid events are always available. event reporting vs. event occurrence
Another issue, that is not considered on the resource level, is the gap between the time when the event is reported and the time the event refers to. This time is usually significant since a user has to decide to report the symptom to the provider, contact the provider and give all information required. This means that a 15 minute delay is not unusual. In contrast, a resource event can be transferred to a resource event correlation with a delay in the order of seconds or even less. It is recommended to use the time the event refers to as basis for the correlation so that the correct order of events can be constructed.
comparison to hybrid architecture for situation management
The proposed architecture is different from the one for highly dynamical situations (see Section 3.4.6) since the case-based reasoner used here can be seen as a backup for situations where an incorrect modeling causes the rule-based reasoner to fail. In the architecture for highly dynamical situations both reasoners run in parallel and the case-based reasoner permanently tries to match the current situations onto situations seen before.
different scope of CBR
The adoption of this approach would lead to a different understanding of the CBR component which is designed in this thesis to treat a single service event as a case. The CBR module in the approach for highly dynamical situations specifies a case as the overall situation. Applied to the service management domain this means that such a case contains all states of services and resources at a given point in time.
comparison with service-oriented RBR approach
The approach in this thesis addresses some of the issues left open in [MLKB02]. This approach does not address the maintenance of the rule set which is a critical issue for the success of a real world system. There is also no consideration how to handle a situation if rules are not accurate. Other issues are the disregard of user reports, missing recommendations towards modeling of dependencies, and a lack of separation between diagnosis and recovery. The latter refers to the example rules that are given which directly execute recovery measures. In order to react systematically to a situation, it is preferable to have explicit information about root causes in order to get an overview of actions to be carried out and to set priorities with respect to impact.
4.5.2 Development of the Correlation Algorithm stepwise algorithm refinement
The previous section described the main ideas behind the design of the correlation architecture. To implement the correlation, a more fine grained correlation algorithm is necessary which is developed in the following. For doing so, several assumptions are made in the beginning which result in a relatively simple algorithm. By subsequently dropping the assumptions and changing the algorithm accordingly, it is improved step-by-step. In general, the algorithm is based on an understanding of information as specified in detail in Section 4.6.
132
4.5. Hybrid Event Correlation Architecture Basic algorithm For the basic algorithm several assumptions are made. A1: There is no provisioning hierarchy. This means that all resources are under the control of the provider and therefore the root cause can only be located in the resources (and not in a subservice whose resources are unknown). A2: There are no maintenance operations affecting services and resources. A3: All information about service and resource status is known via existing events. A4: All events are related to a single time stamp and are reported virtually at the same point in time. This means that an event correlation window, the order of events, event validity durations do not have to be considered. A5: There are only isolated dependencies which means that there is no redundancy. A6: There is only one event for a service or resource. As a consequence, situations where the service is working for one user and not for another are not modeled. A7: There are only binary states for services and resources so that there are no quality degradations. A8: Events are not changed during correlation. A9: Dependencies do not change during correlation. A10: Tests exist which detect accurately whether a service or resource is working properly. These tests result in events indicating the status of the service or resource. A11: Dependencies or events are modeled appropriately with respect to the service implementation and functionalities. Based on these assumptions, a basic algorithm is provided in Fig. 4.14 using a pseudocode notation. It returns a candidate list of resources which contains the root causes of symptoms for a set of relevant services. Relevant service means that the provider is interested in finding root causes for this service which is usually the case for services being offered to users. In contrary, the root causes of service events for a subservice that is currently not used for the operation of the top-level services may be ignored.
basic version of algorithm
An MSE (ManagedServiceElement) is a superclass of services and resources. Antecedents of an MSE are those MSEs which are needed for its operation. The algorithm is basically a traversal of an acyclic dependency graph that is formed by the dependencies of the MSEs as explained in the following.
top-down correlation
Events for the antecedents are matched to the event for the MSE in a way that, if there is at least one event on the lower level, the event for the MSE is correlated to this event. Correlation means that the event itself is removed
match to antecedents
133
Chapter 4. Framework for Service-Oriented Event Correlation 1: 2: 3: 4: 5: 6: 7: 8: 9: 10: 11: 12: 13:
procedure C ORRELATION A LGORITHM(service events (from users and/or own monitoring), resource events, services in question) repeat for each event (of any kind) do get antecedents of event’s MSE for each antecedent in antecedents do if status(antecedent) = false then correlate to previous event ⊲ keep only link to higher level event later if correlation successful for one or more antecedents end if end for end for until no further correlations possible return resource events which have been correlated to service events (of services in question) end procedure Figure 4.14: Basic version of the correlation algorithm
from the active events and a reference to the event is added to the event on the lower level. In principle, it is also possible that there are two or more faults on the lower level which means that two or more independent failures have led to the symptom on the higher level. In this - usually quite seldom - situation the event for the MSE is tied to these multiple events on the lower level. positive and negative events
The algorithm only takes negative events as input since these are the ones for which the root cause shall be determined. The retrieval of events for the antecedents then uses both kinds of events (positive and negative) to determine whether an antecedent is working.
rule-based only
The algorithm currently is purely rule-based using a single type of rule for mapping the events down to the lower layers. The case-based reasoning approach will be introduced later when the rules can fail.
assumptions lead to successful correlation
A failure of the correlation can currently not happen due to the assumptions that have been made (status known, no provisioning hierarchy, information correct). The algorithm will therefore always return a candidate list including the resources which are the symptom’s root cause. Due to the downstream suppression (compare Section 3.4), more elements as those that have actually failed can be contained in the candidate list.
parallel processing
Even though this algorithm is successful in traversing the dependency graph, it does not make use of possibilities for parallel execution because the algorithm tries to perform a matching of all kinds of events in the beginning. As explained earlier, a differentiation according to the dependency kind is recommended so that service events and resource events are correlated to events of the same kind in the beginning. This can happen in parallel so that two correlators can be used which is the idea behind the algorithm in Fig. 4.15 and 4.16. 134
4.5. Hybrid Event Correlation Architecture
1: 2: 3: 4: 5: 6: 7: 8: 9: 10: 11: 12: 13: 14: 15: 16: 17: 18: 19: 20: 21: 22: 23: 24: 25: 26: 27: 28: 29: 30: 31: 32: 33: 34: 35: 36: 37:
procedure C ORRELATION ALGORITHM(service events (from users and own monitoring), resource events, services in question) correlationResources ← null for each service event from users do getResources(service), add to correlationResources (avoid double computation with flag) end for do in parallel: thread 1 serviceEventSet ← all service events referring to a service in question repeat for each service event in serviceEventSet do get antecedents(service of the service event) for each antecedent in antecedents do if ((antecedent is a service) and (status(antecedent) = false)) then correlate to previous event, put antecedent in serviceEventSet end if end for if one or more correlations were possible then remove service event from serviceEventSet end if end for until no further correlations possible thread 2 resourceEventSet ← all resource events where resource in correlationResources repeat for each resource event in resourceEventSet do get antecedents(resource of the resource event) for each antecedent in antecedents do if status(antecedent) = false then correlate to previous event end if end for if one or more correlations were possible then remove resource event from resourceEventSet end if end for until no further correlations possible end parallel threads; Figure 4.15: Parallel version of basic algorithm (part 1)
135
Chapter 4. Framework for Service-Oriented Event Correlation 38: 39: 40: 41: 42: 43: 44: 45: 46: 47:
for each service event do get antecedents for each antecedent in antecedents do if ((antecedent is a resource) and (status(antecedent) = false)) then correlate to previous event end if end for end for return resource events which have been correlated to service events (service in question) form candidate list end procedure Figure 4.16: Parallel version of basic algorithm (part 2)
limit correlation to relevant resources and subservices
In addition, some correlations on the resource level are carried out which are not needed for identifying the root causes of the service events (originating from the users). For example, some devices which are currently not part of the service implementation may fail so that events are reported accordingly. However, it is not necessary that these events are being considered which is the case in the basic algorithm. It is also not desired to include events for not relevant subservices into the event correlation.
set of interesting resources
In the beginning, correlationResources is specified as the set of resources which are interesting for the correlation. This set consists of all resources which are used by the services for which service events from users are present. The function getResources is a recursive function which does not only return the resources of the service itself, but also those of the used subservices.
parallel threads
The correlation of service events and resource events is carried out in parallel threads. The procedures inside the parallel threads are similar to the previous algorithm. Finally, correlated service events and resource events are received which are linked by the aggregated correlation step. Please note that for this step no loop is required.
remark on resource level code
It should be noted that the algorithm also deals with the correlation on the resource level for which also other event correlation methods can be applied. Therefore, this part of the code is not mandatory especially if some other kind of correlation is already in place.
inclusion of provisioning hierarchies
Provisioning hierarchy (assumption A1) Starting with the removal of assumptions, provisioning hierarchies are now included into the event correlation procedure. This means that subservices may be subscribed from thirdparty providers which do not allow to take a look at the underlying resources, but provide a view on their services via a CSM interface.
change only in output
For including this, the algorithm only needs to be changed in its output as there are now service events for those subservices from third-party providers which cannot be correlated to resources. It is sufficient to return these events 136
4.5. Hybrid Event Correlation Architecture in addition to the correlated resource events. The final step of the correlation in pseudocode can be written as shown in Fig. 4.17. 1:
return resource events and service events for third-party subservices which have been correlated to service events for services in question
Figure 4.17: Changed output of correlation algorithm for provider hierarchies
Maintenance operations (assumption A2) Maintenance operations lead to the unavailability of resources and therefore also affect the services. Even though the CSM tries to map user symptom reports directly to known maintenance operations, service events should be generated if doubts about the relation to maintenance exist. Concerning the availability and performance of services, there is no difference between symptoms that are caused by problems or by maintenance. Therefore, the idea for the inclusion of maintenance information is to report it via specialized service events and resource events which denote unavailable services and resources including further maintenance information. When the candidate list is transferred to resource management and if it is figured out that the maintenance caused the symptoms for the user, maintenance information can be sent to the user for a second time. It is stated for a second time here since it can be assumed that the provider informs customers and users about service maintenance using an appropriate process.
maintenance operations included as resource events
Missing events about service and resource status (assumption A3) It has previously been assumed that events are given for all services and resources which has been useful to know the status of antecedents. In order to prevent the continued polling of all involved services and resources which would require a lot of effort, the possibility that some information is missing needs to be considered.
events may not be available
Therefore, the three pseudocode segments where a status is requested as shown for the service event correlation in Fig. 4.18 are enhanced with a triggering of tests. This enhancement is shown for the service event correlation in Fig. 4.19. If an event is missing during the execution of the loop, a test is triggered. It is checked whether a similar test has already been requested so that the same test is not performed two or more times. Within the loop it is now checked whether all tests have already returned results which is the additional precondition for finishing the correlation of a service event. Otherwise, it stays in the loop and the next time when it is revisited it is again checked whether the tests have been successfully completed. At this stage, please note that it is assumed that tests are available to reliably show the status of a service or resource. 137
embedding tests in the algorithm
Chapter 4. Framework for Service-Oriented Event Correlation 1: 2: 3: 4: 5: 6: 7: 8: 9: 10: 11: 12: 13:
repeat for each service event in serviceEventSet do get antecedents(service of the service event) for each antecedent in antecedents do if ((antecedent is a service) and (status(antecedent) = false)) then correlate to previous event, put antecedent in serviceEventSet end if end for if one or more correlations were possible then remove service event from serviceEventSet end if end for until no further correlations possible
Figure 4.18: Code segment with assumption that status of antecedents is known
introduction of validity times
Time considerations (assumption A4) The correlation algorithm previously did not consider time constraints since everything has been assumed to happen virtually in one instant. According to the discussion in the previous section, time stamps and validities of the events are introduced which have to be monitored continuously to sort out events from the correlation that are no longer valid. For the service events the time related to the observation of the symptom is taken as basis.
consequences of time constraints
This leads to a situation where the status of a service or resource is regarded as unknown if events for this MSE have expired. The triggering of tests which has been introduced in the last step is helpful at this point because it is applied to generate valid events for the MSE where information is currently missing. However, the introduction of time considerations can lead to situations where a service event may not be correlated to potential root causes on time.
algorithm split-up
As can be seen in the following, the introduction of time leads to quite a few changes in the algorithm and to a split-up of the code for the components which have been identified earlier. The reason for this is that the notion of time requires to treat the event correlation components as continuously parallel working entities. This leads to the following code segments. A mapping of the final code segments to the framework components is depicted in Appendix A. The code inside in the service event correlator which is an adaptation of the code in the first thread has now the pseudocode shown in Fig. 4.20.
correlation loop
Service events are received from the event working set and are put into the set of active service events. If no antecedent is available for a service related to a service event that is currently examined, the service is detected to be a malfunctioning service from a subprovider. This issue has to be reported to the subprovider’s CSM taking the provider’s policies into account (see dis138
4.5. Hybrid Event Correlation Architecture 1: 2: 3: 4: 5: 6: 7: 8: 9: 10: 11: 12: 13: 14: 15: 16: 17: 18: 19:
repeat for each service event in serviceEventSet do get antecedents(service of the service event) for each antecedent in antecedents do if ((antecedent is a service) and (no correlation to antecedent has been done)) then if no event(antecedent) exists then if no test(antecedent) has been triggered then trigger test(antecedent) end if else if status(antecedent) = false then correlate to previous event, put antecedent in serviceEventSet end if end if end for if ((one or more correlations have been possible) and (all tests of antecedents returned results)) then remove service event from serviceEventSet end if end for until no further correlations possible Figure 4.19: New code segment for triggering on demand tests
cussion in the workflow description). For other services having antecedents a correlation is tried to these antecedents (respectively, to events for these antecedents). If no event is present for an antecedent service, an appropriate test is triggered. In order not to delay the correlation, the service event resulting from the test is later reported as a service event from the event working set which is different from the way the tests have been handled before. After the correlation loop has been traversed, the serviceEventSet is cleaned up. Service events for which correlations have been tried to all antecedents are removed from the serviceEventSet. Due to the correct and complete modeling assumption, this correlation has to lead to at least one successful correlation. Finally, a check is performed to see whether there are service events which are no longer valid. These are sent back to the event working set.
serviceEventSet clearance
Similar to the code for the resource event correlator, an adaptation of the thread2 code is provided in Fig. 4.21. The task to maintain the list of resources for which a correlation should be performed is transferred to the event working set. As can be witnessed, the algorithm is quite similar to the service event correlation. A difference is the return of events to the event working set. While events are returned from the service event correlation when antecedents that are resources are encountered, events are returned here when a complete correlation for the event on the resource level has been performed. 139
difference to service event correlation
Chapter 4. Framework for Service-Oriented Event Correlation 1: 2: 3: 4: 5: 6: 7: 8: 9: 10: 11: 12: 13: 14: 15: 16: 17: 18: 19: 20: 21: 22: 23: 24: 25: 26: 27: 28: 29: 30: 31: 32: 33: 34: 35: 36: 37:
procedure S ERVICE E VENT C ORRELATION serviceEventSet ← null while true do ⊲ permanent correlation loop add new service events to serviceEventSet (received from event working set) for each service event in serviceEventSet do get antecedents(service of the service event) if number(antecedent) = 0 then ⊲ it is a subprovider’s service send to subprovider CSM, remove from serviceEventSet else for each antecedent in antecedents do if antecedent is a service then if no event(antecedent) exists in serviceEventSet then if no test(antecedent) has been triggered yet then trigger test(antecedent) end if else if (status(antecedent) = false) then correlate to previous event end if else ⊲ antecedent is a resource send service event to event working set (as correlated service event) end if end for end if end for for each service event in serviceEventSet do if correlation to all antecedents that are services performed then if one or more status(antecedent) = false then ⊲ successful correlation remove service event from serviceEventSet end if ⊲ else case currently not possible due to assumptions end if if correlation time slot for service event exceeded then send service event to event working set end if end for end while return end procedure Figure 4.20: Correlation procedure for service event correlation
140
4.5. Hybrid Event Correlation Architecture 1: 2: 3: 4: 5: 6: 7: 8: 9: 10: 11: 12: 13: 14: 15: 16: 17: 18: 19: 20: 21: 22: 23: 24: 25: 26: 27: 28:
procedure R ESOURCE E VENT C ORRELATION resourceEventSet ← null while true do ⊲ permanent correlation loop add new resource events to resourceEventSet (received from event working set) for each resource event in resourceEventSet do get antecedents(resource of the resource event) for each antecedent in antecedents do if no event(antecedent) exists in resourceEventSet then if no test(antecedent) has been triggered yet then trigger test(antecedent) end if else if status(antecedent) = false then correlate to previous event end if end for end for for each resource event in resourceEventSet do if correlation to all antecedents performed then send resource event to event working set (as correlated resource event) remove resource event from resourceEventSet ⊲ completely correlated resource event end if if correlation time slot for resource event exceeded then send resource event to event working set end if end for end while return end procedure Figure 4.21: Correlation procedure for resource event correlation
For the aggregated event correlation the correlation procedure is depicted in Fig. 4.22 which is again quite similar in the main part. The successful correlation of service events to resource events invokes the forwarding of the underlying resources to resource management which are then handled as root cause candidates. For both service and resource events the validity has to be monitored. The idea behind the algorithm is based on the time conditions that usually exist in event correlation. As events on the resource level are reported with delays in the order of usually less than a second, it can be assumed that a correlation result on the resource level can be provided within seconds since such a performance is achieved by state-of-the-art correlation system implementations. This correlation can be done independent from the correlation on 141
only short delays in resource event correlation
Chapter 4. Framework for Service-Oriented Event Correlation
1: 2: 3: 4: 5: 6: 7: 8: 9: 10: 11: 12: 13: 14: 15: 16: 17: 18: 19: 20: 21: 22: 23: 24: 25: 26: 27: 28: 29: 30: 31: 32: 33: 34: 35: 36: 37:
procedure AGGREGATED E VENT C ORRELATION serviceEventSet ← null resourceEventSet ← null while true do ⊲ permanent correlation loop add new service events to serviceEventSet (received from event working set) add new resource events to resourceEventSet (received from event working set) for each service event in serviceEventSet do get antecedents(service of the service event) for each antecedent in antecedents that is a resource do if no event(antecedent) exists in resourceEventSet then if no test(antecedent) has been triggered yet then trigger test(antecedent) end if else if status(antecedent) = false then correlate to previous event end if end for end for for each service event in serviceEventSet do if correlation to all antecedents that are resources performed then if one or more status(antecedent) = false then ⊲ successful correlation send resources in resource events correlated to this service event as candidates to resource management remove service event from serviceEventSet end if ⊲ else case currently not possible due to assumptions end if if correlation time slot for service event exceeded then send service event to event working set end if end for for each resource event in resourceEventSet do if correlation time slot for resource event exceeded then send resource event to event working set end if end for end while return end procedure Figure 4.22: Correlation procedure for aggregated event correlation
142
4.5. Hybrid Event Correlation Architecture the service level. The situation of the service event correlation is different as service events resulting from tests may be provided usually with several seconds of delay, while the events from users will often have a delay of minutes. Therefore, it is reasonable to assume that a correlation on the resource level could already be performed so that the service events can be matched to fully correlated resource events.
service events may have significant delays
With the introduction of time the event working set gets a central role within the event correlation workflow (see Fig. 4.23 and Fig. 4.24). Apart from distributing the events to the event correlators, the event working set has to take care of outdated events. For doing so, the considerations in Section 4.3.9 need to be taken into account.
event working set
The correlation performed in the case-based reasoner is done according to the steps presented in Section 3.4.4 (refer to this section for the options that are available for each step). For the received events similar events are found in a case database for which a key term matching technology based on a set of fields is applied. The specification of the fields is given in Section 4.6. The other retrieval methods are not applicable since the special conditions like the structure of sentences or the geometric representation of cases are not given here.
key term matching for case-based reasoner
For the adaptation different methods are possible in addition to a manual adaptation. The parameterized adaptation is reasonable if a very similar situation has already been presented, e.g. if two devices back up each other and if once one of the devices has not been available which has been documented and now the other one has to be restored. The procedural adaptation can be reasonable to integrate symptom solving expertise, but it is preferable that this knowledge is already used for the rule-based reasoner.
adaptation method
Since the case-based reasoner acts as a backup, it usually deals with difficult situations for which non-standard solutions are applied. An unsupervised execution of adapted solutions may therefore often lead to wrong results so that a supervised application of the solution is recommended together with integrating the possibility to easily perform tests to check the recovery of services and resources.
execution method
Finally, the new case has to be stored in the case database (see Section 4.6.4).
Redundancies (assumption A5) The previously made constraint which assumed only isolated dependencies is now revisited. The contrary of isolated dependencies are dependencies that have to be seen in relation to each other. However, it can be concluded that this situation does not require a change in the correlation algorithm due to the way how the dependencies are traversed which is explained in depth in the following.
consequences of redundancies
A redundancy means that a service is making use of redundant resources or that a service has subservices of equal functionality which can be exchanged.
no change in correlation
143
Chapter 4. Framework for Service-Oriented Event Correlation 1: 2: 3: 4: 5: 6: 7: 8: 9: 10: 11: 12: 13: 14: 15: 16: 17: 18: 19: 20: 21: 22: 23: 24:
25: 26: 27: 28: 29: 30: 31: 32:
procedure E VENT WORKING S ET while true do serviceEventSet ← null resourceEventSet ← null correlatedServiceEventSet ← null correlatedResourceEventSet ← null ⊲ variables correlationServices and correlationResources externally maintained serviceEventSet ← new service events from CSM and own monitoring resourceEventSet ← new resource events from resource monitoring and testing for each service event in serviceEventSet do if service(service event) not in correlationServices then remove service event ⊲ exclude events for not considered services end if end for for each resource event in resourceEventSet do if resource(resource event) not in correlationResources then remove resource event ⊲ exclude events for not considered services end if end for send serviceEventSet to service event correlator ⊲ condition that at least one antecedent of the service is a service can be added send resourceEventSet to resource event correlator correlatedServiceEvents ← correlated service events from service event correlator correlatedResourceEvents ← correlated resource events from resource event correlator send correlatedServiceEvents to aggregated event correlator send correlatedResourceEvents to aggregated event correlator ⊲ condition that at least one dependent of each resource is a service can be added serviceEventSet ← non-correlated events from service event correlator and aggregated event correlator for each service event in serviceEventSet do if important service event then send event to case-based reasoner else discard event end if end for Figure 4.23: Management of events in event working set (part 1)
144
4.5. Hybrid Event Correlation Architecture 33: 34: 35: 36: 37: 38: 39: 40: 41: 42: 43:
resourceEventSet ← non-correlated events from resource event correlator and aggregated event correlator for each resource event in resourceEventSet do if important resource event then send event to case-based reasoner else discard event end if end for end while return end procedure Figure 4.24: Management of events in event working set (part 2)
The traversal of the dependencies for the service fault diagnosis is top-down, i.e. the search is started from a symptom in a dependent and tracks it down (recursively) to the antecedents. In the example that a service has several redundant resources this means that the starting point is a (negative) event for the service. The resources have to be checked in any case - redundant or not if they contain the root cause of the event. The situation is different for impact analysis where a conclusion from the resource status has to be drawn for the services. An analysis of the SLAs might have shown that a failure of a certain percentage of the resources can be tolerated. This means that a conclusion from the status of one resource cannot be made, but that the availability of all resources has to be considered.
different consequence for impact analysis
Even though the consideration of redundancies does not lead to a change of the correlation algorithm, it is now necessary to differentiate between the service availability per user. Without redundancy the service is either working or not so that a general status for a service is sufficient. With redundancy the service can be working well for one user and poorly or not at all for another depending on the resources which are used for realizing the service for the respective user.
information modeling w.r.t. redundancies
Multiple events for one service or resource (assumption A6) The considerations in the previous paragraph are related to the need to drop the assumption that only one event is present for an MSE. Currently the algorithm assumes that the status of a service is specified uniquely by a corresponding event. The situation is addressed by a precorrelation of events that relate to the same MSE. Once a new event is reported, it is checked whether events already exist for this MSE. If this is the case, it has to be distinguished between different situations. If a previous event indicated a properly working MSE and now a symptom is reported, the previous event can be discarded. The same holds if two events are simply duplicates of each other. A more complicated situation 145
precorrelation of events
Chapter 4. Framework for Service-Oriented Event Correlation is encountered if an event indicates that an MSE is working properly, while a previous event indicated a symptom. Here, special conditions (see discussion for rule definition in Section 4.6.3) are applied to check whether this event indicates a clearing of the symptom. In doubt the negative event is preserved and is treated in the event correlation. A similar situation is also given if a service works for one user and not for another one. Here, the event correlation deals with the symptom notification primarily, but the correlation of events allows to preserve the information that the MSE is partially available. degradation example
Non-binary states (assumption A7) Dealing with non-binary states means to provide a measure for the performance of an MSE which is different from just a binary available or unavailable. A simple example is given in Fig. 4.25 where the use of a service functionality involves several resources which process the request in a kind of pipeline. The overall transaction time is given as the sum of the processing times within the resources. The actually achieved processing time has to be monitored with respect to the time constraints specified in the SLAs. In the example the processing time achieved is ten seconds and therefore exceeds the SLA threshold which has been set to nine seconds. overall processing time 10 seconds service functionality
SLA threshold 9 seconds
resource
resource
resource
processing time 3 seconds
processing time 5 seconds
processing time 2 seconds
Figure 4.25: Example of a transaction time as sum of processing times on the resource level specification of thresholds
In contrast to the situation with binary states, it is not obvious how to make one or more resources responsible for the abnormal behavior. The agreement of SLAs requires that the provider makes assumptions about the overall processing time that can be reliably achieved. For the resources being used this means that estimations are made for the average response times and also for the variety that these times can have. Thresholds have then to be specified for the resource processing times so that events are sent in abnormal situations. An optimal specification of the thresholds has to find a trade-off between sending too many events which later turn out to be not necessary and missing events which would have been helpful for the correlation. This issue is not easy to solve in the general case. It is also dependent on the SLA specification (compare Section 3.5.1) for which no specific assumptions are made here.
proactive events
For dealing with this additional requirement in the correlation, proactive and 146
4.5. Hybrid Event Correlation Architecture reactive measures are needed. On the resource level the thresholds are used to specify resource events which are sent when the thresholds are violated and also when the thresholds are met again. The same applies to subservices for which time-related events have to be specified. These kinds of events can be regarded as proactive as they indicate a service quality degradation in advance. A reactive measure in this context means that a service event related to a quality degradation is matched to resource events for which an appropriate modeling of the relation between the time conditions in the service and in the resources is a prerequisite. In case a match is not possible, tests have to be triggered to test the resource timeliness. Finally, those resources where the time conditions are not met are sent to resource management including the difference value for the performance deviation which can serve as a means to order the candidate list.
reactive correlation
For the algorithm the meaning of the “true” and “false” states has to be generalized with respect to different QoS parameters. The previous binary state is therefore a special case for the QoS parameter “availability”. The relationships between the QoS/QoR parameters (compare Section 4.6) have to be specified, but still a dependency graph is given so that the algorithm can stay unchanged. More important are the additional constraints that arise for the modeling of dependencies and events.
generalization of positive and negative events
Change of events during the correlation (assumption A8) The conditions for the change of events during the correlation have already been discussed in Section 4.3.8. While the procedure for reporting events initially is quite simple and has not been given yet, the potential change of events requires a more complicated tracking of the already performed correlation. Therefore, a combined pseudocode is given for the input at the CSM in Fig. 4.26.
input procedure
As a condition for the execution of the roll-back the validity time of the originally reported event is used. The idea is that it does not make sense to put this event back in the correlation when all the related information is from the past and therefore the examination of potential root causes has already happened. Please note that the change of a previously reported event is only executed when there is no new observation.
roll-back conditions
Change of dependencies (assumption A9) Changes in the realization of a service can happen during the event correlation. These changes have to be reflected in the modeling of dependencies and therefore the retrieval of the antecedent in the event correlation will have different results depending on the current situation. However, it is not useful to always return only those dependencies that are up-to-date because the event correlation happens within a certain delay so that a successful correlation may no longer be possible. Therefore, those antecedents that were given by the dependencies at the point in time that is investigated should be returned. This leads to the introduction of validity intervals for the dependencies.
validity interval for dependencies
147
Chapter 4. Framework for Service-Oriented Event Correlation 1: 2: 3: 4: 5: 6: 7: 8: 9: 10: 11: 12: 13: 14: 15: 16: 17: 18: 19: 20: 21: 22:
procedure I NPUT AT CSM if reporting of new symptom then traverse IA decision tree if no user fault and credential verification ok then transfer resulting service event to event working set else report back to user end if else ⊲ check status of previous service event retrieve old service event if service event not correlated then update service event using the IA else ⊲ try roll-back of correlation if correlation time of service event exceeded then return ⊲ roll-back not promising as related events already out-of-date else track links to correlated events (recursively) transfer events to event correlator end if end if end if return end procedure Figure 4.26: Input procedure
CBR backup for test inaccuracies
likelihood of inaccurate modeling misguided correlation
Treatment of missing or inaccurate tests (assumption A10) Previously, it has been assumed that tests are present to check the status and, after the introduction of non-binary states, also the performance of services and resources. The automated correlation requires that testing routines are provided which then deliver the corresponding service and resource events. In case of inaccurate tests, the correlation will fail and then the case-based reasoner will have to deal with the situation. The manually identified root cause should later be used to check its testing routines.
Consequences of inaccurate modeling of dependencies or events (assumption A11) The previously made assumption that dependencies and events are modeled correctly may not hold in real world situations in particular due to the complexity of the relationships that are found (compare Section 4.6 for the proposed modeling of dependencies and events). For inaccurate dependencies two situations can occur, i.e. missing correlations and wrong correlations. Missing correlation means that an event cannot be mapped to events for antecedents when a relationship to antecedents has been forgotten or is inaccurately modeled. In this case the rule-based correlation will fail and the event will be transferred to the case-based reasoner. A more inconvenient situation is encountered when a wrong correlation to a lower 148
4.5. Hybrid Event Correlation Architecture level event occurs. The resource management will then perform actions to repair the root cause of the lower level event assuming to remove the condition for the higher level event. In a later stage, a renewal of the service event may indicate that its root cause has not been identified. In order to avoid this situation, it is important to verify after the clearance of a root cause that all services and resources for which events have been correlated to this resource are really working properly again. Correlation optimizations for stability and accuracy There are preprocessing operations which are usually performed for the correlation on the resource level, such as filtering and counting. While filtering is already part of the event working set for selecting those events potentially related to services in question, further applications of these operations may be helpful in concrete situations. E.g., malicious floods of service events could be excluded from the service correlation or threshold levels for reporting events on the resource level may be dynamically adapted to regulate the amount of events.
preprocessing operations
The candidate list of resources could also be subject to optimizations. For instance, special testing methods (maybe requiring more effort) could be executed once a resource is entered into the candidate list. The resources in the candidate list can also be ordered according to different criteria. For example, it can be known that one kind of resource is much more likely to fail than another kind so that resource management should preferably check this kind of resource at first. Furthermore, a credibility of a resource fault can be estimated taking into account the number and credibility of events that have been correlated to the resource event. For performance parameters the ranking method by Agarwal et al. [AAG+ 04a] can be used which uses the deviation from a standard performance and its propagation along the dependency tree for rank assignment as well as for the construction of a high and low priority set of candidates. However, a function of this is highly dependent on the actual scenario and cannot be given in general.
postprocessing operations
The examination of candidates can make use of events which indicate the last proper operation of MSEs. This information is often very useful as symptoms are often side-effects of service implementation changes.
identify faults introduced by changes
Summary Table 4.1 serves as a summary of the development of the algorithm and shows the dropped assumptions together with the measures that have been taken. As the code for the correlation algorithm has been developed in an iterative way where sometimes only parts have been changed, the complete code of the algorithm including a figure to map it to the framework components can be found in Appendix A. Algorithm performance The performance of the algorithm depends on different influence factors which are given in the following list. 149
Chapter 4. Framework for Service-Oriented Event Correlation New circumstance Starting point. A1: There may be services from suppliers so that resources are hidden. A2: There can be maintenance operations affecting the services. A3: Events may be missing for service and resource status indication. A4: Time is considered.
A5: There can be redundancies in the service implementation. A6: There can be multiple events relating to one service or resource. A7: Quality degradations are considered.
Change of algorithm Basic rule-based algorithm which runs under several assumptions. Only the candidate list needs to be changed so that supplier subservices can be put into the candidate list. Maintenance information is included in the correlation similar to other events and therefore maintenance can be identified as root cause. Active probing is used to trigger tests for services and resources. Consequently, appropriate automatic tests have to be defined. The algorithm is split up into different modules which run in parallel. The time conditions make it possible that the event correlation cannot be completed in time. Therefore, the case-based reasoning module is introduced. It is explained why this does not affect the correlation (in contrast to impact analysis).
This information is correlated prior to the main correlation. Time conditions are considered to solve contradictions. While the correlation itself can be left unchanged, additional events have to be introduced for modeling threshold violations. The dependencies also need to be refined for this aspect. A8: Events can be changed A procedure for providing input is given. It dewhen a mistake in the input pends on the progress of the correlation to what has happened. extent the correlation can be modified. A9: Dependencies can A validity interval is defined for the dependenchange during the correla- cies so that only those dependencies that have been tion. present at a certain point in time are considered. A10: Tests may be missing The backup method (CBR) has to deal with the or inaccurate. failed rule-based correlation that will occur in this situation. A11: Dependencies or Similar to the previous situation, the CBR module events may be inaccurately will assist to deal with a failed correlation. modeled. Event storms may occur Filtering heuristics may be applied to ensure the for service event correla- stability of the correlation. tion. Candidate lists should be Failure statistics from the past and deviations from ordered to give a recom- thresholds may be used. mendation which potential causes to examine first. Table 4.1: Summary of algorithm refinement
150
4.5. Hybrid Event Correlation Architecture • number of services (s) • number of resources (r) • number of dependencies (d) • number of events (e) • number of additional tests and their time to complete • frequency of outdated service events and resource events so that a casebased reasoning is necessary For the rule-based correlation a correlation performance of O(s + r)2 where s is the number of services and r is the number of resources can be given as upper bound. The worst case of the algorithm performance is that for a chain of services and resources as many as possible dependencies exist and that service events are given for the first element of the chain (see Fig. 4.27). Furthermore, all of the services and resources in the chain may turn out to be affected by symptoms as well so that actually all of the dependencies have to be tracked. It is obvious that it is required to check all services and resources within the chain. The performance can also be expressed in terms of the number of dependencies. In this case the performance is linear even for the worst case as dependencies have to be checked at most only once (O(d)). For the Big-Oh notation it does not make a difference whether tests are necessary for all the steps along the chain and how long these tests require to complete because this can be regarded as constant factor. The number of events is an additional factor for the algorithm because the events from real users have to be treated in any case, while there may be some other events like resource events for unused resources which can be ignored. In a worst case situation all events relate to the first service in the chain so that these have to be correlated to each other at first. As the events can be assigned to the service and ordered by date on arrival, no sorting operations are needed. Therefore, the precorrelation happens linearly in O(e) where e is the number of events so that the overall performance can be given by O((s + r)2 + e) or O(d + e).
quadratic performance as worst case
For the quadratic performance stated before, it needs to be emphasized that it does result from two assumptions which usually should not hold. The number of dependencies for service and resources should be limited to some upper bound per MSE by the service implementation because too many dependencies lead to an error-prone service when many potential causes affect the service quality. The quadratic performance is also a result of symptoms in the lower layers of the dependency tree. As the number of symptoms is usually much less than the number of elements, the tree traversal will not enter into large parts of the tree where no symptoms are witnessed. In summary, a linear performance in terms of the number of services and resources can be assumed in practice.
linear performance under realistic assumptions
Furthermore, the review of the state-of-the-art shows that event correlation techniques are successfully applied to fault diagnosis on the resource level so that it can be assumed that this correlation is scalable in practice. While
possibility to distribute the correlation
151
Chapter 4. Framework for Service-Oriented Event Correlation a) example situation
b) worst case
services
resources
event types monitored event event resulting from triggered test
negative
positive dependency (any of the three kinds)
Figure 4.27: Events for services and resources in an example situation (a) and in a worst case scenario (b)
the algorithm based its parallel correlation on the separation of the service and resource level, further separations can easily be performed in the same way. An example is the micro-correlation in the Netcool example (see Section 3.4.8) so that only correlated events are provided for a resource. Depending on the structure of the services being offered it may also be suitable to separate the correlation on the service level.
4.5.3 Definition of Service Events and Resource
Events necessity of additional event specification
The service event correlator deals with service events and aggregated resource events. Therefore, a methodology is needed how these events should be defined. On the resource level many events are defined by device vendors, but on the service level the events are more subjective in nature and dependent on the various SLAs. A workflow for the specification of the events is therefore given in the following. The information modeling for the events is detailed in Section 4.6, while example event specifications can be found in Section 6.2.
differentiation into service functionality
The idea is to start from the service functionality specifications which have been laid down in the SLAs. For each service functionality it has to be considered whether the service events should be specifiable to be related to this 152
4.5. Hybrid Event Correlation Architecture functionality or to the service in general. The idea behind this option is to allow for a different modeling depth of events according to the importance of the functionality. For a seldom used functionality it may not make sense to make it specifiable, while this can be very helpful and reasonable with respect to the effort for frequently used functionalities. For these frequently used functionalities categories of standard symptoms can be defined for allow for a further differentiation. The service events always need to have a free text field where additional information can be specified (either in addition to functionality and category, supplementary to functionality only, or just in addition to the service). For dealing with QoS parameters, an observed QoS value has to be part of a corresponding event either related to the service as a whole or to a specific functionality.
differentiation into categories
To define the additional resource events, the QoS parameter specification in the service events has to be mapped to the resource level. This means that a time condition that is dependent on the performance of a set of resources has led to the definition of thresholds for these resources.
additional resource performance events
Obviously, CSM including the IA, the QoS probing and measurement, as well as the resource management have to be able to deliver service events and resource events according to the previously given considerations.
events have to be provided
4.5.4 Management of Rule Database As depicted in Fig. 4.28, there is a direct and an indirect way to define rules for the rule-based reasoning module. The direct way starts from the Service MIB and defines the rules accordingly which is done in a rule generation module. For doing so, dependencies which are stored in the Service MIB are transformed into corresponding rules which is done for inter-service dependencies as well as service-resource dependencies. The reason for this is that these dependencies denote the link between the provided services and the underlying subservices and resources.
two ways for rule generation
For example, the Service MIB can contain information that a service is dependent on a subservice. Therefore, rules should be defined to match events for the subservice to events for the service and also to trigger tests for the subservice if no events are given. Corresponding considerations hold for the service-resource dependencies. Details about the resulting rules are discussed in Section 4.6.3.
rule derivation example
The automated derivation of rules from the Service MIB in contrast to encoding the rules by hand makes it less likely to have inconsistencies within the rule set. The provider’s configuration management needs knowledge about the service configuration in any case, e.g. to accurately perform changes in the service implementation. As the formalization of knowledge allows for an automated derivation of rules, the additional overhead for maintaining the rules can be regarded as low. After changes in the service implementation it is necessary to trigger an update of the rules. An additional encoding of rules
low maintenance effort due to automated derivation from existing knowledge
153
Chapter 4. Framework for Service-Oriented Event Correlation event correlator case−based reasoner
rule−based reasoner
case database
rule database
rule generator
service modeler
Service MIB
rule generation from service modeling
rule generation from cases
Figure 4.28: Possibilities for rule generation
by hand should be avoided. case-triggered rule derivation
The indirect way of rule generation is done from cases (see following section). It results in an update of the Service MIB which then leads to a trigger for the generation of additional or updated rules. Therefore, this kind of rule generation converges to the direct way of rule generation.
4.5.5 Management of Case Database use of CBR
The case-based reasoning module is only used if a service event cannot be matched to the resource level using the rules. In the case-based reasoner this event is matched to prior cases (see argumentation for assumption A4 in Section 4.5.2 for the methods to be applied and Section 4.6.4 for the structure of cases). In some situations, an adaptation to a prior solution can be found, while a completely new solution has to be determined by hand, otherwise. The current event together with its solution is used by the service modeling module to improve the service modeling in the Service MIB for which a semiautomated implementation is foreseen. This means that some operations like the retrieval of related parts in the service model and standard operations to change them can be supported by a tool, while the change of the modeling itself is conducted by service management staff. The rule generation using the Service MIB is then used to update the rule base in order to be able to cope with this and similar events in the future.
dealing with solved cases
However, there is a trade-off for the use of the RBR and CBR module. In some situations it may be reasonable to leave a case in the case database without changing the service modeling. Reasons for that can be the difficulty or effort for enhancing the service modeling in comparison to the frequency and impact of this situation which is closely related to the choice of an appropriate 154
4.6. Information Modeling and Management modeling depth. Another trade-off exists in the management of the case database. It has to be decided which case should be kept for the long term, e.g. if some cases have been used to update the service modeling. Another problem arises when changes in service management occur. Some cases may then become inaccurate which means in particular that the stored solution would not work anymore. Sometimes it may be reasonable to try to update the cases or at least to mark the cases that are affected by a service implementation change.
4.6
maintenance of case database
Information Modeling and Management
In service fault diagnosis different kinds of information have to be dealt with as indicated on different occasions within the previous sections. Therefore, a unique information modeling is needed especially for the automation of the workflow. In the following a service model with respect to the requirements of fault management is developed by integrating the needed aspects. Afterwards, service events, resource events, rules and cases are modeled which are used during the event correlation workflow.
section motivation
As the examination of related work has shown (compare Section 3.2.1), CIM is a widely adopted information model which is in particular useful for the modeling of resources. The CIM service class cannot be used here due to its understanding of a service as a process running on a single host. The modeling of services is based on the MNM Service Model. It makes use of the service attribute specification in the Service MIB and can in itself be integrated with the Service MIB or NGOSS SID which will contain additional attributes and classes for purposes beyond service fault diagnosis.
extension of CIM
4.6.1 Model for Service Fault Diagnosis A class model is derived for the needs of the correlation components and is therefore centered on the different kinds of dependencies which are found in the service operation. It also includes attributes and a selection of operations (not complete for set and get operations) for configuring these which is needed for the service modeling component.
class model
Basic Class Model In Fig. 4.29 a basic class model is defined which contains the major classes needed for service fault diagnosis. The attributes and methods of the classes are explained in the following subsection.
explanation of main classes
Its central element is the Service which is closely associated to the classes ServiceFunctionality and QoSParameter. These two classes are essential for
service class
155
Chapter 4. Framework for Service-Oriented Event Correlation > User
accesses
*
> Customer
InterService Dependency
* ServiceAccess 1..* supplies Point
refers_to depends_on
* *
* 1
1..*
Service
substantiates
* concludes
* ServiceLevel * Agreement
1 *
*
1..*
* QoS Parameter
Service Functionality
depends_on refers_to
ServiceResource Dependency
* * *
InterResource Dependency
ServiceEvent
1 concludes > Provider
ResourceEvent
1
Resource *
depends_on
*
QoR parameter
Figure 4.29: Basic class model for service fault diagnosis
a service because a service without service functionalities is not useful and the service quality is a characterizing feature of the service. modeling granularity for services and service functionalities
The information modeling aims to allow for different depths of modeling which holds for QoS parameters, dependencies and SAPs. A QoS parameter can be defined for the service as a whole (e.g. the availability of the service) or specifically for a service functionality (e.g. a time condition for the execution of a transaction). Dependencies can be modeled for a service in general or for its service functionalities. The modeling also gives the possibility to have different kinds of SAPs which can be tied to the service (if all service functionalities can be accessed via this SAP) or to service functionalities.
SLA class
For describing the conditions of use for a service the SLA class is introduced. An SLA is agreed with one or more Customers and has one Provider. In the SLA thresholds for the QoS parameters of the service and its service functionalities are laid down.
resource class
Resources are specified together with a QoR class. The term “quality of resource (QoR)” is adopted from the term “quality of device” parameter [DR02] and describes a feature of a resource which can be relevant for a QoS param156
4.6. Information Modeling and Management eter. Examples are the CPU load or memory consumption of a device or the utilization of a link. The term highlights the relation to the service quality and is therefore used here, even though strictly speaking these values are not directly related to a quality measure. The figure does not contain two superclasses that are also introduced. The class ManagedServiceElement is a superclass of services and resources. The class Dependency denotes a superclass of the specific dependencies.
superclasses
The information model that is designed here aims at modeling information that is needed to perform the fault diagnosis. The elements that perform the diagnosis like the CSM as input for the diagnosis are not modeled as classes since this information is not needed. For a given scenario subclasses can be derived from the classes given here. For instance, a subclass of the SLA class is useful when additional constraints have to be specified for the use of the service.
scope of information model
Detailed Class Model In the following class attributes and operations are specified for the classes of the basic model. ManagedServiceElement The ManagedServiceElement is a common superclass of resources and services as shown in Fig. 4.30/4.31. Its naming is related to the term “managed object” that denotes elements that are relevant for network management. The attribute administrative status history refers to the status of the service or resource from an administrative point of view which is related to the service life cycle. It denotes whether an MSE is planned, being implemented, in use, currently being changed or has been withdrawn. The changes between the phases are needed for the dependency determination. For example, a resource that is no longer in use cannot be the root cause of symptoms anymore. The history of changes is kept to be able to identify a mistake in change management as the root cause of current symptoms. It can also be used in the service fault reporting to explain some symptoms which may be caused by a scheduled maintenance.
administrative status
In contrast to the administrative status history, the operational status history reflects the results of tests being performed for the MSE and whether the MSE has responded properly. If this has not been the case, a link to the resulting event has to be added. The history of this kind of status is also helpful for the root cause identification in the case-based reasoning module so that it is known when the MSE has worked properly the last time and to examine the changes that happened afterwards. The operational status is a summary of the QoS/QoR measurements that are carried out for the MSE in a sense that it indicates whether there are any symptoms at a given point in time.
operational status
157
depends_on
* * *
1
adminStatusCurrent 1
+ getAdminStatusCurrent(): AdminStatus + getAdminStatusHistoric(DateTime): AdminStatus + setAdminStatusCurrent(AdminStatusEnum): void + getOperStatusCurrent(): OperStatus + getOperStatusHistoric(DateTime): OperStatus + setOperStatusCurrent(OperStatusEnum): void + getSingleDependency(int): Dependency + getCompositeDependency(int): CompositeDependency + scheduleTest(Test): void + getResponsible(): StaffMember[] + addResourceDependency(Resource): void + removeResourceDependency(Resource): void + getEvents(void): GenericEvent[]
AdminStatus − adminStatus: AdminStatusEnum * adminStatusHistory * − adminStatusDate: DateTime
operStatusCurrent
1
operStatusHistory
− operStatus: OperStatusEnum * − operStatusDate: DateTime − operStatusEvent: GenericEvent
OperStatus
ServiceFunctionality * * + executeFunctionality(): void
Service
Resource − faultScore: float
depends_on
+ addServiceFunctionality(ServiceFunctionality): void * + removeServiceFunctionality(ServiceFunctionality): void + addSubServiceDependency(Service): void * depends_on + removeSubServiceDependency(Service): void
* + getFaultScore(float): void *
*
* *
* depends_on
InterResourceDependency − antecedent: Resource − antecedentQoR: QoRParameter − dependent: Resource − dependentQoR: QoRParameter + getAntecedent(): Resource + getAntecedentQoR(): QoRParameter + getDependent(): Resource + getDependentQoR(): QoRParameter *
*
ServiceResourceDependency − antecedent: Resource − antecedentQoR: QoRParameter − dependent: Service − dependentFunc: ServiceFunctionality − dependentQoS: QoSParameter + getAntecedent(): Resource + getAntecedentQoR(): QoRParameter + getDependent(): Service + getDependentFunc(): ServiceFunctionality + getDependentFuncModeled(): boolean + getDependentQoS(): QoSParameter *
InterServiceDependency − antecedent: Service − antecedentFunc: ServiceFunctionality − antecedentQoS: QoSParameter − dependent: Service − dependentFunc: ServiceFunctionality − dependentQoS: QoSParameter + getAntecedent(): Service + getAntecedentFunc(): ServiceFunctionality + getAntecedentFuncModeled(): boolean + getAntecedentQoS(): QoSParameter + getDependent(): Service + getDependentFunc(): ServiceFunctionality + getDependentFuncModeled(): boolean + getDependentQoS(): QoSParameter *
Chapter 4. Framework for Service-Oriented Event Correlation
Figure 4.30: Details of the service and resource classes with respect to dependencies (left side)
158
ManagedServiceElement − testSchedule: TestSchedule − description: String[] − responsible: StaffMember[]
is_dependent
1 *
CompositeInterResourceDependency
CompositeInterServiceDependency
*
1 is_dependent
+ addDependency(InterResourceDependency): void + removeDependency(InterResourceDependency): void + getPartialDependency(int): InterResourceDependency + getAllPartialDependencies(): InterResourceDependency[]
+ addDependency(InterServiceDependency): void + removeDependency(InterServiceDependency): void + getPartialDependency(int): InterServiceDependency + getAllPartialDependencies(): InterServiceDependency[]
1 CompositeServiceResourceDependency
*
+ addDependency(ServiceResourceDependency): void + removeDependency(ServiceResourceDependency): void + getPartialDependency(int): ServiceResourceDependency + getAllPartialDependencies(): ServiceResourceDependency[] is_dependent
* SingleDependency − antecedent: ManagedServiceElement − usageRecord: UsageRecord[]
1 CompositeDependency
*
+ addDependency(Dependency): void + removeDependency(Dependency): void + getPartialDependency(int): Dependency + getAllPartialDependencies(): Dependency[]
+ getAntecedent(): ManagedServiceElement
Dependency − dependent: ManagedServiceElement − strength: Strength − description: String[] + getDependent(): ManagedServiceElement + getStrength(): Strength + setStrength(Strength): void + getAdminStatusCurrent(): AdminStatus + getAdminStatusHistoric(DateTime): AdminStatus + setAdminStatusCurrent(AdminStatusEnum): void
adminStatusCurrent
adminStatusHistory
4.6. Information Modeling and Management
159
Figure 4.31: Details of the service and resource classes with respect to dependencies (right side)
is_dependent
Chapter 4. Framework for Service-Oriented Event Correlation > User
accesses
> Customer
* Service
* concludes
* supplies * + addSAP(SAP): void substantiates ServiceLevel ServiceAccess 1..* 1 + removeSAP(SAP): void 1..* * Agreement Point + addSAP(SAP, ServiceFunctionality): void + remove(SAP, ServiceFunctionality): void * + addSLA(SLA): void + changeSLA(SLA): void 1 concludes + terminateSLA(SLA): void > + getProvider(): Provider Provider + checkUser(User): boolean
Figure 4.32: Classes related to the Service class and additional operations dependency attributes
There are also dependency attributes that denote a dependency of an MSE on another MSE which are then refined in the subclasses. In addition, a test schedule is defined using a set of test methods.
staff members
Persons who are responsible for the MSE have to be documented. This information is needed in particular for processing cases which usually require human interaction.
operations
The operations for the MSE include operations for getting and setting both types of status as well as for getting the dependencies/composite dependencies for the MSE. Resource dependencies can be added and dropped here because both services and resources can depend on resources (in contrast to service dependencies). Test operations can be scheduled and the staff members responsible for the service can be determined. Furthermore, it is possible to retrieve all events that are related to an MSE. Service The Service class inherits from ManagedServiceElement. In addition to the associations to its QoS parameters (see below) and service functionalities as well as to SLAs, SAPs and dependencies, no additional attributes are needed for fault management.
operations of Service class
The operations of the Service class allow to add and remove dependencies on subservices and allow for adding and dropping service functionalities. An additional figure (Fig. 4.32) shows operations that are needed for SAPs and SLAs, i.e. for adding and removing SAPs, and for adding, changing, and removing SLAs. The operation getProvider allows to retrieve the provider of the service which is required for services from subproviders. An additional method (checkUser) is proposed to be able to verify whether the user belongs to the authorized users of a service.
classes without operations
Service management has to have information about SLAs, SAPs, as well as Users, Customers, and Providers. However, there is no need for attributes and operations for these classes with respect to service fault diagnosis. For SLAs refer to the different modeling possibilities that are discussed in Section 3.5. 160
4.6. Information Modeling and Management The ServiceFunctionality is closely tied to the Service. In this generic model a method to execute the functionality is given which has to be detailed for concrete functionalities. ServiceFunctionalities may also have subfunctionalities.
service functionality
Resource The Resource class is a subclass of the MSE. In addition to the inherited attributes and methods, it contains QoR parameters (see below). The faultScore attribute is proposed as additional information for the candidate list. Its idea is to use statistics from the past to determine how likely a failure of this kind of resource is. It can be applied as a criterion for ordering the resource candidate list. For a given scenario the resource can be modeled using the CIM recommendations so that no further detailing is needed at this point. Dependency In the right part of Fig. 4.30/4.31 a set of classes is specified for dependency modeling. Dependency is an abstract superclass that contains - apart from a description - a strength field. This field is making use of an abstract Strength class which has to be specified by impact analysis for which this field is crucial in the dependency tree traversal. It has different interpretations for the corresponding dependency classes as discussed below. Even though the values for the strength attributes are of minor concern for fault diagnosis since all antecedents are considered anyway, the discussion is helpful to understand the different nature of dependencies that are dealt with.
dependency strength
Similar to the MSE the Dependency class has current and historical administrative states and corresponding operations. The subclasses SingleDependency and CompositeDependency are derived from Dependency where the latter one aggregates an arbitrary number of SingleDependencies. While a dependency can have only one dependent, it can have one antecedent (in case of a SingleDependency) or more (in case of a CompositeDependency). The dependent attribute and operation is therefore tied to the Dependency class, while it is differentiated for the antecedent attributes and operations between the two subclasses. The composite dependency classes have an association to the dependent which is needed to identify all dependencies that have been defined for the MSE.
isolated and composed dependencies
The SingleDependency and CompositeDependency classes are themselves superclasses of three further classes each of which is formed with respect to the three dependency types. A composite dependency class only composes dependencies of the same kind because the antecedents have to be of the same kind to allow for an exchange. This is also possible in a recursive manner which means that composite dependencies can consist of composite or single dependencies of the same kind.
class hierarchy
An example to motivate this design is a functionality that is realized by using an external subservice or internal resources. However, these resources are only a replacement of the subservice if they offer a similar functionality.
redundancy example
161
Chapter 4. Framework for Service-Oriented Event Correlation Therefore, an internal subservice should be composed out of these resources which should be denoted as antecedent of the functionality. An additional dependency should specify the relationship of the resources to this internal service. processing time
In addition to the redundancy situation, the composition of dependencies is also beneficial for situations where a performance parameter results from the collaboration of services and/or resources. For example, the processing of a transaction for a user (QoS parameter of a service functionality) may involve external subservices and internal resources and an overall processing time should not be exceeded. For clarification it is also recommended here to compose the internal service-resource dependencies using an additional internal QoS parameter for the service functionality. The dependency of the performance parameter on this internal QoS parameter can then be composed to the external inter-service dependencies. The advantage is that the dependency layers are not mixed and that it is clearly separated what is provided internally or externally.
usageRecord
The SingleDependency class contains a usageRecord attribute as a placeholder. It allows to record the use of a dependency over time so that it can be determined which resource has been used at a given point in time. This can be helpful for the manual diagnosis to backtrack a past situation.
dependencies refer to quality parameters
Dependencies are related specifically to QoS and QoR parameters as discussed in the non-binary states paragraph in the algorithm development. The colloquial “service x depends on resource y” therefore translates to QoS parameter “availability” of service x depends on QoR parameter “availability” of resource y.
Inter-service dependency For inter-service dependencies two classes are devised, i.e. InterServiceDependency and CompositeInterServiceDependency. In the InterServiceDependency class it is differentiated between the coupling of the dependency to services or to their service functionalities which can be decided both for the antecedent and dependent service. service composition
The strength attributes for the InterServiceDependencies being composed in the CompositeInterServiceDependency are related to the possibility to exchange the subservices. For example, a restaurant finder service gives information about restaurants located nearby to a mobile user. The restaurant finder service might contact a weather service to get information about the local weather conditions which are needed to determine whether outdoor locations can be recommended. A redundancy situation is given here if multiple weather services are present with similar functionality. Therefore, the strength of a dependency should be defined as a formula depending on the number and quality of alternative services. In addition, price considerations for using alternative services should be taken into account.
162
4.6. Information Modeling and Management Service *
* QoSParameter − description: String[] − measurement: String[] − testSchedule: TestSchedule + calculate(): Value + measure(): Value + setTestSchedule(TestSchedule): void
depends_on
* ParameterHistory
* Resource
+ value: Value + date:DateTime + event: GenericEvent
QoRParameter * − description: String[] − measurement: String[] − testSchedule: TestSchedule
*
+ measure(): Value + setTestSchedule(TestSchedule): void
Figure 4.33: QoS and QoR classes
Service-resource dependency The classes for service-resource dependencies are called ServiceResourceDependency and CompositeServiceResourceDependency. The strength attributes are applied here to model redundancies in the service implementation as given for the six redundant web servers in the LRZ Web Hosting example. For the service-orientation the strength of the dependency has to be regarded with respect to the SLAs. For example, it might be acceptable if only one of the servers is working, the majority of them is working, or if only one of them is not available. The definition could also be based on the response time or the number of queries which can be processed.
service quality consideration
Inter-resource dependency The classes for inter-resource dependencies are called InterResourceDependency and CompositeInterResourceDependency. The modeling of InterResourceDependencies in subclasses should make use of the CIM dependency classes which are well suited to model these dependencies. The strength of dependencies on the resource level is given by the network topology and device-internal conditions. For example, a network connection from a resource to the SAP might run over alternative network paths so that some redundancy exists. A computer might contain a single main memory so that the failure of the main memory will lead to a complete failure of the computer. A hard disk failure might be covered by a second disk within the computer. 163
redundancies on resource level
Chapter 4. Framework for Service-Oriented Event Correlation QoSParameter A QoSParameter (see Fig. 4.33) is tied to a Service or sometimes more specifically to a ServiceFunctionality. The QoSParameter is described in prose in the description field, while its measurement methodology is specified in the measurement field. A test schedule exists to test the parameter on a regular basis. The calculation function makes use of the dependencies on other QoS and QoR parameters which are given by the dependencies (inter-service and service-resource dependencies). It describes the dependencies more precisely and can also be applied to an internal calculation of the service quality achieved. The QoSParameters are a specialization of the service attributes as described by the Service MIB and their definition including the specification of dependencies can be done as described in Section 3.2.1. In contrast to the calculated quality, events are resulting from regular and on demand measurements so that an access to these measurements is given. An on demand measurement can be triggered by the measure operation. QoRParameter The QoRParameter class is structured similar to the QoSParameters. Due to the basic nature of these parameters, they are usually directly measured. However, an integration of the resource event composition by the SMONA architecture (see Section 3.4) can lead to a composition of the measurements already on the resource level.
4.6.2 Modeling of Events event classes
The modeling of events is required to specify the information needed as input for the correlation. The definition of events cannot rely on the definitions of device vendors, but has to include additional events for resources and services. For the resources these events have to reflect the QoR parameters, while the service events denote a new concept that has been introduced in this thesis. Examples of the events can be found in Section 6.2.2.
abstract generic class
GenericEvent class The modeling of events starts from an abstract event class that is common for events related to resources and services. Abstract event class means that it is not useful to send events of this type of class because it then contains too few information. The resulting class hierarchy is depicted in Fig. 4.34. For uniquely referring to an event an identifier attribute is provided. Usually a long value should be appropriate for this purpose.
event source
The generic service event defines a source attribute which relates to where the event originates from. Possibilities of sources are users and the own service monitoring for services as well as resources themselves (e.g. via SNMP traps) or resource monitoring tools for resources.
164
4.6. Information Modeling and Management GenericEvent − identifier: long − source: String − status: StatusEnum − severity: SeverityEnum − receptionDate: DateTime − validDate: DateTime
* ResourceEvent * − resource: Resource − resourceQoR: QoRParameter * * linkedCause
*
linkedCause linkedImpact
* linkedImpact
*
ServiceEvent * − service: Service − serviceQoS: QoSParameter − SAP: ServiceAccessPoint[] − credibility: CredEnum − keywords: String[] − description: String[] − referringDate: DateTime
*
*
* linkedCause
*
linkedImpact
ServiceFuncEvent − serviceFunc: ServiceFunc
Figure 4.34: Event hierarchy classes (abstract classes)
The status attribute is used to manage the processing of events. Recommended status options are OPEN, SUSPENDED, CORRELATED, TIMEDOUT which have the following meanings. OPEN stands for a new event which has been received and for which the correlation has begun. It is also possible to introduce an additional state like RESPONDED to acknowledge that an event has been received. The status CORRELATED means that an event has been fully matched to possibly related events so that it does not need to be considered on its own for the correlation. The SUSPENDED state is introduced for denoting that an event waits for the results of tests. TIMEDOUT means that an event was removed from the active events because it is no longer valid (compare validDate attribute).
status enumeration
The value severity defines a severity level which should be considered as a kind of impact that is related to the class of event. For example, event severities can be dependent on the kind of service or resource in particular when an impact has been precomputed by an impact analysis assuming a hypothetical failure of the MSE, on the event source or further criteria.
impact estimation
The receptionDate attribute specifies the time when an event is received, usually with a precision of seconds. For resources it is assumed that this time has only a minor difference from the time when the symptom occurred so that no additional time attribute is given. This is different for service events where a significant delay can occur especially when events are reported by users. To reflect this difference, an additional attribute (referringDate) is introduced for services.
date of event reception
165
Chapter 4. Framework for Service-Oriented Event Correlation event validity interval
The duration how long an event is valid is specified by the validDate attribute. To make the calculation easier, a final date should be specified instead of a duration.
abstract resource event class
ResourceEvent class An abstract class for resource events is derived from the generic event class. It contains the resource referring to a resource class in the class structure. It also specifies a QoR parameter to which the events relate. Subclasses have to be derived to denote the meeting or violating of thresholds for these QoR parameters. For a Boolean QoR parameter like the availability this means that there will be two events denoting the availability or unavailability of the resource without further internal parameters. For other types of QoR parameters like the CPU load events will indicate the meeting or violating of a threshold. The measured value itself will also be contained in the event.
correlation process tracking
For tracking the correlation of events the linkedCause attribute is introduced which denotes the correlation to other events. Resource events can be linked to other resource events, but not to service events because a service symptom cannot be the reason for a resource symptom. For clarification, the linkedImpact attribute is introduced to record that another event is the impact of the given event. In this direction links can also be created to service events which is related to the other way the dependencies are traversed for impact analysis.
generic service event class
ServiceEvent class and ServiceFunctionalityEvent class The abstract class ServiceEvent is derived from the GenericEvent class and specifies further service-related attributes. Similar to the ResourceEvent class, the relations linkedCause and linkedImpact are specified. A service event should be related to a service and to a QoS parameter so that references to these classes are included.
referring data for time gap
As explained for the generic events, the additional attribute referringDate is introduced for denoting the point in time when the reported symptom has been observed. It therefore allows to compensate the delay in reporting the symptom.
service access point
The SAP attribute refers to the SAP where the service has been accessed. This piece of information is useful for situations where the symptom is related to the way the service is accessed (e.g. access via one SAP seems to work, but not for another one).
credibility enumeration
The idea of the credibility attribute is to store information about the credibility of a service event. It is not needed for events that result from resources or the own monitoring of a provider, but for the externally provided information for service events. For example, it should be recorded whether automated tests have succeeded or failed. A set of states could be NOT REPRODUCED, REPRODUCTION FAILED, REPRODUCTION SUCCEEDED, CREDIBLE. NOT REPRODUCED means that there has not been an attempt to reproduce the reported symptom either because it is not possible for that kind of reported 166
4.6. Information Modeling and Management symptom or the testing capability is currently not available or not implemented. These situations could also be distinguished by different states. REPRODUCTION FAILED means that the test action for reproducing the symptom did not have the same result, while the REPRODUCTION SUCCEEDED acknowledges a successful reproduction. The CREDIBLE state is the default state for events from the provider. It is possible to combine the latter two states since the reproduction shows that there is really a symptom. The attributes keywords and description are needed for the case-based reasoner when the automated correlation has failed. The keyword fields contain a set of keywords which are partially or completely predefined. In the retrieval step of the case-based reasoner these attributes are used for matching. The description attribute contains a natural language text that describes the symptom. It is used for manual search for related cases and for resolving the service event by hand.
attributes for CBR and manual reasoning
Service events can be more specifically reported for a service functionality. Therefore, a class ServiceFunctionalityEvent is defined as a subclass of ServiceEvent which has a service functionality as parameter.
event tied to specific functionality
Similar to the ResourceEvent class, concrete subclasses have to be specified for the ServiceEvent and ServiceFunctionalityEvent classes. These denote the fulfillment or violation of thresholds for QoS parameters.
construction of subclasses
Comparison with ITIL incidents, CSM trouble reports, and trouble tickets The specification of service events is closely related to other formats that have been presented in the related work. ITIL incidents also aim to collect information for the incident and the potential later problem treatment, but these recommendations are not designed for the automation of the processing which requires a clear categorization of events according to MSEs and quality parameters. This also holds for the CSM trouble reports. Nevertheless, both formats already allow for the linking to related reports and have a possibility to set states for tracking the report treatment. The CSM report format is closely related to TT formats and also makes the distinction between the times for the detection of symptoms and their reporting.
missing strict categories for automation
4.6.3 Rules In the following a set of rule types is given in a pseudocode notation which relate to the steps of the algorithm in Section 4.5.2. The correspondence is shown by indicating those assumptions whose removal makes it necessary to introduce additional rules. The pseudocode notation is divided into event, condition, and action part. Usually, more subtypes of rules are possible within the rule categories which can be created in given scenarios.
167
types of rules
Chapter 4. Framework for Service-Oriented Event Correlation correlation for same MSE
Correlation for events related to the same MSE The first kind of rules aims at correlating events that relate to the same MSE and therefore corresponds to assumption A6. The removal of this assumption makes it necessary to correlate events for the MSE prior to correlating them to other events. The events for the same MSE can either express the same or compatible information or can be contradictory.
similar events for the same MSE
The simplest situation is when two events express that there are no symptoms for an MSE. These events can then be matched and the status of one event can be set to CORRELATED. Please note that information that an MSE is working is given by the event class (e.g. SERVER RESPONSE TIME OK vs. SERVER RESPONSE TIME NOT OK). event event1, event2 condition event1.class within eventclasses and event1.class equals event2.class and event1.status equals OPEN and event2.status equals OPEN and event1.validDate greater than event2.validDate action event2.status set CORRELATED and event2.linkedCause add event1
rule parts
This rule is designed for a set of event classes for which it should be applied. It is then checked whether the events belong to the same class and whether both have not been correlated yet. The correlation keeps the event with the longer validity and the other event is withdrawn from further correlations. Even in this simple case the correlation can also aggregate information for service events if the SAPs were different. An additional action can then be to attach the SAPs for the second event to those for the first event.
related event for the same MSE
If two events report a symptom for a resource or service, the situation can be more complicated because it should be aimed to aggregate information that has been gained. However, this can be difficult when it is not clear whether the events have the same root cause. On the resource level two events indicating that the resource is not available can be easily matched, while service events that relate to the same service should not be matched if the SAPs are different. A match of events for the same service is only reasonable if most of the information is compliant. There is also the possibility to increase the severity as the result of the correlation. event event1, event2 condition event1.class within eventclasses (here service event classes) and event1.class equals event2.class and event1.status equals OPEN and event2.status equals OPEN and event1.SAP equals event2.SAP and event1.validDate greater than event2.validDate action event2.status set CORRELATED and event2.linkedCause add event1 and event1.credibility set maximum(event1.credibility,event2.credibility) 168
4.6. Information Modeling and Management and event1.keywords set merge(event1.keywords,event2.keywords) and event1.description set concatenate(event1.description,event2.description) The third situation are events for the same MSE that are contradictory for which again two cases can be distinguished according to the referringDate/receptionDate. If a clearing event has occurred after a symptom reporting event, then both events can (if they exactly refer to the same MSE without differences like the SAP) be correlated and it can be assumed that the symptom is no longer existing. It is important to consider sporadic events for which the cause cannot be identified in this way. Therefore, a limit for the frequency of closing events in this way (i.e. by the reporting of clearing events) can be defined. In the following example eventclassA is a symptom event, while eventclassB is the corresponding clearing event.
clearing events for the same MSE
event event1, event2 condition event1.class equals eventclassA (here service class) and event2.class equals eventclassB (here service class) and event1.status equals OPEN and event2.status equals OPEN and event1.f requency less than threshold and event1.ref erringDate less than event2.ref erringDate and event1.SAP equals event2.SAP action event1.status set CORRELATED and event1.linkedCause add event2 In the opposite order, i.e. a clearing event followed by a symptom event, it can be assumed that the clearing event is not correct anymore. It is therefore correlated to the following symptom event (eventclassA and eventclassB as defined in previous example).
other order for the same MSE
event event1, event2 condition event1.class equals eventclassB (here service class) and event2.class equals eventclassA (here service class) and event1.status equals OPEN and event2.status equals OPEN and event1.ref erringDate less than event2.ref erringDate action event1.status set CORRELATED and event1.linkedCause set event2
Top-down correlation The rules which are in focus of service-oriented event correlation are those where events are correlated with respect to the dependencies. The following rule shows a general correlation and is needed for implementing the basic algorithm. event event1, event2 condition event1.class depends on event2.class and event1.status equals OPEN and event2.status equals OPEN, SUSPENDED or CORRELATED 169
general rule for top-down correlation
Chapter 4. Framework for Service-Oriented Event Correlation action event1.linkedCause add event2 event2.linkedImpact add event1 This rule has to be activated for two event classes where the MSEs are directly dependent. The rule structure is similar disregarding whether the event2 indicates a symptom or not. In case no symptom is given for the underlying MSE, it means that this MSE can be excluded from the potential candidates for explaining the symptom. flexible correlation ordering
The events for the antecedent class do not have to be open, but can already be partially (status SUSPENDED) or fully correlated. This means that a correlation on lower layers can already be executed prior to constructing the link to higher layers. If all possible correlations have been tried for all antecedents of an MSE, the event can be regarded as fully correlated. Its status is therefore set to CORRELATED. This rule is also already needed for the basic algorithm. event event1 condition event1.class within eventclasses and event1.status equals OPEN and for each antecedent(event1.MSE) {there is one event(antecedent) linkedCause to event1} action event1.status set CORRELATED
triggering tests for missing events
Triggering tests The correlation rules only work if events are given for the lower level in the MSE hierarchy which may not be the case. Therefore, rules are in place to trigger tests which result in additional events. These rules correspond to assumption A3. In the correlation engine it is important that on each iteration the top-down correlation rules are carried out first. Otherwise, events are suspended before the tests have been called so that the events cannot be opened again. event event1 condition event1.class within eventclasses and event1.status equals OPEN action for each antecedent(event1.MSE) {if there is no event(antecedent) linkedCause to event1 then trigger test(antecedent) and event1.status set SUSPENDED }
additional test to wait for test results
The SUSPENDED status is used in order not to spend time on events for which test results are missing. The asynchronous arrival of the test results should not block the correlation. However, additional rules have to ensure that the suspended events are reactivated when test results are reported. event event1, event2 condition event1.class depends on event2.class and event1.status equals SUSPENDED and event2.status equals OPEN 170
4.6. Information Modeling and Management action event1.status set OPEN At this point the event is only reactivated, but not correlated which would be possible with the information gained. This is carried out by the rules in the top-down correlation part.
reactivation of events
Rules for candidate list Certain classes of events are predefined as potential root causes. Once these events are raised they are forwarded to resource management or the subservice CSM since only events related to resources or subclasses from external providers can be items of the candidate list. By using the linkedImpact attributes resource management can then also track to which service events the candidates events have been correlated. This rule is necessary for the basic algorithm and for assumption A1 (subprovider CSM).
candidate output
event event1 condition event1.class within eventclasses and event1.status equals OPEN action send to resource management(event1) The sending to resource management is replaced by sending to subprovider CSM for other events. Timer rules The timer rules take care of uncorrelated events which are marked as TIMEDOUT according to the validDate that has been specified. These rules are a result of the consideration of time constraints (assumption A4).
check time of events
event event1 condition event1.class (carried out for all events) and event1.status equals OPEN or SUSPENDED and event1.validDate less than CURRENTDATE action event1.status set TIMEDOUT It then depends on the class of event whether it is sent to the case-based reasoner. This is only reasonable for service events/service functionality events which denote a symptom.
event forwarding
event event1 condition event1.class within eventclasses and event1.status equals TIMEDOUT action send to case-based reasoner(event1) Organization of rule knowledge For the organization of memory with respect to the Rete alpha and beta networks (compare Section 3.4.2) it is recommended to organize the events as alpha network using services, QoS parameters and SAPs as categories in a service-related part as well as for resources and QoR parameters in a resource-related part. The beta network can then be organized to assist in the correlation of events using more than one event. 171
use of Rete networks
Chapter 4. Framework for Service-Oriented Event Correlation Derivation of rules from dependency classes An important point for the scalability of the approach is the possibility to derive rules from the information modeling. An implementation of the information model should be able to generate rules with respect to the information being provided. For example, if a dependency is specified between a service and a resource, a rule to match events for the service onto events for the resource can be derived automatically. The generated rules can be shown to an administrator for approval.
4.6.4 Cases generic case template specification
A case takes information from attributes of the originating service event or service functionality event, but also adds and drops information. The first block of attributes is used for the key term matching. The case template, which is explained in the following, is depicted in Fig. 4.35.
service and service functionality identification
The service field specifies the service to which the case is related. If the case originated from a service functionality event, the field service functionality is filled with the name of the service functionality. Otherwise, this field is left blank.
QoS parameter and SAP
The service event is always related to a QoS parameter which is specified in an equally named field. For the SAP attribute it has to be taken into account that multiple SAPs can be specified so that this field is designed as a list in the case template. It is proposed to organize the SAPs as checkboxes where a tick means that the symptom also occurs for the corresponding SAP.
keywords for case retrieval
Furthermore, the keywords which are specified for the event are stored in a list field. Together with the previously described attributes the keywords are used for the key term matching.
human operator information
A set of attributes is used for information of a human operator. This set is formed by the description of the originating event, information about correlated events if the correlation has been partially successful, the severity and credibility of the event, and the event dates (receptionDate, referringDate, validDate).
case processing information
Some information has to be added for the further processing of the case. It has to be assigned to one or more employees, has to get a status of the case processing, and a documentation of the solution steps. The solution steps should contain links to other cases which were retrieved (automatically or manually) to assist in the case resolution.
meshed organization recommended
Organization of case knowledge As explained in Section 3.4.4, there are different options for the organization of the case database. For the cases that have been defined here, a meshed organization is suitable. A hierarchy is constructed for the services and resources, subdividing the services into service functionalities and subdividing all three of them into QoS/QoR categories. Different categories are formed on this level according to the key terms. The meshing is used here to map a case to different key terms. It is also possible to 172
4.6. Information Modeling and Management
Service: Service functionality: QoS Parameter: Service access points: SAP1
SAP2
SAP3
Keyword1
Keyword2
Keyword3
Additional keyword1
Additional keyword2
Additional keyword3
Keywords:
Description:
Correlated events: Severity:
Credibility:
Reception date:
Timeout date:
Referring date: Assigned to: Status: Solution steps:
Related cases:
Figure 4.35: Case template (assuming three QoS parameters, SAPs, keywords and additional keywords)
map the cases to other QoS/QoR parameters or to different services, service functionalities or resources.
Automated population of major cases In addition to the possibility to start with an empty case database, it is preferable to have some reference cases generated automatically using the service modeling and also involving an impact analysis. A strategy that is proposed here is to assume single broken resources and to estimate the impact that is caused by these situations including the effect on users. The estimated symptoms are then the basis for the assumed service events and the derived cases. This methodology will ensure that failures of resources have already been documented as cases. Due to the ongoing work on service-oriented impact analysis, a detailed recommendation for this 173
use of impact analysis
Chapter 4. Framework for Service-Oriented Event Correlation is a subject of future work.
4.7
Assessment Metrics for a Given Scenario
measuring benefit
The benefit of the approach in a concrete scenario can be measured by different metrics as discussed in [HS05]. The aim of the provider is to improve its profit by lowering the cost for service fault management. The cost savings are a result of prevented SLA violations and the effort reduction in the event processing. On the other hand, the costs for maintaining the event correlation components need to be taken into account.
short term metrics required
As financial consequences are difficult to determine during the ongoing service management, simpler methodologies should be used to track the benefit received by the automated correlation. Metrics are required that allow for the quantification of the benefit and therein also allow for optimization.
mean time for root cause identification
Metrics for SLA violation prevention An indicator for the prevention of SLA violations is the mean time to identify the symptoms’ root causes. However, the use of this metric based on the events that are actually received can be misleading. Some underlying root causes may be more difficult to classify than others that are received in another time interval. This kind of analysis may seem reasonable for a longer time period where this effect may loose its relevance as many root causes are then given in an examination period.
benchmark solution
A benchmark set of events and root causes may be constructed which are diagnosed in order to compare different configurations of the framework or for comparing it to a situation without automated correlation. The benchmark can be run in a maintenance interval since it would otherwise affect the regular correlation. The construction of the benchmark should be based on statistics of events and root cause frequencies.
other SLA related criteria
Apart from the use of the mean time for fault diagnosis, a percentage of root causes where the identification took longer than a predefined time interval can be calculated which may be more relevant towards potential SLA violations. In addition, the fault diagnosis time can be differentiated between different severity levels of the events.
metrics for the web interface
Metrics for effort reduction The tracking of the effort reduction has to be based on the performance of the workflow steps. If a CSM web interface is offered in addition to the possibility to report symptoms via phone, a high percentage of users accessing the web interface is desired because it does not require human involvement for the provider. If few users make use of the web interface, it may not be helpful enough, hard to find, or the description of the 174
4.8. Collaboration with Impact Analysis decision tree steps may not be understandable for the users. An indicator for the information collected is the number of requests that have been necessary to request further information from users. It can be seen as indicator to what extent the required information is gathered in the first place. For the rule-based correlation a simple indicator for the effort reduction is the percentage of service events that have been correlated to other events and do not need to be treated as isolated events anymore. Additionally, the number of false positives should be taken into account which records the situations where a false correlation occurred. Both events serve as indicators of the modeling accuracy.
RBR metrics
For the case-based reasoning it should be tracked to what extent related cases are useful to diagnose the situation. In addition to a binary value, it can be distinguished between the effort for the modification of the proposed solution.
CBR metrics
4.8
Collaboration with Impact Analysis
The output of the service-oriented event correlation together with the manual examination of the candidates are one or more resources which have been detected to be the symptoms’ root cause. Such resource faults can be taken as input for an impact analysis (see Section 3.5.3) where the dependencies of services and resources are used to identify services affected by the resource faults. For the impact analysis the dependencies are traversed in the opposite order, i.e. inter-resource dependencies are used to find other affected resources and service-resource dependencies and inter-service dependencies are traversed to identify affected services. In addition, SLAs have to be accessed in order to quantify the estimated impact. The impact estimation is useful to select adequate actions to deal with the faults.
root causes as input for impact analysis
A framework combining both service event correlation and impact analysis has been addressed in [HSS05c]. An improved version is depicted in Fig. 4.36 where it can be seen that some components are used both by the service event correlation and impact analysis. These components are the CSM, QoS probing and measurement, Service MIB and candidate verification.
common framework
A question mark is placed in the framework between the service event correlation and the impact analysis which relates to the question when an impact analysis should be started. This discussion is related to a discussion in ITIL (see Section 3.1.1) where it is left open whether an impact shall be estimated for a single incident or only after receiving several related incidents.
collaboration of fault management steps
The starting point of the combination of the frameworks described above is that the service fault diagnosis determines a root cause using the candidate verification component and that this component then triggers the impact analysis. This means that in contrast to ITIL an impact is calculated for the root causes and not for the incidents themselves. This can result in a delay in
root cause determination prior to impact analysis
175
Chapter 4. Framework for Service-Oriented Event Correlation quality degradation detection
quality degradation diagnosis
quality degradation resolution
Customer Service Management
customer level
QoS probing and measurement service management
SLA database service level
service event correlator
?
SLA verificator
Service MIB
resource level
service usage prediction
recovery management
network and systems MIB
resource event correlator resource probing
information flow
candidate verification
fault repair
network and systems management
control flow
Figure 4.36: Framework for service-oriented event correlation and service impact analysis and fault recovery (refined version of [HSS05c])
the impact estimation when a critical situation is encountered. Nevertheless, optimization possibilities exist for combining the fault diagnosis and impact analysis. reuse of information gained during fault diagnosis
It can be witnessed that the event correlation already reveals part of the impact when inspecting the correlation result from another perspective. The event for the root cause resource has been correlated to other events up to the originating service events. These pieces of information can be used to have a lower bound for the impact which may in some situations already be helpful to trigger some kind of escalation. Another possibility is to define some events which directly trigger an impact analysis. This could be possible on different levels, like special input events only from a single user or on a medium level in the correlation hierarchy.
4.9
Assessment
The achievements of this chapter are compared to the requirements in Section 2.4 to review whether the targeted aims could be reached. This assessment is set in context to the state-of-the-art and its assessment. generic as MNM Service Model
G1: Genericity The modeling of the workflow and its components made no assumptions about the service so that the range of services for which the 176
4.9. Assessment framework can be applied is as general as in the MNM Service Model. The workflow which has been developed can be regarded as a refinement of eTOM despite of the criticism concerning the separation of fault management and performance management in the framework. It is also compliant to the ITIL recommendations. G2: Scalability The scalability in the proposed framework has several aspects. In the choice of the event correlation method the performance has been considered so that a timely event correlation could be ensured. In the framework the correlation on the service level which usually comprises fewer events has been separated from the correlation on the resource level. Therefore, a well-tuned correlation on the resource level can be successfully extended towards the service level.
correlation performance
The scalability is also related to the information modeling. The design of the class structure aimed to allow for different modeling granularities so that a balance between modeling effort and the resulting diagnosis accuracy can be found. This refers to the split-up of services into service functionalities, the modeling of QoS/QoR relationships, and also the modeling on the resource level.
scalability in information modeling
G3: Low effort A key feature of the event correlation design is the generation of event correlation information from the service modeling, i.e. the generation of rules from the Service MIB. As the introduction of a systematic service management for an organization requires the documentation of service-related information for change management, the additional effort for transforming this information into rules by the proposed method is low. Another point is the intrinsic learning capability of CBR so that the CBR knowledge can be regarded as to some extent self-adapting.
maintenance effort for diagnosis knowledge
4.9.1 Workflow Requirements The workflow which has been developed can be regarded as a refinement to the eTOM recommendations. It has been designed with respect to the possibilities for tool support so that a partial automation of the workflow is feasible.
workflow as eTOM extension
W1: Workflow granularity The workflow detailed some of the steps that have to be carried out, but avoided to make assumptions about the services which are provided.
detailing of workflow steps
W2: Techniques and tools The steps have been designed with respect to possibilities for automation. This comprises the event generation at the CSM/IA as well as the automated methods for the provider’s service monitoring and probing. The usual way of diagnosis happens in an automated
tool support for automation
177
Chapter 4. Framework for Service-Oriented Event Correlation fashion which results in a candidate list of resources. In case of a failure of the automated correlation, the service management staff is supported by the case-based reasoner which provides related information.
keeping of eTOM layering
W3: Cross-layer interaction By keeping the clear separation of management layers in eTOM, a clarification of tasks of the different layers is reached. A corresponding separation between service management and resource management is not part of ITIL. The chosen structuring allows to assign responsibilities within an organization similar to ITIL’s role model.
monitoring metrics
W4: Workflow monitoring For the monitoring of the workflow assessment metrics have been discussed in Section 4.7. These can be applied for continuous monitoring of the workflow.
4.9.2 Management Information Repositories The design of the class model aimed at allowing for different modeling depths with respect to the needs of an organization. It is also dedicated to extensibility with respect to other related contexts such as impact analysis or service management in general.
class models for the service level
M1: Scope of managed objects In the information modeling in Section 4.6 object-oriented class models have been developed which are based on CIM recommendations for the resource level. They aim to fill the gap concerning service fault related information which includes the modeling of events, rules, and cases in addition to the service-specific classes. M2: Fault management attributes The classes for services and resources have been designed with respect to the required fault management attributes. Apart from the dependencies this deals with testing possibilities, fault likelihood, QoS/QoR parameters, etc.
dependency classes
M3: Dependencies A set of classes has been dedicated to characterize the dependencies which exist on the different levels. This modeling is an important basis to allow for the traversal of the dependency hierarchy in the diagnosis.
solutions to detailed requirements
Concerning the detailed requirements the following design choices have been made: The dependencies are separated into different classes for the three kinds of dependencies (M3a). For the service level the option is given to tie a dependency to a service as a whole or to a service functionality (M3b). The model includes the possibility to reflect redundancy on the different levels (redundant services, redundant resources) by introducing additional classes 178
4.9. Assessment for composite dependencies (M3c). The base class MSE and also the dependency base class have an administrative status attribute so that the service life cycle can be modeled (M3d). The dynamic of dependencies can be expressed via usage records which can be specified for dependencies (M3e). While the organization itself is not represented in the model, inter-organizational dependencies are specified as dependencies among services (M3f) which is the information relevant for fault diagnosis.
4.9.3 Fault Management Interfaces The interface design is based on the idea to combine interactions defined by the CSM with IA decision trees. In addition, CSM interfaces are foreseen for the collaboration with providers of subservices.
F1: Symptom reporting function The CSM interaction for reporting symptoms to the provider is implemented using the IA decision trees. The decision tree has to be designed in a way that all information for the automated treatment specified within the service event format is collected.
extension of CSM interactions using IA
F2: Symptom prediagnosis The IA decision tree contains test actions which aim at reproducing the reported symptom and can therefore enhance the accuracy of symptom reports directly in the reception workflow.
IA feature
F3: Plausibility checks In addition to verifying the users’ identity and rights, some plausibility checks can be included into the IA symptom report reception.
included in IA
F4: Change of reports The CSM also contains a workflow for changing symptom reports. Depending on the frequency of such changes, it can also be supported by IA decision trees.
CSM workflow
4.9.4 Service Symptom Diagnosis For the service symptom diagnosis a hybrid event correlation approach has been chosen which loosely couples an RBR and a CBR module. The rulebased diagnosis embeds active probing in the automated processing.
hybrid solution
S1: Learning capability The learning capability of the diagnosis is ensured by the CBR module which deals with failed correlations from the rule-based module. The backtracking of the failed event correlation together which the correct diagnosis is used to update the service modeling.
CBR module for updating the service modeling
179
Chapter 4. Framework for Service-Oriented Event Correlation use of service dependencies
S2: Early matching An early matching of related symptom reports is achieved by modeling the service dependencies explicitly and by trying to correlate service events with regard to theses dependencies at the beginning of the correlation. The service events are then processed in an aggregated way.
algorithm without single root cause assumption
S3: Multiple root causes The rule-based correlation is not based on a single root cause assumption. This has the consequence that all antecedents of an MSE have to be checked whether they are working as expected which is not the case for a single root cause assumption. Here, the examination of antecedents can be aborted if a single broken antecedent is found. Nevertheless, it is obvious that an implementation where a single root cause assumption is desired (e.g. for performance reasons) can be achieved with modifying the procedure at that point.
scheduled and on demand testing
S4: Testing Testing methods are included into the correlation in two ways. For detecting symptoms both on the service and resource levels tests are performed on a regular basis. The reporting of symptoms via the IA includes the possibility to automatically try to reproduce them. Testing is also used in the correlation algorithm where tests are triggered for getting additional events for the lower layers. Further automated tests can be foreseen when putting a resource into the potential root cause candidate list.
lost symptom recovery
The use of testing in the event correlation procedure is also a means to partially cope with lost symptoms. Missing symptoms for antecedents are requested as part of the procedure.
4.9.5 Embedding into Overall Management Solution The framework has been designed for extensibility towards other fault management phases and in context of an overall service management solution. common service fault management framework
E1: Impact and recovery management Section 4.8 presented a common framework to link fault diagnosis and impact analysis. In addition to the joint use of some components like the QoS measurement, the modeling of dependencies within the class structure has also been aimed at reusability for impact analysis.
detailing eTOM and ITIL
E2: Service management The compliance to ITIL and eTOM ensures that the fault diagnosis can become part of an overall solution for service management. It collaborates in particular with the QoS measurement module which is designed for customer-oriented SLM. Furthermore, metrics for monitoring the fault diagnosis workflow have been discussed which also serve as input for SLM. 180
4.10. Summary Requirement details G1: Genericity G2: Scalability G3: Low effort W1: Workflow granularity W2: Techniques and tools W3: Cross-layer interaction W4: Workflow monitoring M1: Scope of managed objects M2: Fault diagnosis attributes M3: Dependencies F1: Symptom reporting function F2: Symptom prediagnosis F3: Plausibility checks F4: Change of reports S1: Learning capability S2: Early matching S3: Multiple root causes S4: Testing E1: Impact and recovery management E2: Service management
Fulfillment and remark ++ (no specific assumptions) ++ (algorithm and modeling design) + (correlation information maintenance) ++ (UML activity diagrams) ++ (support for workflow where possible) ++ (refinement of eTOM, clear layers) + (assessment metrics discussed) ++ (services and resources) + (links to events) ++ (emphasis on dependency model) ++ (CSM/ IA decision tree) ++ (part of IA decision tree) + (part of IA decision tree) + (CSM) ++ (case-based reasoning module) ++ (correlation using service layer dependencies) ++ (allowed in algorithm) ++ (active monitoring, permanent and on demand) ++ (extensibility possible) + (extensibility possible)
Table 4.2: Comparison with requirements
Assessment table Table 4.2 summarizes the achievements of this chapter with respect to the requirements. The fulfillment is different according to the details that have been provided for a solution.
4.10
Summary
In this chapter a framework for the so called service-oriented event correlation has been developed based on the idea to treat service symptoms as events. After the refinement of requirements with respect to the use of correlation techniques, a workflow has been specified. This workflow can be regarded as a further level of detail in comparison to process management frameworks being applied today, in particular to eTOM.
181
workflow development
Chapter 4. Framework for Service-Oriented Event Correlation framework including event correlation components
Based on the workflow design, components could be identified for carrying out some of the workflow steps. It turned out that a tool support for input and output components can be realized by using existing tools (resource level, Intelligent Assistant) or by applying research approaches (CSM, QoS probing and measurement, Service MIB). However, a new design for the service fault diagnosis component became necessary which has then been addressed in detail. Following a motivation of the hybrid architecture, a correlation procedure has been developed in a step-by-step development.
information model
A class structure of the information that is needed for the framework has been derived afterwards, specifying services, resources, dependencies, events, rules, and cases. Finally, some considerations have been made for monitoring the operation of the correlation and for building a joint framework for fault diagnosis and impact analysis.
182
Chapter 5 Adaptation Guidelines for Service Providers
Contents 5.1
Planning . . . . . . . . . . . . . . . . . . . . . . . . . . 183
5.2
Implementation . . . . . . . . . . . . . . . . . . . . . . 185
5.3
Ongoing Maintenance and Optimization . . . . . . . . 190
5.4
Withdrawal . . . . . . . . . . . . . . . . . . . . . . . . . 190
5.5
Summary . . . . . . . . . . . . . . . . . . . . . . . . . . 191
After the development of the framework for service-oriented event correlation, guidelines for applying it to the actual situation of a service provider are addressed in this chapter. By performing the steps presented in the following, the provider shall be able to conduct the adaptation on his own. The guidelines are applicable for services which are already offered or can be carried out in parallel to the deployment of new services.
chapter motivation
Service-oriented event correlation can be divided into the service life cycle phases similar to the service itself. These phases together with the steps inside the phases are depicted in Fig. 5.1 and are explained in this chapter. As a consequence, the chapter is structured along the service life cycle (planning, implementation, usage, and withdrawal).
alignment with service life cycle
Due to the variety of scenarios for which the guidelines shall be applicable, it is often not possible to go into further details as this would lead to making assumptions about the given scenario. This means that a high-level description similar to ITIL is given. However, the steps are detailed for the LRZ services in the next chapter.
abstraction level similar to ITIL
5.1
Planning
In the planning phase it has to be decided whether a service-oriented event correlation should be introduced for offered services. This decision should be 183
Chapter 5. Adaptation Guidelines for Service Providers life cycle phases
adaptation steps
planning
identification of services
implementation
dependency identification event definition
case−based reasoner implementation
rule−based reasoner implementation
CSM implementation
resource management collaboration
provider’s self− monitoring
organizational changes
usage
process optimization
routine changes
withdrawal withdrawal
Figure 5.1: Service-oriented event correlation life cycle (arrows indicate the dependencies between the steps)
based on the criteria described in the following. benefit: SLA violation prevention
As the aim of the correlation is to minimize the resolution time of user reports, the service-oriented event correlation is especially relevant to services where time critical SLAs have been agreed. Therefore, the potential cost saving benefit with respect to SLA violation cost prevention has to be estimated. For services already being offered the actually paid penalties can be taken into account, while estimates based on other services with similar characteristics should be made for new services. Influence factors for the estimated SLA penalty costs are the number of customers, the agreed QoS parameter values, past values for the actually achieved QoS parameter values, and penalty amounts.
benefit: effort reduction
The second aim of the service-oriented event correlation is the effort reduction for the provider by processing related customer reports in an aggregated way. Therefore, the benefit of the approach will be high if the provider receives 184
5.2. Implementation many reports concerning the same root causes. For estimating the benefit achieved here the influence factors such as number of overall events, number of related events, time gained per average event when early processed, and value of time saved have to be taken into account. The benefits of the service-oriented event correlation have to be seen in relationship to the costs. For the judgment of costs a distinction has to be made between initial costs and maintenance effort. The initial efforts include the identification and modeling of dependencies, selection and installation of event correlation tools, and staff training. The maintenance effort is especially dependent on the effort for maintaining the rule base and case base. The overall cost expectation results from estimations which have to be made for the steps in the implementation and usage phases.
drawback: cost factors
The considerations should not be based on the current situation only, but should be made with a mid-term perspective. For example, an increasing competition in the market might require an optimization of service quality and therefore favor the introduction of a more automated service fault management. Changes in the infrastructure or the outsourcing of services or subservices to third-party providers can also influence the decisions.
influence of trends
Many organizations are today considering to simplify the way services are implemented by reducing the heterogeneity of the hardware and software which have been deployed. The aim might be to reduce the number of hardware vendors or to select only a few supported operating systems. This simplification is another important trend which makes it easier to model the dependencies accurately and is therefore helpful to improve the fault diagnosis. Furthermore, it is preferable to select providers with respect to their information policy about service quality degradations so that this information can be integrated in the fault diagnosis.
streamlining trend
In parallel to the introduction of the service-oriented event correlation, it should also be considered to introduce an automated impact and recovery analysis (compare Section 4.8). It can be expected that this introduction is usually also beneficial if a service-oriented event correlation is introduced since some prerequisites especially the realization of the Service MIB with the identified dependencies is already required for service-oriented event correlation.
parallel introduction of impact analysis recommended
5.2
Implementation
After a decision has been made to introduce event correlation for one or more services, several steps have to be carried out for the implementation of service-oriented event correlation (compare implementation phases decomposition in Figure 5.1). The event correlation workflow which has been developed in Section 4.3 has to be integrated into the workflow management of the organization. For its im185
workflow implementation
Chapter 5. Adaptation Guidelines for Service Providers plementation, components (see Section 4.4) have to be selected for the event correlation framework after the identification of dependencies and the definition of events.
distributed dependency knowledge
Dependency identification and documentation For the identification of dependencies as needed for the correlation several sources can be used. The usual situation in many organizations is that the knowledge about the dependencies is kept in several locations. There might be network management tools which store the network topology, configuration files contain information about the internal dependencies within hardware components, and repositories may exist which contain the SLAs. Other dependencies may only partly be documented and only well-known to experts which is often the case on the service level.
methods for dependency identification and maintenance
Therefore, different methods have to be applied to find and transform the dependency knowledge into the Service MIB and repositories for the resource level. Some information just needs to be extracted and transferred into the Service MIB, while automated methods (compare Section 3.2.2) can be applied to find dependencies which have been unknown before. In other situations experts are required to provide their knowledge to the Service MIB and to document changes accordingly. At this stage it is recommended to introduce Change Management and Configuration Management processes according to ITIL guidelines in order to ensure that information is not only provided once, but also that changes are continuously documented. This is also useful to improve the information management within the organization as standardized information is now being used as the basis for these processes.
selecting the modeling granularity
Important trade-offs have to be made for selecting the granularity of dependencies for which the effort for modeling and maintenance has to be set in context with the improved diagnosis results.
service functionalities as basis for dependencies
According to the information modeling, dependencies can be related to services or (more fine grained) to service functionalities. For example, the dependency on a storage service can be refined to a dependency on a specific functionality. Therefore, a partial failure of the service which does not affect the functionality can then not be the root cause of symptoms related to the dependency.
intermediate services
Decisions also have to be made whether an abstraction is reasonable to model a set of resources as a service. For example, there can be file systems and databases used by a higher-level service. These components can be regarded as resources of the higher-level service or a subservice “Storage Service” can be defined which acts as a wrapper around the resources. The latter abstraction can be useful for change management when changes in the realization of the data storage (e.g. new file system, new kind of hardware) do not affect the service functionality.
end system modeling
Another issue is the modeling of end systems. A server could be regarded as a single entity or be split up into CPU, main memory, hard drives, software 186
5.2. Implementation modules, application processes, etc together with their characteristics and dependencies. Such information may be gained automatically from the operating system or from vendor-dependent models. It can be helpful to pinpoint to a specific component of an end system and therefore allow for a timely fault repair.
Definition of events for services and resources Based on the considerations in Section 4.5.3 service events and performance-related resource events have to be defined. This means that is has to be considered on the service level which kind of symptoms could be reported from users and to design service events accordingly.
service events
Another point is the definition of additional events on the resource level which are required for the service quality guarantees contained in SLAs. In particular, threshold events have to be defined concerning execution times, bandwidth utilization, etc related to the dependencies that have been specified before. Furthermore, the events which have already been defined by device vendors should be applied for correlation on the resource level.
additional resource level events
Rule-based reasoner implementation By using the dependencies which have been identified, the rule set for the rule-based reasoner has to be derived. This derivation from the dependency modeling should be done in an automated manner. The idea is to predefine the rule types according to Section 4.6.3 and to specify the concrete rules accordingly. If such a mechanism exists, dependency changes need to be reported only to the dependency modeling (Service MIB) where an updated rule set can be automatically determined. Otherwise, the rule set needs to be edited by hand which can lead to maintenance problems such as unforeseen rule interactions. The same mechanism should not only be applied to the Service MIB, but also to repositories for managing the resource-related information.
rule derivation from dependencies
For the correlation engine it has to be decided which kind of rule-based reasoning software can be adapted for the purpose of the provider. As the analysis in Section 3.4.2 shows, the tools which are currently offered are designed for correlation on the resource level so that some kind of extension seems necessary.
selection of rule-based reasoner
The rules on the service level have to match to the definition of events. This means that it is reasonable to check whether appropriate rules exist to process the service events defined earlier. This check may result in the need to update the definition of rules or events.
checking the compliance of rules and events
The rules have to take care of time conditions, i.e. the validity times of events and the escalation times. The latter ones specify the use of the case-based reasoning module and have to be set with respect to the SLA conditions.
time conditions
187
Chapter 5. Adaptation Guidelines for Service Providers Case-based reasoner implementation In addition to the rule definition, the case structure has to be defined which has to correspond to the service event definition and should be done according to the case template in Section 4.6.4. initial installation of case database
A simple methodology for initializing the case database would be to start with an empty database and wait until it is filled with current events. A more sophisticated method is to derive a set of representative cases from assumed failures. This can be done in a way that for assumed resource failures the impact is determined and that resulting service events form the input for the cases. These cases are then useful to find an adaptation of a prior solution and are better than to start without such knowledge.
tool support
At this point again a decision has to be made about the tool support for this step. While several tools are available for rule-based reasoning which have been designed for network and systems management, case-based reasoning is used seldom in this application area (compare Section 3.4.4). Therefore, it has to be decided whether a generic case-based reasoning tool should be adapted or whether a management tool should be extended towards this capability.
CSM interface implementation
Customer Service Management implementation For the exchange of management information with the user/customer an interface should be designed with the aim to get service events useful as input for the event correlation. For doing so, existing tools which may be applied for SLA reporting before could be extended. The online tool should be as user friendly as possible to prevent that many users still send reports by e-mail which usually contain too few information and require additional requests from the provider. Another aim of the interface design should be to determine beforehand whether it is a user mistake, a mistake of a third-party or really in the responsibility of the provider for which appropriate decision trees are needed which have to include automated tests. These tests are an important means to ensure the quality of information reported. In addition, the telephone support of the provider should be prepared to fill out such forms as well. The same consideration holds when a face-to-face service desk is provided.
CSM interfaces of subproviders
CSM interfaces should also be demanded from third-party providers which offer subservices. They should be used to report symptoms whose causes can be located in the subservices and to get fault and maintenance information from the subproviders. The provisioning of these interfaces has to be agreed as part of SLAs with these subproviders.
Collaboration with resource management In many organizations management systems are already in place for network and systems management. These management systems often contain an event correlation component which can be used for the correlation on the resource level. Such a management system has to be extended for additional events on the resource level, their (active and passive) monitoring and also for the export of resource events to the service-oriented event correlation. 188
5.2. Implementation Provider’s own service monitoring To notice a service malfunction prior to the users, the provider’s own service monitoring has to be installed. Typical transactions of users need to be estimated or derived from real user traffic.
identification of typical interactions
Then, a schedule has to be set up to test the offered functionalities which has to be configured with respect to the QoS parameters and their importance for the SLAs. The same has to be done on the resource level for regular resource tests taking into account the QoR parameters and their relation to the QoS parameters.
testing of services and resources on a regular basis
While events which are derived from user reports usually only denote negative events (something does not work), the majority of the tests performed by the active probing can be presumed to show that a functionality is working properly which can be denoted as a positive event. Even though negative events from the provider’s own service monitoring should be forwarded to the correlation engine in any case, there is a trade-off how many of the positive events should be transferred to the correlation engine. Some of these events are helpful to reduce the number of possible root causes and therefore are useful to accelerate the problem resolution. Too many positive events will in contrary lead to a slowdown of the event correlation process. Furthermore, the policy of the correlation engine may not accept previously reported positive events because these may no longer show the actual situation when a new symptom is going to be examined.
positive/negative events
The service monitoring at the service access point should not only be used for services which are offered to customers, but also for subservices. This means to test own subservices at their SAP as well as services from thirdparty providers. While the test of own subservices is used as input for the own service fault diagnosis, the third-party subservice symptoms are used to send reports via the corresponding CSM.
testing of subservices
The monitoring also needs to have its own monitoring according to Section 4.7. This means that statistics about the events including their severity and resolution time, the percentage of successful correlation, number of modeling changes (due to wrong modeling and due to updates), and the overall resolution time including the case-based reasoning module have to be collected.
monitoring the event correlation
Organizational changes An important point which can however not be addressed with computer science methods are the changes which are needed within the organization. For example, new tools are installed for serviceoriented event correlation which require staff training. An improved automation of the fault handling may lead to the dedication of employee time to the development of new services. These changes should be seen in correspondence to a general mind shift in organizations towards a service-oriented view. People have to be required to document their knowledge in a standardized way which may be a change from previous routines.
organizational changes out of scope
189
Chapter 5. Adaptation Guidelines for Service Providers
5.3
Ongoing Maintenance and Optimization
In the application of service-oriented event correlation continued changes are required to ensure and improve the effectiveness of the fault diagnosis.
reasons for change
Maintenance operations Changes in the service implementation and service usage require the change of the event correlation in various ways. The configuration of the services and resources may be modified in a way that new resources replace old resources or are being added to the resource configuration. Subservices may be subscribed from different providers and the terms of their use may be updated. New products may be available for rule-based and case-based reasoning and the implementation of the Service MIB can be realized in a different way. In the service usage a service may be increasingly popular so that the requirements for its reliability are also increased. Such changes influence the choice of the modeling depth and the schedule for the service monitoring. Furthermore, the SLA conditions with respect to the QoS parameters may be modified.
change routines
Changes in the service implementation are documented in the Service MIB which are reflected in the rule set using the automated derivation. Concerning the case database the solutions to old cases may not work anymore so that these cases have to be updated or at least marked. The detection of inaccurate modeling in the case-based reasoner during fault diagnosis use leads to updates of the Service MIB. Changes in the service implementation may also affect the CSM when new kinds of events can be reported as well as the service and resource monitoring. Here, new kinds of QoS parameters may have to be measured or the thresholds for sending events can be adapted.
optimization w.r.t. to metrics
Optimization In addition to the previously described routine changes, there are also changes to optimize the fault diagnosis. For example, the modeling depth of dependencies can be optimized with respect to the experiences gained (e.g. whether events are received for certain predefined categories). Furthermore, events can be added or removed on the service and resource level, and the monitoring of services and resources can be improved. These optimizations should be done with respect to the considerations made in Section 4.7 (assessment metrics).
5.4
Withdrawal
Finally, there is also the possibility to remove the service-oriented event correlation. Reasons for this could be that the underlying service is not offered 190
5.5. Summary anymore or that it has too few customers so that the maintenance effort has become too high.
5.5
Summary
The presentation of the methodology for applying service-oriented event correlation was aligned to the service life cycle phases. In the planning phase a general decision has to be made for which services service-oriented event correlation should be introduced which is mainly beneficial for services with many events and important SLAs. The implementation phase deals with the identification of dependencies and the event definition, but also has to select and configure the framework components. In the usage phase it can be distinguished between the operation and optimization of the event correlation. The withdrawal of service-oriented correlation may be an option if there are changes related to the considerations which have been made in the planning phase.
191
Chapter 6 Application of the Framework to LRZ Services
Contents 6.1
Planning . . . . . . . . . . . . . . . . . . . . . . . . . . 194
6.2
Implementation . . . . . . . . . . . . . . . . . . . . . . 194 6.2.1
Dependency Identification and Documentation . . 195
6.2.2
Definition of Events for Services and Resources . . 212
6.2.3
Rule-Based Reasoner Implementation . . . . . . . 214
6.2.4
Case-Based Reasoner Implementation . . . . . . . 226
6.2.5
Customer Service Management Implementation . . 229
6.2.6
Collaboration with Resource Management . . . . . 233
6.2.7
LRZ’s Own Service Monitoring . . . . . . . . . . 233
6.2.8
Implementation Summary . . . . . . . . . . . . . 235
6.3
Ongoing Maintenance and Optimization . . . . . . . . 236
6.4
Withdrawal . . . . . . . . . . . . . . . . . . . . . . . . . 237
6.5
Summary . . . . . . . . . . . . . . . . . . . . . . . . . . 238
To demonstrate the application of the proposed solution to a real world scenario, it is applied to services provided by the LRZ, in particular to the Web Hosting Service and the E-Mail Service (compare Section 2.2). It is shown how selections of several trade-offs are made in particular for the information modeling and the specification of events. The focus is set on the rulebased reasoner, but also information concerning the case-based reasoner and the generation of service events within the Intelligent Assistant is given. It is shown how the event correlation can be embedded into the existing environment at the LRZ and a proposal to improve the fault management for this provider is developed. The structure of this chapter is the same as in the previous chapter and therefore reflects the service life cycle phases (planning, implementation, usage, withdrawal). 193
chapter motivation
Chapter 6. Application of the Framework to LRZ Services
6.1
Planning
reference to scenario section
Section 2.2 contains some information about the LRZ in general as well as its Web Hosting Service and E-Mail Service. These services have been identified as services for which an automated service fault diagnosis is desirable.
other services suitable for event correlation
Other services for which a service-oriented event correlation could be useful are the basic connectivity services, i.e. the connection to the LRZ via modem or ISDN (however, its usage is decreasing due to DSL), the LRZ wireless access service (in combination with the VPN Service) or the LRZ video conferencing services. These services are interesting because they are offered to a significant number of users and have several typical service symptoms. For the wireless access service typical symptoms include no network connectivity, problems with the different standards, low throughput, no retrieval of private IP addresses, and low availability of the VPN Service or a VPN authentication failure.
less suitable services
Some other services are less suitable for service-oriented event correlation. The supercomputing offers are very much dependent on a single hardware like the SGI Altix 4700 supercomputer. Therefore, this service is basically formed by the provisioning of hardware and its basic software to the users and helping them to run their programs on the hardware. The supercomputer is only used by a limited number of research groups in parallel so that these symptoms will not require an automated correlation. However, this situation may change with the introduction of Grid computing where supercomputing resources are part of a larger Grid and services on the Grid abstract from the underlying resources. The printing of posters at the LRZ is not suitable either because of the limited number of users and the less critical time constraints for this service. However, FAQ pages are very helpful for this service to deal with frequently occurring problems concerning the required input format. In summary, the Web Hosting Service and E-Mail Service have been chosen as examples of the implementation as they are promising candidates for the improvement of the service fault diagnosis by automated methods.
6.2
Implementation
For the prototypical implementation at the LRZ the steps proposed in Section 5.2 have been carried out focusing on the modeling of the dependencies that are found in this real world scenario and on the implementation of the RBR module. They are described in the following. 194
6.2. Implementation
6.2.1 Dependency Identification and Documentation For the identification of dependencies related to the LRZ services different sources have been used. The configuration of the network is documented in HP OpenView NetworkNodeManager which shows the topology of the switch and router hierarchy. The end systems are not documented in this tool for which another tool, the home-grown network documentation (“Netzdoku”) tool, is responsible. It contains a set of Microsoft Visio diagrams for important parts of the configuration and stores information about a part of the servers. The servers of the Web Hosting Service are documented in this repository, but not the servers for the E-Mail Service. For these Linux servers a special kind of configuration management which also includes a performance management component is in place. A further source of information are Microsoft Excel sheets for the mapping of servers to the switches which has been helpful for the E-Mail Service to some extent. Asset management information about components is contained in BMC Remedy ARS (e.g. when components were ordered, what kind of maintenance contracts exist, etc).
different ways of documentation at the LRZ
There is no service specific documentation available so that the details of the implementation of both services had to be requested from the employees being responsible for the services.
no service specific documentation
The knowledge about services could partially be reused from previous diploma theses for which it had been evaluated, too. The work of Dirk Bernsau [Ber04] analyzed parts of the LRZ E-Mail Service and drafted Intelligent Assistant query trees for this service which indirectly include information about the service configuration. The diploma thesis of Cyril Bitterich [Bit05] analyzed the Web Hosting Service as an example service for finding attributes for the Service MIB. The dependency modeling in the diploma thesis of Patricia Marcu [Mar06] gave example dependencies for the Web Hosting and E-Mail Service. Additional interviews with the employees running these services have been made to find out more details.
sources for the dependency identification
Dependency identification for the Web Hosting Service In Section 2.2.1 the dependencies of the Web Hosting Service on subservices and resources have already been briefly mentioned. In the following a more detailed view is given.
reference to requirements chapter
The resources for the Web Hosting Service are located in the so called computer cube which contains a dedicated server floor for hosting different kinds of server machines. The idea of the computer cube, which is a separated part of the new LRZ building in Garching, is to manage the resources in a remote manner (concept of a dark data center) which means that no employees are permanently located in this part of the building. Most management operation should therefore be carried out remotely.
server room
The resource view of the Web Hosting Service in Fig. 6.1 shows the degree of redundancy that has been implemented for the web hosting servers concerning the servers themselves and their network connectivity. With this design, the
resource view of the Web Hosting Service
195
Chapter 6. Application of the Framework to LRZ Services LRZ aims at a high availability of the service. Internet router (csr1−2wr) 10 GBase−SR
10 GBase−SR
switch swm1−2wr
switch swm2−2wr
100BaseT
nm1
1000BaseT 1000BaseT
1000BaseT
SLB slb2
SLB slb1 1000BaseT
1000BaseT
1000BaseT
swk4−2wr
1000BaseT 1000BaseT
1000BaseT
swk3−2wr
swk2−2wr
swk1−2wr
swk17−2wr 100BaseT
1000BaseT 100BaseT
100BaseT 100BaseT
zope1
100BaseT
100BaseT 100BaseT
Oracle MySQL 100BaseT
zope2
100BaseT 100BaseT
100BaseT
100BaseT
... nxspare nx110 nx112
... nx120
nx111 nx113
wsc55 nas intern2 AFS cluster
nx121
Figure 6.1: Resources of the Web Hosting Service Internet router
As shown in this figure, the router csr1-2wr (Cisco Catalyst 6509) is not redundant so that it can be regarded as a single point of failure within the network. However, it should be taken into account that the router internals are also redundant in some parts (two power supplies, two routing engines). The router is connected to the Scientific Network (“Wissenschaftsnetz”, Germany’s national research and education network) with a 10GE link (10 Gigabit/s Ethernet) which connects the LRZ to other universities and research institutions in Germany and via peerings and upstreams to the global Internet. The LRZ, operating its network as an Autonomous System, also has a backup connection to the Internet via a commercial provider which is automatically activated only when needed and has a lower bandwidth.
switches between router and server load balancers
The router is connected to the switches swm1-2wr and swm2-2wr (both HP ProCurve 3448) via 10GE links. These switches themselves are connected to two server load balancers slb1 and slb2 (both f5 networks “Big IP 3400”) via 1GE links which are in place for load balancing the traffic to a set of servers. These servers are dedicated to different kinds of services including the servers for the Web Hosting Service.
server load balancers
The two load balancers are connected to two switches each (swk3-2wr, swk42wr, swk1-2wr, swk2-2wr, all HP ProCurve 2824) via 1GE links which is shown more detailed in Fig. 6.2. Some of the requests from outside are routed to the first load balancer and others are routed to the second one. Each of the load balancers serves as backup for the IP addresses (and ports) being routed by the other one. The swk switches are connected to each other on the back side (1GE) as shown so that the load balancers can communicate 196
6.2. Implementation via three redundant paths (also including the connection via the router) and can monitor each other. For doing so, each server sends a test query every 20 seconds to the other load balancer. In case that three queries to the other one have not succeeded, a load balancer assumes a failure of the other one and requests a routing change from the router. The load balancers are not able to use feedback from the servers for conducting the load balancing so that the load balancing decisions have to be based on local knowledge. Currently, a round-robin schedule is executed for the web hosting servers, but other options (e.g. balancing the number of active connections) can also be selected. To ensure a high level of power supply, separated power networks are used for the redundant components, based on an uninterruptible power supply hierarchy.
Figure 6.2: Server load balancers and switch environment
The web hosting servers are connected to the swk switches via 100 MBit/s links. Each of them is duplicated so that e.g. the odd numbered server nx111 is identical to the even numbered nx110 server (Sun Netra X1). The servers nx110/nx111 and nx120/nx121 are used for Webmail and special services, nx112/nx113 are used for the hosting of the LRZ internal and external pages, and nx114/nx115, nx116/nx117, and nx118/nx119 are used for the web hosting of foreign pages. An additional server called nxspare exists for emergency situations. It is configured to have the highest priority to reply to requests and is running, but is usually not connected. It has to be manually connected in case of severe problems that last for a longer period of time (several hours). As described in [Bit05], there are four configurations for virtual web servers. lrz: static compiled configuration of the LRZ web pages 197
web hosting servers
Chapter 6. Application of the Framework to LRZ Services virt: static compiled for the display of customer web pages spez: not static compiled (using “dynamic shared objects”) for special purpose configurations, in particular the Webmail service and other special database access services ars: static compilation for the requirements of BMC Remedy ARS (located on one of the spez servers) zope servers
Applications that make use of the Zope application can store the relevant parts on the servers zope1 and zope2. An access to these pages is always passed through the nx servers. Currently, an old search functionality (Harvest) is going to be replaced by a new software which will run on another machine (not shown).
data source servers
The data sources for the Web Hosting Service are not behind the server load balancers so that connections to AFS, NFS, Oracle database, and MySQL database have to be passed through the load balancers the other way. AFS is responsible for storing the static part of web pages and is also used for the authentication of users. It consists of a cluster of three file servers and three database servers. The NFS contains dynamic CGI scripts which can access the Oracle and MySQL databases and also contains data about PHP sessions which are in particular relevant for the Webmail functionality. All the data source servers are connected to other swk switches which are connected to the swm1-2wr and swm2-2wr switches. The data sources and their functionality manage the storage of data for the Web Hosting Service which allows to regard them as a “Storage Service”. This abstraction is used in the following. The same applies to the DNS and firewall servers which are used for the equally named subservices of the Web Hosting Service.
statistics for finding modeling trade-off
Trouble tickets and quick ticket statistics for the Web Hosting Service The modeling of dependencies has to find a trade-off between the modeling effort and the improvement of the diagnosis. An important criterion is the frequency of symptom reports related to a service or its service functionalities. At the LRZ such statistics can be retrieved from the history in BMC Remedy ARS. They can also be found in the LRZ annual report [LRZ06].
trouble ticket statistics
For the statistics several remarks have to be considered. The TTs are sorted according to the root cause category they finally belonged to. As a consequence, not only those TTs for the service itself have to be considered, but also the ones which have been categorized to belong to a subservice. In addition to the TTs, the number of QTs is given. This number can serve as an indicator of user difficulties in using the service. On average approximately two times as much as QTs are encountered than TTs (there may be even more user queries that have not been documented appropriately).
Web Hosting Service tickets
In Table 6.1 the TTs for the Web Hosting Service are given, while the QTs are given in Table 6.2. For these, the categories “other”, “virtual servers”, 198
6.2. Implementation
Web Hosting Service TTs Other Virtual servers Webmail Webserver (LRZ)
2004 17 6 (Oct - Dec) 7 (Oct - Dec) 31
2005 11 18 16 10
2006 (ex Dec) 11 33 18 9
Table 6.1: Trouble tickets for the Web Hosting Service
Web Hosting Service QTs Other Virtual servers Webmail Webserver (LRZ)
2004 (Dec only) 0 1 1 2
2005 19 45 27 24
2006 (ex Dec) 23 35 10 4
Table 6.2: Quick tickets for the Web Hosting Service
Subservice TTs Throughput Connectivity Name server Remote access (SSH) File transfer (ftp, SSH) VPN
2004 4 135 12 9 13 111
2005 10 124 16 6 13 128
2006 (ex Dec) 4 137 11 2 8 196
Table 6.3: Trouble tickets for subservices
Subservice QTs Throughput Connectivity Name server Remote access (SSH) File transfer (ftp, SSH) VPN
2004 (Dec only) 0 11 1 3 2 17
2005 2 187 25 13 20 570
2006 (ex Dec) 0 96 6 3 7 257
Table 6.4: Quick tickets for subservices
199
Chapter 6. Application of the Framework to LRZ Services “webmail” and “webserver (LRZ)” (LRZ’s own pages) are defined. The categorization seems to be suitable since a comparable number of tickets exists. subservice tickets
In Table 6.3 and Table 6.4 the tickets for the subservices are given. There have been many symptoms related to the network connectivity and for using the VPN Service where the latter symptoms usually refer to the use of the wireless network. Issues related to the name servers, remote access or file transfer are seldom. There exist no subcategories for the Connectivity Service and the VPN Service, but these would be very helpful to know where the issues are related to.
formalized dependency modeling
Dependency modeling for the Web Hosting Service Resulting from the service dependency description given in prose, a formalized information model has to be provided according to the modeling in Section 4.6. At first, the dependencies for the QoS/QoR parameter “availability” are given followed by dependencies for the “delay” QoS parameter and related QoR parameters. Availability:QoSParameter WebHostingService:Service
:InterServiceDependency AvailabilityInt:QoSParameter :InterServiceDependency
StaticWebPageRetrieval:ServiceFunctionality
:InterServiceDependency
DynamicWebPageRetrieval:ServiceFunctionality AccessToProtectedArea:ServiceFunctionality
Availability:QoSParameter
ChangeWebPage:ServiceFunctionality
Availability:QoSParameter
StorageService:Service
Availability:QoSParameter
FirewallService:Service
Availability:QoSParameter
DNSService:Service
Availability:QoSParameter
:InterServiceDependency :InterServiceDependency
:InterServiceDependency ConnectivityService:Service
Availability:QoSParameter
AuthenticationService:Service
Availability:QoSParameter
:InterServiceDependency
Figure 6.3: Model for the inter-service dependencies of the Web Hosting Service (QoS parameter availability) inter-service dependencies with respect to availability
On the service level the dependencies of the Web Hosting Service on its subservices have to be considered which is done in Fig. 6.3. As there is no redundancy on the service level, the Web Hosting Service is fully dependent on the Storage Service, DNS Service, Firewall Service, and Connectivity Service. For the AFS authentication a dependency is only given if pages should be changed or if their viewing requires AFS authentication. These dependencies are therefore tied to the service functionalities. For the two other functionalities (retrieval of static web pages and retrieval of dynamic web pages) no additional dependencies on subservices in addition to the dependencies for the service as a whole exist. For the dependency on the Storage Service it has been decided not to detail the functionalities of that service although it is possible to distinguish between the storage of static and dynamic web pages. In 200
6.2. Implementation general, subservices can depend on further subservices which is not shown in the figure above. An important dependency is that the Connectivity Service is dependent on the VPN Service when mobile users want to access the hosted web pages. WebHostingService:Service WebHostingServiceWithZope:Service
AvailabilityInt:QoSParameter AvailabilityInt:QoSParameter :ServiceResourceDependency
csr1−2wr:Resource
Availability:QoRParameter
swm1−2wr:Resource
Availability:QoRParameter
swm2−2wr:Resource
Availability:QoRParameter
slb1−2wr:Resource
Availability:QoRParameter
slb2−2wr:Resource
Availability:QoRParameter
swk4−2wr:Resource
Availability:QoRParameter
swk1−2wr:Resource
Availability:QoRParameter
nx114:Resource
Availability:QoRParameter
nx115:Resource
Availability:QoRParameter
:ServiceResourceDependency
nx116:Resource
Availability:QoRParameter
:ServiceResourceDependency
nx117:Resource
Availability:QoRParameter
:ServiceResourceDependency :ServiceResourceDependency :CompositeServiceResourceDependency :ServiceResourceDependency :ServiceResourceDependency :CompositeServiceResourceDependency :ServiceResourceDependency :ServiceResourceDependency :CompositeServiceResourceDependency :ServiceResourceDependency :ServiceResourceDependency
:ServiceResourceDependency :ServiceResourceDependency
nx118:Resource
Availability:QoRParameter
:CompositeServiceResourceDependency
nx119:Resource
Availability:QoRParameter
:ServiceResourceDependency
swk3−2wr:Resource
Availability:QoRParameter
:ServiceResourceDependency :CompositeServiceResourceDependency
swk2−2wr:Resource
Availability:QoRParameter
zope1:Resource
Availability:QoRParameter
zope2:Resource
Availability:QoRParameter
:ServiceResourceDependency :ServiceResourceDependency :CompositeServiceResourceDependency
Figure 6.4: Model for the service-resource dependencies of the Web Hosting Service (QoS parameter availability)
The dependency on the availability of resources is modeled with a dependency on a QoS parameter called “availability internal”. It serves as the basis for the service-resource dependencies that are shown in Fig. 6.4. The service is fully dependent on the router csr1-2wr which allows to denote this as isolated dependency. At least one of the swm switches has to be working so that a composition of the dependencies on these switches is needed. The service also requires at least one working server load balancer which means that the dependencies on them are also composed. At this point, it can be argued that a further composition of dependencies is needed because it makes a difference whether the directly linked swm1-2wr and slb1 fail or the not linked swm1-2wr and slb2 fail which is not considered in the modeling yet. However, the interconnections are regarded as part of the Connectivity Service and 201
serviceresource dependencies with respect to availability
Chapter 6. Application of the Framework to LRZ Services WebHostingService:Service
DelayInt:QoSParameter
Availability:QoSParameter
:InterServiceDependency
StaticWebPageRetrieval:ServiceFunctionality Delay:QoSParameter
Availability:QoSParameter
:InterServiceDependency
:InterServiceDependency
DynamicWebPageRetrieval:ServiceFunctionality Delay:QoSParameter
Availability:QoSParameter
:InterServiceDependency
:InterServiceDependency
AccessToProtectedArea:ServiceFunctionality Delay:QoSParameter
Availability:QoSParameter
:InterServiceDependency
:InterServiceDependency
ChangeWebPage:ServiceFunctionality Delay:QoSParameter
:InterServiceDependency :InterServiceDependency :InterServiceDependency :InterServiceDependency :InterServiceDependency
StorageService:Service
Delay:QoSParameter :InterServiceDependency :InterServiceDependency :InterServiceDependency :InterServiceDependency
FirewallService:Service
Delay:QoSParameter :InterServiceDependency :InterServiceDependency :InterServiceDependency :InterServiceDependency
DNSService:Service
Delay:QoSParameter :InterServiceDependency :InterServiceDependency :InterServiceDependency :InterServiceDependency :CompositeInterServiceDependency :CompositeInterServiceDependency
ConnectivityService:Service
Delay:QoSParameter :InterServiceDependency :InterServiceDependency :CompositeInterServiceDependency :CompositeInterServiceDependency
AuthenticationService:Service
Delay:QoSParameter
Figure 6.5: Model for the inter-service dependencies of the Web Hosting Service (QoS parameter delay)
are modeled in its resources. The Web Hosting Service has a composite dependency to the switches swk4-2wr and swk1-2wr as well as to the six web hosting servers (when considering only this part of the service which is used for external customers). special service for Zope applications
Some of the hosted web sites depend on Zope, while this is not the case for others. The modeling that has been chosen for this situation is to introduce a special service Web Hosting Service With Zope which offers the same functionalities as the Web Hosting Service. Its inter-service dependencies are quite simple as its availability is based on its internal availability and on the availability of the Web Hosting Service. The service-resource dependencies for 202
6.2. Implementation WebHostingService:Service
DelayInt:QoSParameter
WebHostingServiceWithZope:Service DelayInt:QoSParameter
:CompositeServiceResourceDependency :CompositeServiceResourceDependency :ServiceResourceDependency
csr1−2wr:Resource
ProcTime:QoRParameter
swm1−2wr:Resource
ProcTime:QoRParameter
swm2−2wr:Resource
ProcTime:QoRParameter
slb1−2wr:Resource
ProcTime:QoRParameter
:ServiceResourceDependency :ServiceResourceDependency :CompositeServiceResourceDependency :ServiceResourceDependency
slb2−2wr:Resource
ProcTime:QoRParameter
swk4−2wr:Resource
ProcTime:QoRParameter
swk1−2wr:Resource
ProcTime:QoRParameter
nx114:Resource
ProcTime:QoRParameter
nx115:Resource
ProcTime:QoRParameter
nx116:Resource
ProcTime:QoRParameter
nx117:Resource
ProcTime:QoRParameter
:ServiceResourceDependency :CompositeServiceResourceDependency :ServiceResourceDependency :ServiceResourceDependency :CompositeServiceResourceDependency :ServiceResourceDependency :ServiceResourceDependency :ServiceResourceDependency :ServiceResourceDependency :ServiceResourceDependency :ServiceResourceDependency
nx118:Resource
ProcTime:QoRParameter
:CompositeServiceResourceDependency
nx119:Resource
ProcTime:QoRParameter
:ServiceResourceDependency
swk3−2wr:Resource
ProcTime:QoRParameter
:ServiceResourceDependency :CompositeServiceResourceDependency
swk2−2wr:Resource
ProcTime:QoRParameter
zope1:Resource
ProcTime:QoRParameter
:ServiceResourceDependency :ServiceResourceDependency :CompositeServiceResourceDependency
zope2:Resource
ProcTime:QoRParameter
Figure 6.6: Model for the service-resource dependencies of the Web Hosting Service (QoS parameter delay)
this service indirectly consist of the dependencies of the Web Hosting Service and of additional dependencies for the service. These relate to the switches swk2-2wr and swk3-2wr as well as to the two zope servers. This relationship is also contained in Fig. 6.4. The modeling that has been provided until this point has been related to the QoS parameter “availability” only. However, the situation gets more complicated for the QoS parameter “delay” for which a differentiation with respect to the service functionalities is performed (see Fig. 6.5). The reason for this is that the overall delay for a service functionality is a result of the delays that are encountered in the processing in the subservices. Depending on the SLA conditions and the delays which are usually witnessed, different QoS thresholds may be specified per subservice. For example, the delivery of dynamic web pages by the Storage Service may usually take longer than for static web pages so that different thresholds can be specified for the detection of anomalies. In addition, there are also dependencies on the availability because the delay conditions are also violated for unavailable functionalities. It should be noted that the composition does not express redundancy here, but highlights 203
inter-service dependencies with respect to delay
Chapter 6. Application of the Framework to LRZ Services the need to set QoS parameters in context to each other. serviceresource dependencies with respect to delay
The delay values of each functionality are dependent on the availability, but also on an internal delay which results from the internal processing. It depends on the processing time along the resources for which a similar composition as for the availability is applied (see Fig. 6.6). To denote that the overall delay is modeled as a result of the processing times, an additional composite dependency is given. For the Web Hosting Service With Zope this composite dependency is again composed to the processing times of the additional Zope elements. It has to be emphasized that the compositions are not performed to serve as the basis to calculate the actual delay values, but only to track the effect when processing time threshold violations occur. As referenced in the related work section, a lot of work already went into CIM e.g. to model the topologies of networks. Therefore, the discussion here will not explicitly deal with dependencies on the resource level.
reference to requirements chapter
Dependency identification for the E-Mail Service Based on the information that has already been given in Section 2.2.2, some more details are provided for the E-Mail Service. A resource view of the E-Mail Service is presented in Fig. 6.7 which is explained in the following.
no load balancing
Unlike the Web Hosting Service, the servers for the E-Mail Service are not placed behind load balancers even though an increased level of redundancy could be reached with a similar configuration. However, the amount of traffic that is related to the E-Mail Service is significantly higher than the capability of the load balancers. Internet router (csr1−2wr) 10 GBase−SR
10 GBase−SR
swm1−2wr
swm2−2wr
100Base−T
nm1 1000Base−T
1000Base−T 1000Base−T 1000Base−T
1000Base−T
swk10−2wr
swk9−2wr
swk15−2wr
swk14−2wr 100Base−T 100Base−T 100Base−T
100Base−T 100Base−T 100Base−T
100Base−T
... lxmhs01 lxmhs03 100Base−T
... lxmhs29
100Base−T
lxmhs02 lxmhs04
lxmhs30
ldpsrv01 ldpsrv02 studlmu
100Base−T
Figure 6.7: Resources of the E-Mail Service
204
major domo
extern alumni
6.2. Implementation The servers for the E-Mail Service are behind four swk switches. Each server is duplicated with another server similar to the Web Hosting Service and connected to two switches. There are different redundancy configurations as will be explained in the following.
two switch layers
The virtual server “mailout” for sending e-mails is located on the servers lxmhs01 and lxmhs02. Two IP addresses representing the two servers are stored in the Mail Exchange Resource Record (MX record) so that no redundancy is achieved. This is a consequence of the protocol mechanism which returns one or the other address in a round-robin manner so that a user may be affected by a server failure depending on the address having been provided before.
outgoing mail servers
The virtual servers “mailrelay1” till “mailrelay7” which are responsible for forwarding e-mails to the server being the next destination are also mapped onto lxmhs01 and lxmhs02 in this case using the redundancy provided by MX records. The retrieval of MX records for a domain like the LMU (nslookup -q=MX lmu.de) results in replying with two mail relay addresses (which are then not mapped to the same real server) and a priority for each of them. This priority determines how often queries should be posed to the respective server. The servers lxmhs03 and lxahms04 serve as test systems for the mail relaying (e.g. tests of Spam handling).
mail forwarding servers
The servers lxmhs05/lxmhs06 are in use for Spam classification using the tools AMaViS and SpamAssassin. While the servers lxmhs07/08 and lxmhs13/14 are used as test systems (in particular for the Syntegra mail software), the servers lxmhs09/10 and lxmhs11/12 are used as mail servers for TUM’s (Technische Universit¨at M¨unchen) Physics Department and for the incoming mail (virtual name “mailin”), respectively. For these servers a special Ethernet link is established which is needed for the mutual monitoring using a special high availability (HA) software. The so called active/passive coupling of the servers uses the second server only as a backup for the first one.
servers for Spam classification and incoming mail
The servers lxmhs15/lxmhs16 serve as LDAP directory for the TUM Physics Department mail servers and for storing the addresses of other mail servers. These servers are both active in a normal situation and a client knows both addresses. If requests to one of the servers fail, the client can send them to the other server which is supported by the usual client software.
mail server addresses
The servers lxmhs17/18 previously served as Spam checking servers, but are now used for testing a new software (“courier”) for the mailin. Lxmhs19/20 are the DNS servers which also take care of blacklists for the mail filtering. These servers also use the HA software, but in an active/active coupling mode. For some requesters one of the servers is the primary contact with the second one as backup, while it is the opposite for others. The active/active coupling also results in an automated activation and deactivation of these servers using the routing protocol which is not the case for the active/passive coupling. The latter requires a manual inclusion of a server which has 205
DNS servers for mail
Chapter 6. Application of the Framework to LRZ Services been deactivated before. virus scanning
The virus scanning currently runs on lxmhs21/lxmhs22, but usually consumes only few CPU and bandwidth resources so that it is aimed to combine it with the Spam scanning on lxmhs05/lxmhs06.
myTUM portal
The servers lxmhs23/lxmhs24 are used as mail servers for the myTUM portal (web interface for TUM students). Authentication data for the students is contained in the servers ldpsrv01 and ldpsrv02. The redundancy of the servers is ensured by the HA software active/passive coupling.
graylisting servers
This coupling is also used for graylisting (a technique where e-mails have to be sent twice before acceptance which in many cases rejects Spam mails being usually sent only once) which is distributed over the lxmhs25/lxmhs26 servers.
test servers
The servers lxmhs27/lxmhs28 and lxmhs29/lxmhs30 are used as test machines. Experiments on these machines aim at improving the Spam recognition and try the use of load balancing for the mailrelay couples so that only a single IP address needs to be provided. In addition to these Linux servers, the Sun Microsystems server “studlmu” contains mailboxes of LMU students and has forwarding information for the lmu.de domain. For mailing lists the Sun server “majordomo” is applied and a combined (Sun) server for external and former TUM students is in place.
e-mail processing and policies
The previous listing of resources did not reflect the interactions that have been established for the e-mail processing. An e-mail that is sent to the LRZ from outside the MWN is stored at the mail relays in the first place where the blacklisting server is contacted to check whether the sender domain has been blacklisted. The mail relay then determines whether graylisting has to be used for the e-mail by contacting the graylisting server. For not trustworthy mail servers the graylisting policy requires that the e-mail is sent for a second time which is very helpful for blocking Spam e-mails. A check of the e-mail size is also carried out by the mail relays limiting the size to 30 MBs. The sender is notified about rejected mails. The other e-mails pass a virus check forbidding the use of directly executable attachments which is only carried out for e-mails with attachment. E-Mails with a forbidden attachment are deleted and the sender is informed accordingly. For all e-mails a Spam check is performed where Spam classification information is added to the e-mail which means that suspicious e-mails are only marked. Depending on the destination addresses the mails are distributed to the mailin, studlmu, and myTUM servers. A simplified version of this process is carried out for e-mails that are coming from inside the MWN. These e-mails are only checked for their size and whether they contain executable attachments.
E-Mail Service tickets
Trouble tickets and quick ticket statistics for the E-Mail Service Similar to the Web Hosting Service, the statistics for the TTs and QTs of the E-Mail 206
6.2. Implementation E-Mail Service TTs User problem Graylisting myTUM mail server Spam/virus filtering
2004 170 0 1 6
2005 83 34 1 7
2006 (ex Dec) 87 11 1 9
Table 6.5: Trouble tickets for the E-Mail Service
E-Mail Service QTs User problem Graylisting myTUM mail server Spam/virus filtering
2004 20 (Dec only) 0 1 3 (Dec only)
2005 198 29 7 21
2006 (ex Dec) 115 4 9 7
Table 6.6: Quick tickets for the E-Mail Service
Service are given in the Tables 6.5 and 6.6. Here, the category “user problem” allows to differentiate when root causes were located on the user side (in particular configuration issues) in opposition to root causes located at the LRZ. The introduction of graylisting in 2005 resulted in several tickets, but there are significantly less in 2006. There are only few tickets for the myTUM mail server so that an explicit modeling of the service may not be needed. Only few tickets are related to the spam/virus filtering. Please refer to Tables 6.3 and 6.4 for tickets related to the subservices since the subservices of the E-Mail Service are the basically the same as for the Web Hosting Service.
Dependency modeling for the E-Mail Service The verbal description of the dependencies identified above forms the basis for the modeling of the dependencies according to the model in Section 4.6. Similar to the Web Hosting Service, the availability is considered at first, followed by a modeling for the delay.
formalized dependency modeling
The inter-service dependencies for the availability are depicted in Fig. 6.8. The functionalities for this service are the receiving and sending of e-mails. The latter is differentiated between sending from inside the MWN and from outside the MWN and from sending to the MWN or to outside the MWN, while it is differentiated for the first functionality whether the e-mails come from inside or outside of the MWN. For the E-Mail Service there is no redundancy on the service level so that isolated dependencies on the Storage Service, Firewall Service, DNS Service, and Connectivity Service exist. As the sending of e-mails within the MWN does not require a special authentication, a dependency on the Authentication Service exists only for the functionalities for receiving e-mails and for sending e-mails from outside the MWN.
inter-service dependencies with respect to availability
207
Chapter 6. Application of the Framework to LRZ Services Webmail:Service
Availability:QoSParameter
:InterServiceDependency :InterServiceDependency
AvailabilityInt:QoSParameter :InterServiceDependency
EMailService:Service Availability:QoSParameter AvailabilityInt:QoSParameter
:InterServiceDependency
ReceiveEMail:ServiceFunctionality Availability:QoSParameter ReceiveEMailSentFromMWN:ServiceFunctionality
AvailabilityInt:QoSParameter
:InterServiceDependency
Availability:QoSParameter
:InterServiceDependency
ReceiveEMailSentFromOutsideMWN:ServiceFunctionality SendEMail:ServiceFunctionality :InterServiceDependency SendEMailFromMWNToMWN:ServiceFunctionality
:InterServiceDependency
SendEMailFromOutsideMWNToMWN:ServiceFunctionality
Availability:QoSParameter
SendEMailFromMWNToOutsideMWN:ServiceFunctionality
Availability:QoSParameter
SendEMailFromOutsideMWNToOusideMWN:ServiceFunctionality
Availability:QoSParameter
:InterServiceDependency
StorageService:Service
Availability:QoSParameter
FirewallService:Service
Availability:QoSParameter
DNSService:Service
Availability:QoSParameter
:InterServiceDependency :InterServiceDependency :InterServiceDependency
ConnectivityService:Service
Availability:QoSParameter
AuthenticationService:Service
Availability:QoSParameter
WebHostingService:Service
Availability:QoSParameter
EMailServiceExternal:Service
Availability:QoSParameter
:InterServiceDependency :InterServiceDependency :InterServiceDependency
Figure 6.8: Model for the inter-service dependencies of the E-Mail Service (QoS parameter availability) QoS parameter “internal availability”
The dependencies on internal resources result in three dependencies on internal availabilities, namely for the E-Mail Service in general, the e-mail reception which requires additional resources, and for the e-mail reception from outside the MWN. The latter also requires special resources in addition to the ones given by the previous dependencies.
WebMail Service
The Webmail access to e-mails is modeled as a separate service which is based on the E-Mail Service and on the Web Hosting Service. It basically has the same functionalities as the E-Mail Service which are provided in an Internet portal hosted like a virtual web server.
external e-mail providers
The LRZ E-Mail Service is dependent on other providers when e-mails are received from outside the MWN and also when e-mails are sent to the outside of the MWN. This is shown via dependencies on an external E-Mail Service which stands for an arbitrary other e-mail service provider (not necessarily the originating sender or final receiver of e-mails have to be taken into account, but mainly the next hops in the mail delivery chain).
remark on the retrieval of e-mails
The retrieval of e-mails can be regarded as just fetching the e-mails stored at the incoming mail server. However, this view is too narrow since it cannot explain why e-mails that the user expects to be in the mail folder have not been delivered yet. Therefore, the resources needed for the processing of incoming mails are modeled as a part of the e-mail retrieval resources.
208
6.2. Implementation EMailService:Service AvailabilityInt:QoSParameter
ReceiveEMail:ServiceFunctionality AvailabilityInt:QoSParameter
ReceiveEMailSentFromOutsideMWN:ServiceFunctionality AvailabilityInt:QoSParameter
:ServiceResourceDependency :ServiceResourceDependency
csr1−2wr:Resource
Availability:QoRParameter
:ServiceResourceDependency :CompositeServiceResourceDependency
swm1−2wr:Resource
Availability:QoRParameter
swm2−2wr:Resource
Availability:QoRParameter
swk9−2wr:Resource
Availability:QoRParameter
swk10−2wr:Resource
Availability:QoRParameter
swk14−2wr:Resource
Availability:QoRParameter
swk15−2wr:Resource
Availability:QoRParameter
:ServiceResourceDependency :ServiceResourceDependency :ServiceResourceDependency :ServiceResourceDependency :CompositeServiceResourceDependency :ServiceResourceDependency :ServiceResourceDependency :CompositeServiceResourceDependency lxmhs01:Resource
Availability:QoRParameter
lxmhs02:Resource
Availability:QoRParameter
:ServiceResourceDependency :ServiceResourceDependency :CompositeServiceResourceDependency
lxmhs05:Resource
Availability:QoRParameter
lxmhs06:Resource
Availability:QoRParameter
lxmhs11:Resource
Availability:QoRParameter
lxmhs12:Resource
Availability:QoRParameter
lxmhs19:Resource
Availability:QoRParameter
:CompositeServiceResourceDependency
lxmhs20:Resource
Availability:QoRParameter
:ServiceResourceDependency
lxmhs21:Resource
Availability:QoRParameter
:ServiceResourceDependency :ServiceResourceDependency :CompositeServiceResourceDependency :ServiceResourceDependency :ServiceResourceDependency
:ServiceResourceDependency :CompositeServiceResourceDependency lxmhs22:Resource
Availability:QoRParameter
lxmhs25:Resource
Availability:QoRParameter
:ServiceResourceDependency :ServiceResourceDependency :CompositeServiceResourceDependency
lxmhs26:Resource
Availability:QoRParameter
Figure 6.9: Model for the service-resource dependencies of the E-Mail Service (QoS parameter availability)
Fig. 6.9 which shows the three internal availability parameters is explained in details in the following. The internal availability of the E-Mail Service is fully dependent on the router csr1-2wr, while there are redundancies for the further resources. This applies to the two swm switches as well as to the four swk switches. As described above, the Linux servers for the E-Mail service always form redundant pairs even though the details of the coupling are sometimes a bit different. The servers lxmhs01/02 are in use for all functionalities of the E-Mail Service which does not hold for the other resources. For the reception of e-mails lxmhs11/12 are used for storing incoming mail, lxmhs19/20 for blacklisting and lxmhs21/22 for virus scanning. The functionality for receiv209
serviceresource dependencies with respect to availability
Chapter 6. Application of the Framework to LRZ Services ing e-mails which are coming from outside the MWN additionally depends on lxmhs05/lxmhs06 (Spam checking) and lxmhs25/26 (graylisting). TUM hardware
A special situation exists for TUM’s Physics Department and also for the myTUM portal where additional server pairs are in use. For these situations a similar modeling as for the Zope applications of the Web Hosting Service is possible. Due to the few issues related to this potential service, an explicit modeling is not performed here.
inter-service dependencies with respect to delay
For delay-related inter-service dependencies of the E-Mail Service the situation is similar to the modeling of this parameter for the Web Hosting Service, i.e. delay issues for the subservices also affect the E-Mail Service delay in general and the service is also dependent on the availabilities of the corresponding services or functionalities. Therefore, a figure for this situation is not given.
serviceresource dependencies with respect to delay
In contrast, a new situation is encountered for delay mapping to the resource quality. While the dependencies for the Web Hosting Service of this parameter have been matched to the processing times only, here the mail queue lengths are additionally taken into account. The reason for this is that symptoms in context with the delivery of e-mails are often caused by a queuing of e-mails at the mail relays. As for the availability parameter, Fig. 6.10 is split up for three internal delay parameters. Similar to the Web Hosting Service, no details about the resource dependency modeling are given since this is covered theoretically by CIM and is already in place using a commercial event correlation solution at the LRZ.
formalization in rules
The formalization of the dependencies can be found in the rules encoding (see Appendix B). It does not contain the modeling of composite dependencies since the composition is not required for the pure correlation, but is essential to impact analysis. It has been given here for clarification of the relationships.
further documentation steps
Mid-term considerations for the dependency modeling The documentation of dependencies at the LRZ has to extend the described dependencies for the example services in the following directions. The classes have to be enhanced with attributes as proposed in the information model, e.g. specifying the strength attributes and the test schedule. The dependency classes are until now only related directly to the main services, but they also have to be detailed for the subservices and their functionalities. The same holds for the resource level where a modeling according to CIM recommendations is needed.
templates and tool support
The documentation should be made according to clear guidelines for which template documents should be prepared, in particular templates for describing the service functionalities, who can make use of services, etc. As off-the-shelf tools have limitations with respect to service-related information, the LRZ should investigate possibilities to enhance one of its tools for this purpose and make it mandatory to use this tool for the documentation. A candidate for this enhancement is the Netzdoku tool.
210
6.2. Implementation EMailService:Service DelayInt:QoSParameter
:CompositeServiceResourceDependency
ReceiveEMail:ServiceFunctionality DelayInt:QoSParameter
:CompositeServiceResourceDependency
ReceiveEMailSentFromOutsideMWN:ServiceFunctionality DelayInt:QoSParameter
:CompositeServiceResourceDependency :ServiceResourceDependency :ServiceResourceDependency
csr1−2wr:Resource
ProcTime:QoRParameter
:ServiceResourceDependency :CompositeServiceResourceDependency
swm1−2wr:Resource
ProcTime:QoRParameter
swm2−2wr:Resource
ProcTime:QoRParameter
swk9−2wr:Resource
ProcTime:QoRParameter
swk10−2wr:Resource
ProcTime:QoRParameter
swk14−2wr:Resource
ProcTime:QoRParameter
swk15−2wr:Resource
ProcTime:QoRParameter
:ServiceResourceDependency :ServiceResourceDependency :ServiceResourceDependency :ServiceResourceDependency :CompositeServiceResourceDependency :ServiceResourceDependency :ServiceResourceDependency :CompositeServiceResourceDependency ProcTime:QoRParameter :ServiceResourceDependency
lxmhs01:Resource QueueLength:QoRParameter
:ServiceResourceDependency
ProcTime:QoRParameter
:CompositeServiceResourceDependency
QueueLength:QoRParameter
:ServiceResourceDependency
lxmhs02:Resource
lxmhs05:Resource
ProcTime:QoRParameter
:ServiceResourceDependency :CompositeServiceResourceDependency
lxmhs06:Resource
ProcTime:QoRParameter
lxmhs11:Resource
ProcTime:QoRParameter
:ServiceResourceDependency :ServiceResourceDependency :CompositeServiceResourceDependency
lxmhs12:Resource
ProcTime:QoRParameter
lxmhs19:Resource
ProcTime:QoRParameter
:ServiceResourceDependency :ServiceResourceDependency :CompositeServiceResourceDependency
lxmhs20:Resource
ProcTime:QoRParameter
lxmhs21:Resource
ProcTime:QoRParameter
lxmhs22:Resource
ProcTime:QoRParameter
:CompositeServiceResourceDependency
lxmhs25:Resource
ProcTime:QoRParameter
:ServiceResourceDependency
lxmhs26:Resource
ProcTime:QoRParameter
:ServiceResourceDependency :ServiceResourceDependency
:ServiceResourceDependency :CompositeServiceResourceDependency
Figure 6.10: Model for the service-resource dependencies of the E-Mail Service (QoS parameter delay)
The planned introduction of ITIL makes it necessary to maintain a documentation of services and their resources in any case so that this documentation should not be regarded as additional effort related only to service-oriented event correlation. These changes are going to affect many staff members, but may not require much of the time of each individual. By preventing unforeseen side effects on service implementation changes, improvement of the fault management, etc the expectation is that the time spent and saved is approximately equal, but with achieving an increased service quality. 211
maintenance in the context of ITIL
Chapter 6. Application of the Framework to LRZ Services
6.2.2 Definition of Events for Services and Resources basis for definition of service events
The definition of service events should usually be based on the service functionality specifications in the SLAs. However, as there are no SLAs for the example services, the functionality descriptions are used instead. The definition of the events takes into account typical fault situations, but also allows to report additional information.
resource level events
On the resource level the LRZ is already making use of standard events from HP’s Event Correlation Services. However, it is necessary to specify some additional events with respect to the performance-oriented QoR parameters identified above.
TEC syntax for events
The events are formally specified in the event notation of the Tivoli Enterprise Console (see following section). According to the service event and resource event modeling in Section 4.6.2, three abstract classes are defined which need to be instantiated. These relate to a resource and one of its QoR parameters, to a service and one of its QoS parameters or to a service functionality and its QoS parameters. In the prototypical implementation these fields are combined to the fields resource QoRParam and service func QoSParam. The latter one is used both for the service and a specific service functionality. If the event is related to the service as a whole, “any” is given for the service functionality. ################################################# # Base event classes ################################################# # Resource Events TEC_CLASS: TEC_LRZ_RESOURCE_QOR_EVENT ISA EVENT DEFINES { source: STRING, default = "LRZ resource monitoring"; severity: SEVERITY, default = WARNING; status: STATUS, default = OPEN; date_reception: INT32; resource_QoRParam: STRING; }; END # Service Events TEC_CLASS: TEC_LRZ_SERVICE_QOS_EVENT ISA EVENT DEFINES { source: STRING, default = "LRZ service monitoring"; severity: SEVERITY, default = WARNING; status: STATUS, default = OPEN; date_reception: INT32; date_referring: INT32; service_func_QoSParam: STRING; service_access_point: STRING; valid_to: INT32; description: STRING; keywords: STRING; linked_cause_handles: LIST_OF INTEGER,default = [];
212
6.2. Implementation linked_cause_dates: LIST_OF INT32,default = []; }; END TEC_CLASS: TEC_LRZ_SERVICEFUNC_QOS_EVENT ISA TEC_LRZ_SERVICE_QOS_EVENT END
The base event classes are not applied directly, but derived events are given to indicate whether the service or resource quality is met. At this point it should be noted that there is an option where to put information about a relating MSE. In this specification it has been chosen to define only few event classes and to differentiate the events according to the attribute values. Another option is to specify classes related to the MSE and quality parameter such as TEC LRZ WEBHOSTING AVAILABILITY NOK which is according to the style used in Chapter 4. ################################################# # Event classes for QoS/QoR indication ################################################# # Service QoS "not ok" or "ok" events TEC_CLASS: TEC_LRZ_SERVICE_QOS_NOK ISA TEC_LRZ_SERVICE_QOS_EVENT; END TEC_CLASS: TEC_LRZ_SERVICE_QOS_OK ISA TEC_LRZ_SERVICE_QOS_EVENT DEFINES { severity: SEVERITY,default = HARMLESS; }; END
# Service functionality QoS "not ok" or "ok" events TEC_CLASS: TEC_LRZ_SERVICEFUNC_QOS_NOK ISA TEC_LRZ_SERVICEFUNC_QOS_EVENT; END TEC_CLASS: TEC_LRZ_SERVICEFUNC_QOS_OK ISA TEC_LRZ_SERVICEFUNC_QOS_EVENT DEFINES { severity: SEVERITY,default = HARMLESS; }; END
# Resource QoR "not ok" or "ok" events TEC_CLASS: TEC_LRZ_RESOURCE_QOR_NOK ISA TEC_LRZ_RESOURCE_QOR_EVENT; END TEC_CLASS: TEC_LRZ_RESOURCE_QOR_OK ISA TEC_LRZ_RESOURCE_QOR_EVENT DEFINES {
213
status indicator classes
Chapter 6. Application of the Framework to LRZ Services severity: SEVERITY,default = HARMLESS; }; END
service events
Web Hosting Service The events that are defined for the Web Hosting Service are related to the functionalities and QoS parameters previously specified. This means that there are pairs of positive and negative service events for the parameters as shown in Table 6.7. Apart from the related Web Hosting With Zope Service, events are also specified for the subservices. As an example, details are given for the DNS Service.
resource events
In Table 6.8 the resource events for the Web Hosting Service are given. The availability events are basically the well-known up/down events (corresponding to SNMP traps), while the processing time events are especially defined here.
additional service and resource events related to the E-Mail Service
E-Mail Service The Tables 6.9 and 6.10 contain the events additionally specified for the needs of the E-Mail Service. For the service functionalities of the E-Mail Service a fine grained differentiation is performed so that subfunctionalities are defined for the main categories of e-mail reception and sending. On the resource level the queue length is given as additional QoR parameter due to its importance for the e-mail delivery times.
more events for the subservices
Mid-term considerations for the definition of events Similar to the considerations for the dependency modeling, the modeling of events has to be enhanced towards the detailing of events for the subservices. In addition to the availability and delay QoS parameters, further QoS parameters may be introduced for the automated correlation when they turn out to be useful. Possible examples are available bandwidth for downloads of e-mails and web page content for the example services as well as image and sound quality parameters for videoconference services which have to be mapped to queue lengths and packet loss rates. Nevertheless, the availability and delay are expected to remain the parameters that are most important for the users. The maintenance of the events is closely related to the maintenance of the dependency model due to the (semi-)automated derivation that is proposed.
6.2.3 Rule-Based Reasoner Implementation After the discussion of general possibilities for the implementation of the rule-based reasoning module, the choice of the IBM Tivoli Enterprise Console (TEC) for this purpose is explained. It is extended for the service event correlation rule types needed for the event correlation algorithm (see Section 4.6.3) for which two correlation examples are given at the end of this section.
214
6.2. Implementation Service
WebHosting
WebHostingWithZope Storage Firewall DNS DNSext Connectivity Authentication
Functionality StaticWebPageRetrieval DynamicWebPageRetrieval AccessToProtectedArea ChangePageContent any StaticWebPageRetrieval DynamicWebPageRetrieval AccessToProtectedArea ChangePageContent any any any any any any any
QoSParameters Avail,Delay Avail,Delay Avail,Delay Avail,Delay AvailInt,DelayInt Avail,Delay Avail,Delay Avail,Delay Avail,Delay Avail,Delay Avail,Delay Avail,Delay AvailInt,DelayInt Avail,Delay Avail,Delay Avail,Delay
Table 6.7: Service event categories related to the Web Hosting Service
Resource csr1-2wr swm1-2wr swm2-2wr slb1 slb2 swk1-2wr swk2-2wr swk3-2wr swk4-2wr nx114 nx115 nx116 nx117 nx118 nx119 zope1 zope2 dns1 dns2
QoRParameters Avail,ProcTime Avail,ProcTime Avail,ProcTime Avail,ProcTime Avail,ProcTime Avail,ProcTime Avail,ProcTime Avail,ProcTime Avail,ProcTime Avail,ProcTime Avail,ProcTime Avail,ProcTime Avail,ProcTime Avail,ProcTime Avail,ProcTime Avail,ProcTime Avail,ProcTime Avail,ProcTime Avail,ProcTime
Table 6.8: Resource event categories related to the Web Hosting Service
215
Chapter 6. Application of the Framework to LRZ Services
Service
EMail
WebMail WebMail
Functionality ReceiveEMailSentFromMWN ReceiveEMailSentFromOutsideMWN SendEMailFromMWNToMWN SendEMailFromOutsideMWNToMWN SendEMailFromMWNToOutsideMWN SendEMailFromOutsideMWNToOutsideMWN any ReceiveEMail ReceiveEMailSentFromOutsideMWN ReceiveEMail SendEMail
QoSParameters Avail,Delay Avail,Delay Avail,Delay Avail,Delay Avail,Delay Avail,Delay AvailInt,DelayInt AvailInt,DelayInt AvailInt,DelayInt Avail,Delay Avail,Delay
Table 6.9: Service event categories related to the E-Mail Service
Resource swk9-2wr swk10-2wr swk14-2wr swk15-2wr lxmhs01 lxmhs02 lxmhs05 lxmhs06 lxmhs11 lxmhs12 lxmhs19 lxmhs20 lxmhs21 lxmhs22 lxmhs25 lxmhs26
QoRParameters Avail,ProcTime Avail,ProcTime Avail,ProcTime Avail,ProcTime Avail,ProcTime,QueueLength Avail,ProcTime,QueueLength Avail,ProcTime Avail,ProcTime Avail,ProcTime Avail,ProcTime Avail,ProcTime Avail,ProcTime Avail,ProcTime Avail,ProcTime Avail,ProcTime Avail,ProcTime
Table 6.10: Resource event categories related to the E-Mail Service
216
6.2. Implementation Tool support possibilities evaluation The implementation of the rulebased reasoning module has been carried out with respect to general criteria and specific ones for the LRZ. It would have been preferable to make use of an open source tool to know the details of the reasoning engine (in contrast to commercial products) and to be able to customize these details. However, a practical solution has to take into account the already existing management software basis at the LRZ, i.e. HP OpenView as basis for network management and BMC Remedy ARS for the TTS.
evaluation criteria
For open source tools it has to be distinguished between general RBR tools and specific ones related to network and systems management. JBoss rules [JBo] is an open-source rule engine which is based on improved versions of the Rete algorithm. The system is quite easy to use and can be adapted to different domains. However, the coupling of such a system to the LRZ environment would require the design of several adaptation modules which also holds for other general purpose RBR systems such as Boeing’s NodeBrain [Nod].
open source tools
The Simple Event Correlator (SEC) developed by Risto Vaarandi [Vaa02, SEC] has been an open source system for the purpose of network and systems management. As indicated by the name, it has limitations with respect to the rule types being supported and the possibilities for customization. While a former version can still be retrieved from the author’s home page, the tool has been adopted by HP OpenView NetworkNodeManager [HP b] as an add-on which is called HP OpenView Event Correlation Services [HP a]. This addon has a set of predefined rules which are useful for network management. They are applied at the LRZ in particular for filtering purposes. However, it is difficult to customize these rules for the needs of service-oriented event correlation.
SEC and HP OpenView
The customization of rules within TEC [IBMb] is supported by documents such as a rule developers guide and a rule set reference so that the realization of the designed rule types has been feasible as shown in the next section. Nevertheless, some limitations have to be circumvented and there is a lack of documentation for some parts of the rule predicates. In addition, the installation of the Tivoli management environment has turned out to be more difficult than expected. An important advantage of TEC with a mid-term perspective are the modules which allow for the access to HP OpenView and also to BMC Remedy ARS.
choice of TEC
Details of the Tivoli Enterprise Console In the following more details about TEC whose components are depicted in Fig. 6.11 are given. Its central component, the event server, receives events directly from Event Integration Facilities or from the TEC gateway. Event Integration Facility is a toolkit that allows to construct events for the specific needs of an application. It is designed for adopting TEC to a given environment at the customer’s location, but is also the general source for non-network related events. The TEC gateway is able to perform preprocessing operations (filtering, ordering,
event reporting to TEC
217
Chapter 6. Application of the Framework to LRZ Services Web browser User interface server Event console (Web version)
Event console (Java version)
Websphere Application Server
Event database server Event server
Tivoli NetView component
Prolog rules
State correlation rules
Tivoli NetView component
Tivoli Enterprise Console gateway
Event Integration Facility Event Integration Facility
Network management server Event Integration Facility
SNMP
Event Integration Facility event sources (TME and non−TME)
Figure 6.11: Tivoli Enterprise Console components [IBM03c]
correlation) so that not too many events are transferred to the event server. Network related events are reported from the Tivoli NetView module which is very similar to HP OpenView NetworkNodeManager (they have the same origin). event server correlation actions
The event server is the central correlation facility within a Tivoli environment. Its rules are based on Prolog (logic programming language) and predicates (specified by IBM). At first, the event server logs incoming events which includes a validity check based on the syntax. A buffer is in place to queue events before they can be transferred to the correlator. For each admitted event the correlator tries to find a match with the rule set by checking the condition expressions. The following action can be the correlation to other events (i.e. store a reference to the other event in one event), automatic response such as a script execution, event escalation, modification of the attributes of the current or other events, removal of duplicates, reevaluation of a set of events, removal of the event, generation of additional events, or forward of the event to another server. In addition, events can be delayed which is often useful for intermittent events. More details about the correlation engine can be found in the TEC User’s Guide [IBM03c]. 218
6.2. Implementation TEC uses an external database (RDBMS) for storing the large amount of data usually received. The user interface (UI) server acts as intermediate component between the different user interfaces and the event server to prevent conflicts when different user interfaces would like to access the event correlation data. A Java-based and a web browser-based user interface are offered where the Java version has several additional functionalities such as configuration, NetView access and automated tasks.
data storage and user interfaces
Tivoli Enterprise Console concepts The introduction of service-oriented event correlation requires the additional definition of rules. IBM’s documentation contains a guide for specifying rules [IBM03a], but also contains a reference guide to predefined rules [IBM03b].
documentation for rules specification
Like many other rule-based reasoning tools, TEC implements a single root cause assumption which is made to reduce the number of active events. This means that once a match to an antecedent event is found the dependent event can be removed from the set of active events since it is explained in any case by the antecedent event.
single root cause assumption
An interesting concept is the reactivation of events called redo analysis which aims at improving the handling of time conditions. For example, a rule might denote a dependency between resource resA and resB. This means that a fault in resB results in a symptom for resA for which events for resA and resB are defined accordingly. In case that an event occurs for resA, but none is received for resB, no correlation can be performed. A timeout may then set the event for resA to inactive. Later, an event is received for resB for which no match can be executed directly. At this point a special mechanism is provided to reactivate the event for resA so that a match can be performed.
reactivation of events
For the implementation of rules and events two directories are contained in Tivoli. The directory TEC CLASSES contains the definition of events in *.baroc (Basic Recorder of Objects in C) files. In the standard installation the events from the rule-set reference are already contained in a set of these baroc files. The event classes can form a hierarchy by using the ISA (“is a”) tag which denotes that the current class is a subclass of another one. Default values can be specified for the attributes which is often used for severity attributes. The directory TEC RULES contains rule sets in *.rls (rule set) files. Similar to the TEC CLASSES a set of standard rule files is provided.
event and rule specification files
The definition of rules can happen in two ways. Apart from the specification of rules with a text editor, a graphical editor is provided to define rules using a graphical user interface. However, the possibilities for the specification of correlation rules in the interface are very limited, because the correlation of events can only happen when an equality of attributes can be specified. The graphical editor has therefore not been useful to define the rules needed for the service-oriented event correlation. IBM [ABB+ 04] is working on extending the rule creation to support more typical rules which can then be directly specified with respect to events.
rule specification
219
Chapter 6. Application of the Framework to LRZ Services new rules for service event correlation needed
Realization of rule types in TEC For the realization of the rule-based correlation algorithm (see Section 4.5.2) it is necessary to implement the rule types specified in Section 4.6.3. The aim has been to adopt rules from the rule set reference guide if possible, but to encode new rules where necessary. As explained in [Bey07], the lack of service-orientation is documented by the fact that only the e-business rule set and a supporting rule set can be regarded as related to service management. It is tied to the WebSphere Application Server and DB2 database and contains just two rules, namely WMQ DEPENDS ON WMQ and WAS DEPENDS ON DB2 which can be regarded as inter-service or service-resource dependencies. A generalization of these rules is hardly possible so that new dependency related rules had to be devised. These rules also have to circumvent the single root cause assumption made in the standard TEC rules. The overview of the rule set (an updated version from [Bey07]) is depicted in Fig. 6.12. The complete code for the specified rules which are explained in the following is given in Appendix B.
administrative rules
The rules startup, shutdown, close all are helper rules for managing the overall correlation. They are used for initializing global variables and for opening/closing of log files.
close older events for the same service
The rule duplicate services has been generalized from the implementation in [Bey07]. It is used to close older events that exist for the same service so that only one valid event is given for a service. The rule implements the correlation rules for the same MSE.
correlate rule for top-down correlation
The correlate rule is the central rule in the rule set and is split into a set of actions. It implements the top-down correlation rule using the linking and active probing helper rules. The rule is executed for a quality degradation with respect to a service or service functionality. In the correlate resources action the service-resource dependencies are specified and it can therefore be determined which antecedent resource QoR parameters are given for the input QoS parameter. It is then checked whether events are present for the antecedent resources according to these dependencies. For dependencies where events for the antecedents are given the linking is initiated. In the action check resource restlist active probes are triggered for the remaining dependencies. A similar handling for inter-service dependencies is done in the correlate services and check service restlist actions where the list of dependencies is used to identify the antecedent services and to search for given events. For missing events active probing is requested.
modification of implementation
In comparison to [Bey07] the dependencies in the correlate rule are more fine grained specified as dependencies between the parameters and not the MSEs themselves. In addition, the linking to antecedents is generalized in a sense that it does not only link negative events for antecedents to the current event, but also positive events for the antecedents. The reason for this is that is can be differentiated whether information for the antecedents is given or whether such information is missing. Therefore, it can be tracked whether all antecedents have been examined. 220
6.2. Implementation
rule: startup set global variables, initialize logfile rule: shutdown close logfile rule: close_all helper rule for closing all events rule: duplicate_services correlate older service events to currently valid event rule: correlate action: setup_correlation initialize variables and logging of entry action: correlate_resources specification of cause−effect relationships between services and resources, search for causes, execute correlation reception_action: check_resource_restlist trigger active probing for resources action: exit_resources logging action: correlate_services specification of cause−effect relationships among services, search for causes, execute correlation reception_action: check_service_restlist trigger active probing for services action: exit_services logging action: exit_rule logging
rule: service_handler searches for active probing event related to service event and reactivates previous service event rule: resource_handler searches for active probing event related to resource event and reactivates previous service event rule: linking helper rule for linking cause and effect events rule: active_probing helper rule for the generation of active probing events for resources and services rule: timer_expiration close and forward uncorrelated service events
rule set: lrz_correlation
Figure 6.12: Implemented correlation rule set (updated from [Bey07])
221
Chapter 6. Application of the Framework to LRZ Services reactivation of events for sequence independence
The actions in the correlation rule have been based on the assumption that events for antecedents are already given which may not be the case. Therefore, it is examined in the service handler and resource handler rules whether a current service or resource event is the result of an active probing. The service event that triggered the active probing is then reactivated and is again input for the correlation rule. The correlation rule is reexecuted for this service event so that a linking between the current event and the previous higher level event can be constructed.
helper rules
The linking rule is a helper rule to perform the linking of events. Another helper rule is the active probing rule which splits an active probing request into single probing events.
timer expiration
For service events that have reached the end of their validity the rule timer expiration is in place to forward them to the case-based reasoner (depending on the policy). It implements the timer rules.
Correlation example related to the Web Hosting Service For showing the event correlation based on the rules as described above, an example related to the Web Hosting Service is described in the following. The description refers to Fig. 6.13 where the events are given on a time line. On the left events are shown that are received by the correlation module for which the same notation as in Fig. 4.27 is used. On the right linking and active probing events are shown. Please note that these events are only intermediate helper events which do not require further investigation. For the linking events the dashed lines indicate the two events that have been linked. In Appendix B the correlation log file is given. initial observations from monitoring
The example starts with an unavailability event for the zope1 server which does not lead to further correlation actions, but can be a root cause candidate already. Please note that due to the pure top-down approach affected services, etc are not determined proactively. The usual monitoring of services and resources does also result in positive events such as for the availability of swk2-2wr, Firewall Service, and Connectivity Service.
negative event for Web Hosting With Zope Service and active probing
Then, a service event is received that the retrieval of static web pages for the Web Hosting With Zope Service is not available. In the correlation routine it is at first checked whether valid events for subservices or resources of this service functionality are available which applies to the two service events previously witnessed (Firewall Service and Connectivity Service). An active probing event is therefore issued for the remaining subservices which results in the reporting of results for the performed tests.
negative event for internal availability and correlation
The internal availability of the Web Hosting Service is verified and therefore does not have to be investigated further. This does not hold for the internal availability of the Web Hosting With Zope Service which is linked to the reported unavailability of the static web page retrieval functionality. This failure has to be further investigated again using the correlation rule so that the two resource events witnessed at the start of the example can now be linked to 222
6.2. Implementation event reception
timeline
helper events from rule execution
TEC_LRZ_RESOURCE_QOR_NOK zope1_Avail TEC_LRZ_RESOURCE_QOR_OK swk2−2wr_Avail
TEC_LRZ_SERVICE_QOS_OK Firewall_any_Avail TEC_LRZ_LINKED_EVENT TEC_LRZ_SERVICE_QOS_OK Connectivity_any_Avail
TEC_LRZ_LINKED_EVENT
TEC_LRZ_SERVICEFUNC_QOS_NOK WebHostingWithZope_StaticWebPageRetrieval_Avail
TEC_LRZ_SERVICE_QOS_OK WebHosting_any_AvailInt
TEC_LRZ_ACTIVE_PROBING_EVENT services=[’WebHostingWithZope_any_AvailInt’, ’WebHosting_any_AvailInt’, ’Storage_any_Avail’, ’DNS_any_Avail’] TEC_LRZ_LINKED_EVENT
TEC_LRZ_SERVICE_QOS_NOK WebHostingWithZope_any_AvailInt
TEC_LRZ_LINKED_EVENT TEC_LRZ_LINKED_EVENT TEC_LRZ_LINKED_EVENT TEC_LRZ_ACTIVE_PROBING_EVENT resources=[’swk3−2wr_Avail’, ’zope2_Avail’]
TEC_LRZ_SERVICE_QOS_OK Storage_any_AvailInt TEC_LRZ_SERVICE_QOS_OK DNS_any_AvailInt
TEC_LRZ_LINKED_EVENT TEC_LRZ_LINKED_EVENT
TEC_LRZ_RESOURCE_QOR_OK swk3−2wr_Avail TEC_LRZ_LINKED_EVENT TEC_LRZ_RESOURCE_QOR_OK zope2_Avail
event types
negative
TEC_LRZ_LINKED_EVENT
positive
monitored event event resulting from triggered test
Figure 6.13: Timeline for the Web Hosting Service correlation example
this internal unavailability. Furthermore, the correlation results in an active probing event for the remaining resources. At the end, further test results for the first and second active probing are reported and can be matched to the originating negative events. In summary, the unavailability of the static web page retrieval functionality of the Web Hosting With Zope Service can be explained by the unavailability of the zope1 server. In the example previously witnessed positive events are accepted for the correlation which can lead to failed correlations because a used MSE may no longer be working at the time of the correlation. A different policy is therefore to trigger tests for all antecedents (or maybe not for those where a symptom is already known). An even more sophisticated method would be to accept positive events for antecedents in the first place, but to revalidate them in case 223
observation concerning event validity
Chapter 6. Application of the Framework to LRZ Services the correlation would fail otherwise. Correlation example related to the E-Mail Service A more complicated example is given in the following with respect to the E-Mail Service. The correlation is depicted in Fig. 6.14 and 6.15. It uses the same notation as before and the log file for the example can again be found in Appendix B. The example uses a pure top-down correlation where previously available positive events from the regular monitoring are not accepted. delay symptom and active probing
It starts with an event that indicates that the retrieval of e-mails via the WebMail Service takes longer than expected. An active probing event is therefore issued to test the antecedents. While the functionality is available and also the Web Hosting Service delay does not show symptoms, there are both symptoms for the e-mail reception from inside and outside the MWN.
functionality active probing resulting in internal delay symptom
For both functionalities tests are triggered and it can be seen that there is a large overlap in the subservices that should be tested. As a consequence, it can be concluded that a test scheduling component makes sense to avoid that tests are duplicated. In the following the test results are reported and there is only a symptom for the internal delay of the E-Mail Service which explains both previously detected subservice symptoms.
delay symptom probing and two root cause candidates
The internal delay symptom is further examined with an active probing event for several resources as well as for the internal availability. The queue length for the lxmhs02 server is identified as a root cause candidate, but also the internal availability of the E-Mail Service’s resources is affected by a symptom. It turns out that the lxmhs01 server is unavailable. Some additional positive events are given as examples of the further active probing results (not complete at that point).
discussion of result
In summary, there are two root cause candidates, i.e. the unavailability of lxmhs01 and the long e-mail queue at lxmhs02. Nevertheless, these symptoms may not be completely independent as the unavailability of one server leads to a shift of the complete workload to the other one.
tool support for the rule set
Mid-term considerations for the rule-based reasoner The specification of rules should not happen in a manual way as it has been the case for the prototype, but should be supported by tools. The idea is that the home-grown tool which has to be developed for the maintenance of service-related information has to be enhanced with a rule generation capability.
rule generation operations
Assume that there is a dependency of a service on a resource for a QoS parameter. The tool could then recommend a rule for checking the status of the resource if there are symptoms for the service. Additional rules can be recommended for merging events for the same MSE. The tool design should also allow for an easy support of changes. For example, all rules related to a service that is currently updated should be easily retrievable so that they can be updated. 224
6.2. Implementation
event reception
timeline
helper events from rule execution TEC_LRZ_ACTIVE_PROBING_EVENT services=[’WebMail_ReceiveEMail_Avail, ’EMail_ReceiveEMailSentFromMWN_Delay’, ’EMail_ReceiveEMailSentFromOutsideMWN_Delay’, ’WebHosting_any_Delay’]
TEC_LRZ_SERVICEFUNC_QOS_NOK WebMail_ReceiveEMail_Delay
TEC_LRZ_SERVICEFUNC_QOS_OK WebMail_ReceiveEMail_Avail
TEC_LRZ_LINKED_EVENT TEC_LRZ_LINKED_EVENT
TEC_LRZ_SERVICEFUNC_QOS_NOK EMail_ReceiveEMailSentFromOutsideMWN_Delay TEC_LRZ_SERVICE_QOS_OK WebHosting_any_Delay TEC_LRZ_SERVICEFUNC_QOS_NOK EMail_ReceiveEMailSentFromMWN_Delay TEC_LRZ_SERVICEFUNC_QOS_OK EMail_ReceiveEMailSentFromOutsideMWN_Avail
TEC_LRZ_ACTIVE_PROBING_EVENT services=[’EMail_ReceiveEMailSentFromOutsideMWN_Avail’, ’EMail_any_DelayInt’, ’EMail_ReceiveEMail_DelayInt’, ’EMail_ReceiveEMailSentFromOutsideMWN_DelayInt’, ’Storage_any_Delay’, ’Firewall_any_Delay’, ’DNS_any_Delay’, ’Connectivity_any_Delay’, ’Authentication_any_Delay’, ’EMailExternal_any_Delay’] TEC_LRZ_LINKED_EVENT TEC_LRZ_LINKED_EVENT
TEC_LRZ_SERVICEFUNC_QOS_OK EMail_ReceiveEMailSentFromMWN_Avail TEC_LRZ_SERVICEFUNC_QOS_OK EMail_ReceiveEMail_DelayInt TEC_LRZ_SERVICEFUNC_QOS_OK EMail_ReceiveEMailSentFromOutsideMWN_DelayInt
TEC_LRZ_ACTIVE_PROBING_EVENT services=[’EMail_ReceiveEMailSentFromMWN_Avail’, ’EMail_any_DelayInt’, ’EMail_ReceiveEMail_DelayInt’, ’Storage_any_Delay’, ’Firewall_any_Delay’, ’DNS_any_Delay’, ’Connectivity_any_Delay’, ’Authentication_any_Delay’]
TEC_LRZ_SERVICE_QOS_OK Storage_any_Delay TEC_LRZ_LINKED_EVENT TEC_LRZ_SERVICE_QOS_OK Firewall_any_Delay
TEC_LRZ_LINKED_EVENT TEC_LRZ_LINKED_EVENT
TEC_LRZ_SERVICE_QOS_OK DNS_any_Delay
TEC_LRZ_LINKED_EVENT TEC_LRZ_LINKED_EVENT
TEC_LRZ_SERVICE_QOS_OK Connectivity_any_Delay
TEC_LRZ_LINKED_EVENT TEC_LRZ_LINKED_EVENT
TEC_LRZ_SERVICE_QOS_OK Authentication_any_Delay
TEC_LRZ_LINKED_EVENT TEC_LRZ_LINKED_EVENT
TEC_LRZ_SERVICE_QOS_OK EMailExternal_any_Delay
TEC_LRZ_LINKED_EVENT TEC_LRZ_LINKED_EVENT
TEC_LRZ_SERVICE_QOS_NOK EMail_any_DelayInt
TEC_LRZ_LINKED_EVENT TEC_LRZ_LINKED_EVENT TEC_LRZ_LINKED_EVENT TEC_LRZ_LINKED_EVENT
event types monitored event event resulting from triggered test
negative
positive
TEC_LRZ_LINKED_EVENT TEC_LRZ_LINKED_EVENT TEC_LRZ_LINKED_EVENT
Figure 6.14: Timeline for the E-Mail Service correlation example (beginning)
225
Chapter 6. Application of the Framework to LRZ Services maintenance effort
Since the Tivoli Enterprise Console is an additional component, additional effort will have to be invested for its maintenance. The effort reduction may be more difficult to measure as it will lead to benefits for the service support staff across the organization.
6.2.4 Case-Based Reasoner Implementation data structure focus
The implementation of the case-based reasoning module is not discussed as detailed as for the rule-based reasoning module. The reason for this is that the CBR steps are adopted from the related work so that the focus is set on the data structures.
few CBR tools
Tool support possibilities evaluation Similar to the RBR module, the possibilities for tool support have been examined. Only few open source and commercial CBR tools related to network and systems management exist so that often solutions related to TTS are used. A general open source CBR system is jColibri [jCo], while Empolis Orenge [Emp] is a mighty commercial tool. The tool Weka [Wek] is suitable for the retrieval step, but similar to the others it has to be adapted for the network and service management domain.
choice of BMC Remedy ARS
For the LRZ the recommended way to implement the CBR module is to extent its BMC Remedy ARS [BMCa] installation for which an example screenshot is depicted in Fig. 6.16. It shows the symptom description tab of the trouble ticket where the categorization of tickets according to service and service functionality is performed. In addition, fields for the urgency (low, medium, critical), the responsible person, short and long description of the symptom are contained as well as for potential links to other trouble tickets. In the lower part a set of standard questions is contained which should be asked during symptom recording. The function of BMC Remedy ARS to retrieve related TTs manually with a search function should be enhanced with a key term matching function which has to be based on an update of the TT description fields as described below.
decision based on LRZ environment
An important advantage of BMC Remedy ARS is that it can be coupled with Tivoli. It is possible to generate TTs from Tivoli which can be applied when the automated correlation has failed [IBMc]. Furthermore, it is useful to continue with managing the overall fault management via BMC Remedy ARS which means that service events (coming from the CSM or the monitoring) should be stored in BMC Remedy ARS at first. This has the advantage that functions for their potential escalation and generating processing statistics are already available. The service event correlation should then be initiated by sending the service events to Tivoli which can be implemented with the BMC Remedy Link to Tivoli module [BMCb].
226
6.2. Implementation event reception
timeline
helper events from rule execution TEC_LRZ_ACTIVE_PROBING_EVENT resources=[’csr1−2wr_ProcTime’, ’swm1−2wr_ProcTime’, ’swk9−2wr_ProcTime’, ’swk10−2wr_ProcTime’, ’swm2−2wr_ProcTime’, ’swk14−2wr_ProcTime’, ’swk15−2wr_ProcTime’, ’lxmhs01_ProcTime’, ’lxmhs01_QueueLength’, ’lxmhs02_ProcTime’, ’lxmhs02_QueueLength’] services=[’EMail_any_AvailInt’]
TEC_LRZ_SERVICE_QOS_NOK EMail_any_DelayInt TEC_LRZ_RESOURCE_QOR_OK csr1−2wr_ProcTime TEC_LRZ_RESOURCE_QOR_OK lxmhs01_ProcTime TEC_LRZ_RESOURCE_QOR_NOK lxmhs01_QueueLength
TEC_LRZ_LINKED_EVENT
TEC_LRZ_SERVICE_QOS_NOK EMail_any_AvailInt
TEC_LRZ_LINKED_EVENT TEC_LRZ_LINKED_EVENT
TEC_LRZ_RESOURCE_QOR_OK csr1−2wr_Avail
TEC_LRZ_LINKED_EVENT TEC_LRZ_ACTIVE_PROBING_EVENT resources=[’csr1−2wr_Avail’, ’swm1−2wr_Avail’, ’swk9−2wr_Avail’, ’swk10−2wr_Avail’, ’swm2−2wr_Avail’, ’swk14−2wr_Avail’, ’swk15−2wr_Avail’, ’lxmhs01_Avail’, ’lxmhs02_Avail’]
TEC_LRZ_RESOURCE_QOR_NOK lxmhs02_Avail
TEC_LRZ_RESOURCE_QOR_OK swk9−2wr_Avail TEC_LRZ_RESOURCE_QOR_OK swk9−2wr_ProcTime
TEC_LRZ_LINKED_EVENT
TEC_LRZ_RESOURCE_QOR_OK lxmhs01_Avail
TEC_LRZ_LINKED_EVENT TEC_LRZ_LINKED_EVENT
event types monitored event
negative
positive
TEC_LRZ_LINKED_EVENT TEC_LRZ_LINKED_EVENT
event resulting from triggered test
Figure 6.15: Timeline for the E-Mail Service correlation example (continued)
Figure 6.16: Screenshot from the BMC Remedy ARS installation at the LRZ
227
Chapter 6. Application of the Framework to LRZ Services
WebMail
Service:
ReceiveEMail
Service functionality:
Avail
QoS Parameter: Service access points: webmail.lrz.de Keywords:
connectivity ok
unreachable
browser check
No additional keywords Description: There is an error message displayed when accessing webmail.lrz.de The network connectivity to other sites has been checked and this it is independent from browser or browser cache. Correlated events:
TEC_LRZ_SERVICE_QOS_OK(WebHosting), .
Severity:
MAJOR
Credibility:
Reception date:
11:10:05
Timeout date:
Referring date:
11:01:00
Assigned to: Status:
REPRODUCED 11:11:05
... CLOSED
Solution steps: 11:17:20, Retrieval of cases for Web Hosting Service 11:20:07, Identification of nx servers as potential root causes 11:25:09, Check of nx111 shows unavailability Related cases:
case XY
Figure 6.17: Example of a case related to the WebMail Service
example for missing WebMail resources
Example matching An example illustrating the use of CBR is given in the following. An observant reader may have noticed that the modeling of the WebMail Service is incomplete in the sense that it does not model the servers nx110/nx111 and nx120/121 which are used for the configuration of WebMail. Therefore, a failure within these servers may affect the WebMail Service as a whole. Fig. 6.17 shows how a completed case template (compare Fig. 4.35) may look like.
user symptom report
A user has reported a symptom when trying to access the webpage webmail.lrz.de which serves as the access point for the WebMail Service. The keywords denote that the web browser returned a server unreachable error message, but that the connectivity in general is given to reach other pages and that similar symptoms are given for other web browsers. The service event generated from the symptom report has been correlated to the antecedents, 228
6.2. Implementation but these have shown no symptoms. Nevertheless, the reception of the symptom at the Intelligent Assistant has successfully reproduced the symptom. In the lower part the steps that have been carried out are documented to explain why the case has now the status CLOSED. The use of the case library has identified a match to a previous case where similar symptoms have been witnessed for a hosted web page. For this related case where the same keywords may have applied the reason has been that one of the web hosting servers has been unavailable. The expert at the LRZ may then notice that this could also apply to the special servers being used for the WebMail Service.
processing documentation
As a consequence of this case, the modeling should be updated to include the WebMail servers as resources for the WebMail Service so that a similar symptom report can later be handled by the rule-based reasoning module.
service modeling improvement
Mid-term considerations for the case-based reasoner The implementation of the case-based reasoner should be carried out as improvement of the user interface of the BMC Remedy ARS installation. However, the effort for this is expected not to be too high since the proposed interface only has some additional fields. Furthermore, the commercial tools for building the (bidirectional) link to Tivoli have to be investigated. While the import of Tivoli events into ARS is unlikely to pose severe difficulties, a more detailed examination about the possibilities to realize the escalation policies within ARS has to be performed. Once these mechanisms have been established, the additional maintenance effort should be relatively low.
6.2.5 Customer Service Management Implementa-
tion The PhD theses of Langer [Lan01] and Nerb [Ner01] which provided the concept for the implementation of a CSM have been applied primarily for services of the German Research Network (DFN) where the tool allows for the retrieval of accounting data for subscribed services and shows the network topology including current fault and performance data. The topology display functionality is also provided for the users of the MWN so that this tool can be regarded as a starting point for an overall CSM offer. However, the topology display can only be classified as a partial solution for the fault and performance management of the Connectivity Service and is a pure data display tool.
status of CSM implementation at the LRZ
The development of the IA has been performed separately from the CSM. The tool contains trees for the Connectivity Service and the E-Mail Service because these services lead to many user inquiries.
Intelligent Assistant at the LRZ
Web Hosting Service For the Web Hosting Service the efforts for an automated CSM have been limited to an automation of the server installation.
focus on second line support yet
229
Chapter 6. Application of the Framework to LRZ Services The reason for this in the fault management area is that the LRZ is mostly a second line support from the perspective of end users. For these users it is not obvious that web pages are hosted at the LRZ so that an end user who has difficulties to view the web pages of a research institute will at first try to contact this institute which may be a customer of the Web Hosting Service. In most situations only more difficult problems are reported by the web masters of the Web Hosting Service customers for which an automation has not been regarded as useful yet. Nevertheless, the LRZ may add value to the service when it includes a functionality for automated first level symptom handling.
update of IA decision trees
E-Mail Service The situation is different for the E-Mail Service for which standard processes for the automated configuration management (e.g. new accounts) exist. For the fault management area a major update of the IA decision trees has been performed as part of the work of Dirk Bernsau [Ber04]. The work is based on interviews with the administrators of the E-Mail Service and their usual way of requesting information from users that report symptoms. It also considers the possibilities for automated tests which can be included into the decision tree. This knowledge has been transformed into decision trees for the IA.
decision tree hierarchy
The decision trees are grouped in a hierarchy according to the functionalities (see Fig. 6.18). The WebMail Service is regarded as an add-on to the E-Mail Service and its specific symptoms are treated in a special tree. However, the trees are connected so that the traversal of the WebMail tree can result in a forwarding of the issue to the decision tree for an antecedent service. decision tree "E−Mail Service"
decision tree "WebMail Service"
decision tree "e−mail reception"
decision tree "e−mail dispatch"
Figure 6.18: Hierarchy for the E-Mail Service related decision trees highlighting the example tree [Ber04] decision tree example
In the following an example from the master thesis (see Fig. 6.19) is enhanced to show how information for the service events is collected during the decision tree traversal. The decision tree is designed for the e-mail reception functionality of the E-Mail Service. Therefore, symptoms related to other services or functionalities are treated in other decision trees. For the reception functionality it is differentiated between two frequent situations (lost e-mails and unavailability of the mailbox) and a third general symptom reporting possibil230
6.2. Implementation
To which service is the symptom related to?
[E−Mail Service]
[other service]
Go to decision tree for other service
To which functionality is the symptom related to?
[receiving e−mail] [sending e−mail]
Go to decision tree for sending e−mail
What is the category of the issue? [e−mail is not received]
[the mailbox cannot be accessed] [other]
Which e−mails are affected? [all]
Test: POP access for test account
[only a subset]
E−mail forward activated?
Does the sender receive an error notification?
[yes]
[yes]
[no]
[ok] [not ok (server not reachable)]
[other (no access to mailbox)]
Request error message [connectivity related]
[no] Request error message
Perform self−check
User mistake
Go to decision tree for Connectivity Service
Can the symptom be reproduced? [certain condition]
[yes/no]
Request condition
Request information (user contact data, symptom description (including QoS Param, reoccurence), local configuration (operation system, client), recent local changes, last successful service use)
Generate service event
Figure 6.19: Decision tree for the e-mail reception (refined version of [Ber04])
231
Chapter 6. Application of the Framework to LRZ Services ity. The two branches of the decision tree aim to find out more details about the specific situation. branch for lost e-mails
In the first branch it is differentiated between the loss of any kind of e-mail and the loss of specific e-mails. When all e-mails seem to get lost, the user is asked whether an e-mail forward has been activated which would explain the situation as a user mistake. Otherwise, it is requested whether the sender has received any kind of error message (the user has to check this with the sender using another way of communication). At this point, the tree could be detailed for certain kinds of error messages which are related to LRZ policies such as the blocking of e-mails with attachments. If no error message has been received, a self-check (i.e. the user tries to send an e-mail to her own address) is requested. Furthermore, the possibility to reproduce the situation with e-mails from other senders should be checked by the user. It is important to give advice to the user on the usual e-mail delivery times so that it can be differentiated between a slow (QoS parameter delay) and an unavailable (QoS parameter availability) service.
branch for symptoms in mailbox access
In the second branch the mailbox access is examined using an automated test to the corresponding mail server (the e-mail address has to be requested for that). If the server cannot be reached internally either, a failure of the server or a connectivity problem is likely. Otherwise, the error message that the user has received is requested and certain types of messages are examined to get to know whether there may be a connectivity symptom for the connection between the user and the mail server. If this is the case, the processing is forwarded to the Connectivity Service decision tree. Otherwise, a mailbox specific problem is assumed.
generation of service event information from the decision tree traversal
Finally, those situations where no user mistake or forward to other decision trees has been performed lead to the generation of service events. Here, a set of questions has to be answered with respect to the specification of service events (compare Section 4.6.2). The identifier of the event is assigned by the system which also applies to the reception date and valid date. For the latter the internal policy is used to determine when the rule-based reasoning should be terminated. As this service event results from the use of the IA, the event source is the user so that contact data have to be requested for reporting on the service event processing. The severity is assigned based on the information collected (e.g. whether a server unavailability is likely, all or only certain emails get lost). The service and service functionality attributes are specified as E-Mail Service and ReceiveEMail. Additionally, it has to be determined for the service functionality whether this issue is related specifically to e-mails from outside the MWN. If the symptoms are general (e.g. when all e-mails are lost), the default is specified as ReceiveEMailSentFromMWN. The SAP, description, and referring date have to be requested from the user at this stage. This also partially applies for keywords where a list may be provided. Other keywords also result from the tree traversal. For example, “complete e-mail loss”, “partial e-mail loss” may be candidates. The credibility should make use of the fact whether the symptoms can be automatically reproduced which 232
6.2. Implementation applies here to the automated test of the e-mail server. Mid-term considerations for the decision trees The IA tool is currently not promoted by the LRZ, even though it can help to reduce the amount of queries to the LRZ Service Desk and is available independent of business hours. Therefore, the documentation efforts for the services should also comprise the documentation of knowledge for the IA. It is important to note that the tool needs to have a substantial amount of knowledge in the first place in order to become really useful for the end users. However, it can then be a much better offer than the provisioning of FAQ pages.
decision tree establishment
The effort for the maintenance of the decision tree will lead to a decrease of the user queries to the service desk and the second level support. Furthermore, also the reply to questions posed to the service desk can be simplified. In sum, the time saved should be longer than the time spent for the maintenance of the decision trees, in particular for services with frequent user questions.
trade-off for the effort
6.2.6 Collaboration with Resource Management As mentioned earlier, HP OpenView NetworkNodeManager is used for the management of the router and switch infrastructure at the LRZ. The server (SunFire 280R) for doing this operation is connected (100 Mbit/s) to the switch swm1-2wr as shown in the figures of the Web Hosting and E-Mail Service and will be redundantly connected to the switch swm2-2wr in the future. Currently, the NetworkNodeManager is extended with HP’s Event Correlation Services to perform the correlation of up/down messages which are reported as SNMP traps. For example, a maintenance operation at a larger institute resulted in more than 700 traps for the devices behind the switch which have been correlated to the switch. For network faults or maintenance being located in close proximity to the management server an even higher number of traps is received which can sometimes not be handled anymore. This shows the importance of the location of the monitoring station which can only deliver a network view from its perspective.
network level event correlation
HP OpenView and Tivoli’s NetView component have a common origin (which is reflected in some NetView command names). It is therefore possible to import HP OpenView events in the TEC correlation which is according to the concept to match service events to resource events.
6.2.7 LRZ’s Own Service Monitoring In addition to HP OpenView, different tools are in place to monitor the network, but these tools perform a resource-oriented monitoring. InfoVista [Inf] shows the availability and performance of network devices and links which are managed by the networking department. A Cacti-based [Cac] web interface is used for the Linux server monitoring showing CPU utilization, mem233
tools for network monitoring
Chapter 6. Application of the Framework to LRZ Services ory usage, number of processes and users, and the utilization of interfaces. As an alternative to HP OpenView, there are also experiments with the open source tool Nagios [Nag] and others. limited use of key performance indicators
A step towards the monitoring from a service-oriented point of view is the calculation of the overall availability of the network. This key performance indicator (KPI) is calculated as the average of the availability figures of all interfaces using an equal weighting which is, however, not unanimously accepted. Together with the announcement of the KPI the longest situations of network unavailability including their reasons are reported for internal quality assurance. The same is done for the availability of the wireless network access points. These KPIs are related to a whole week so they are not intended for daily service operation. Other indicators, in particular for the availability and performance of services other than the basic connectivity, are not provided for the moment.
missing user perspective
In summary, it is currently not evaluated from a user point of view whether the services are really working so that only a reactive fault diagnosis is in place. Therefore, the installation of virtual users is recommended with respect to the main functionalities, QoS parameters, and SAPs.
web page retrieval
Recommendations for virtual users For the Web Hosting Service test clients should request a set of web sites on a regular basis and report when symptoms occur. The management functionality should also be tested by updating web pages at equal time gaps. The tests should use different access points, e.g. inside and outside the MWN.
virtual users for different user groups
For the E-Mail Service clients should represent the user groups LMU, TUM, and LRZ and be installed at locations representative for these users. The tests should include the access to mailboxes and the sending of e-mail.
KPIs for service monitoring
Mid-term considerations for the monitoring From a service-oriented point of view KPIs for the services should be specified and target values should be defined whose monitoring is continuously carried out and reported. Service-oriented values can, e.g., be the average delay times for e-mails or the value achieved for a certain percentile of the e-mails.
development of tests and virtual users
The monitoring of services and resources requires the writing and maintenance of appropriate tests for which it can be differentiated between fully automated monitoring routines and partially automated solutions where routines for some steps have been implemented and a documentation for the whole testing is provided. Furthermore, the virtual users have to be implemented. These recommendations aim at increasing the QoS and require additional effort for their initial implementation. However, the automated tests are going to ease the fault diagnosis so that no additional effort is expected for a mid-term perspective. 234
6.2. Implementation
6.2.8 Implementation Summary A summary of the architecture that has been chosen for the prototypical implementation of service-oriented event correlation at the LRZ is depicted in Fig. 6.20. It shows the tools that have been applied for the components of the framework in Chapter 4.
prototypical implementation
test user service event employee interviews network management information systems management information "Service MIB"
IBM Tivoli Enterprise Console
service event/ case
rule−based reasoner
Netzdoku tool network management information systems management information
resource event
BMC Remedy Action Request System "case−based reasoner" systems management information
HP OpenView Event Correlation Services rule−based reasoner (resources) network management information
Figure 6.20: Prototypical implementation at the LRZ (upper part: tool name, lower part: component role, solid arrows: control flow, dashed arrows: information flow)
For the input the events have to be provided manually taking care of the required information. The event correlation on the service level is carried out by the Tivoli Enterprise Console which acts as rule-based event correlator. Events that have not been correlated can be entered as trouble tickets into the BMC Remedy ARS. The functionality of BMC Remedy ARS allows to some extent to find related trouble tickets. The adaptation of a previous solution is hardly supported because it can only be displayed without providing adaptation methods. On the resource level HP OpenView Event Correlation Services are applied for correlating network events.
component realization
The main challenge that is currently encountered is the lack of documentation especially concerning the services and service-related dependencies. The (automatically discovered) network structure without end systems together with current performance data can be found in HP OpenView NetworkNodeManager. The network structure is also documented in the “Netzdoku” and contains some additional servers. The connections of a part of the servers are also contained in Excel sheets which have been created for the move of the LRZ to Garching and therefore are sometimes not up-to-date anymore. BMC Remedy ARS is not only used for managing trouble tickets, but also as an asset management solution. As the documentation in all tools is not serviceoriented, it is not clear which components belong to a service. The remaining information concerning services, service functionalities, QoS parameters, etc is not explicitly documented from the provider perspective. Some information can be gained from the user instructions, but the internal realization is often not given so that interviews with the service maintainers and resource administrators had to be conducted.
configuration knowledge sources
235
Chapter 6. Application of the Framework to LRZ Services
6.3
Ongoing Maintenance and Optimization
Based on the prototypical implementation summarized before, a set of measures is given in the following to transform the prototype into an operational solution. The targeted implementation (a refined version of [Han06]) is depicted in Fig. 6.21. user LRZ Service Desk CSM
CSM / Intelligent Assistant
service event
CSM service event virtual users service monitoring
InfoVista SLA reporting
service event BMC Remedy Action Request System
service event/ case
case−based reasoner systems management information
IBM Tivoli Enterprise Console rule−based reasoner resource event
resource event
Netzdoku tool network management information systems management information "Service MIB"
Nagios, Cacti resource monitoring
HP OpenView Event Correlation Services rule−based reasoner (resources) network management information
Figure 6.21: Proposal for implementation at the LRZ (upper part: tool name, lower part: component role, solid arrows: control flow, dashed arrows: information flow) CSM/ Intelligent Assistant
Following an adaptation of the IA to the current conditions of the services, this tool should be better promoted for the use in reporting symptoms. As the number of QTs in comparison to TTs shows, more than 2 of 3 user questions are related to a lack of user information which can be provided in that way. The structuring of knowledge in the IA can be regarded as more user friendly than the provisioning of FAQ pages only. In addition, tests should be included in the decision trees. The tool can be integrated into an overall portal solution for the users such as the myTUM portal. This concept is also compliant to the CSM since a unified access point to all information is granted. Nevertheless, a telephone backup has to be provided in any case because a network connectivity symptom cannot be reported if the same symptom prevents that the IA can be accessed or that e-mails can be sent.
virtual users
Virtual users should be installed according to the considerations given earlier so that the LRZ can react proactively. The use of instrumented clients is not suitable for the services because no client software is provided by the LRZ to use these services.
Tivoli Enterprise Console
The use of TEC for the service event correlation should be continued, but it should be migrated to another location in the network to be next to the 236
6.4. Withdrawal nm1 where HP OpenView is installed. The reason for that is to harmonize the view on the network which depends on the network location. To reduce the load and to have redundancy also in the network monitoring, additional installations of HP OpenView and TEC should be considered. Derived from the TEC information an overview console for the currently achieved service quality should be provided. Historical information for SLA monitoring can be integrated in the InfoVista tool which currently shows a history of the network performance and of the processing of TTs. For the use of monitoring tools such as Cacti and Nagios a linking to the event correlation and service monitoring is required. Threshold violations detected by these tools should be transferred to TEC by writing appropriate adapters. In addition, the aim should be to keep the number of applied tools low to avoid data duplication.
integration of other monitoring tools
The case-based reasoner implementation needs to be improved by providing means of adaptation to a previous solution. Due to the use of BMC Remedy ARS for TTs and asset management, a possibility to extend the tool should be considered.
BMC Remedy ARS
The most important challenge is the reliable documentation of service-related information according to the Service MIB. For the LRZ situation the errorprone use of Microsoft Excel sheets and the lack of available documentation need to be tackled. It is recommended to extend the “Netzdoku” tool for containing service-related information as commercial tools are having limitations for this purpose so far. The documentation of services should follow a template structure.
towards a Service MIB
The documentation of services will not be helpful for the fault diagnosis only. It is also needed for impact analysis since it is currently not possible to determine the impact on services when resources (e.g. a switch) are unavailable. The documentation and impact estimation is also an important input for change management where the risk of changes has to be determined.
additional Service MIB benefits
The implementation of service-oriented event correlation on a permanent basis has to be monitored by using the considerations for assessment metrics in Section 4.7. The use of BMC Remedy ARS allows to generate statistics for the diagnosis time so that the improvement in this area can be monitored. For the effort reduction the use of the decision trees and the percentage of situations being resolved by the rule-based reasoner should be monitored.
assessment metrics
6.4
Withdrawal
The use of both the Web Hosting and E-Mail Service has been increasing over the previous years together with the requirements for the reliability of the services. Therefore, the service event correlation is expected to be relevant at least for a mid-term perspective. 237
Chapter 6. Application of the Framework to LRZ Services
6.5 prototypical implementation
Summary
The application of service-oriented event correlation for the LRZ Web Hosting and E-Mail Service has been presented in detail in this chapter. The work has begun with analyzing the way the example services are realized at the LRZ, for example highlighting the redundancy concepts, and to model the dependencies as needed for the correlation. The implementation of the rulebased reasoner using TEC has shown the realization of the events and rules in the tool and the measures to be taken to achieve a service-oriented view. The definition of events is based on the frequently used functionalities. The casebased reasoner implementation has demonstrated how CBR can be integrated into BMC Remedy ARS. For the collaboration with resource management and for service-oriented monitoring concrete recommendations have been given. Going beyond the service fault diagnosis recommendations have been provided for an improved information management allowing for impact analysis and change management. The overall steps which should be carried in the future are summarized as follows. • Specify templates for standardizing information about services (templates for functionalities, usage, dependencies) which have to be initially filled out and continuously maintained. • Define targets for the service quality to be achieved and examine the possibilities to monitor these aims. • Improve the Netzdoku tool for the documentation of services according to the templates. This should be part of a general configuration management concept with respect to ITIL. • Improve the tool also for the automated derivation of rules with respect to the rule types. • Create decision trees for the services being offered which should include automated tests in order to ensure the quality of input. Offer them internally for the service desk staff and externally on the service desk web pages. • Enhance BMC Remedy ARS for reflecting the case template structure. Check the exchange of information between Tivoli and Remedy. • Define a concept for the monitoring of services using virtual users and tests on a regular basis. Write the tests and monitoring agents and also prepare on demand tests. Integrate the current resource monitoring into the implementation. • Implement a change management policy at the LRZ which also has to consider the needs of monitoring. Investigate the tool support for change management. 238
Chapter 7 Conclusions and Future Work
Contents 7.1
Achievements . . . . . . . . . . . . . . . . . . . . . . . . 239
7.2
Future Development Possibilities . . . . . . . . . . . . . 241
7.3
Outlook . . . . . . . . . . . . . . . . . . . . . . . . . . . 243
As a conclusion of this thesis, the major results from the chapters of the thesis are summarized. In addition, several directions for future research related to the findings of this thesis are discussed.
7.1
Achievements
The purpose of Chapter 2 has been the elaboration of requirements for a generic framework for service fault diagnosis. The requirements result from a generic scenario, but are also motivated and illustrated using the LRZ scenario. The requirements have been grouped into requirements for the diagnosis workflow, the management information, and components where the latter ones are split up according to interfaces, diagnosis components, and those related to an overall service (fault) management solution.
requirements derivation
These requirements have been used for the categorization and assessment of related work in Chapter 3. It has been shown that ITIL and eTOM can be applied as the basis for the workflow modeling, but that more elaboration in particular with respect to the realization of the recommendations is required. Limitations with respect to the service-orientation and dependency modeling have been found in current information models. For the fault management interfaces the CSM together with the Intelligent Assistant already offers a good basis. A focus has been set onto the discussion of diagnosis techniques, in particular event correlation techniques, where their advantages and disadvantages for the service-oriented application have been elaborated. Furthermore, some standards and approaches related to SLM have been discussed at the end of the chapter.
contributions and limitations of related standards and approaches
239
Chapter 7. Conclusions and Future Work framework for service-oriented event correlation
In Chapter 4 the idea to use event correlation techniques for the diagnosis on the service level has been motivated. After a refinement of the requirements with respect to this approach, workflows have been developed. These have been set in relation to ITIL and eTOM so that the workflows can be regarded as an extension of these frameworks. Components that are needed for the implementation of the workflow have been identified afterwards. While references to standards and research approaches can be given for components in the context of the diagnosis, the event correlation of the service level has required further investigation. Here, a hybrid event correlation architecture is proposed combining rule-based and case-based reasoning and also using active probing techniques. The use of these techniques has been detailed in a pseudocode algorithm which evolves in a number of consecutive steps where more and more assumptions are removed. The diagnosis poses requirements to the service-related information that is needed. Therefore, a class model has been devised which in particular focuses on dependencies. Furthermore, the event information has been investigated and rule types have been defined for the execution of the algorithm. After specifying a case template, assessment metrics for monitoring the effectiveness of a service fault diagnosis solution have been proposed. As service fault diagnosis is only a partial solution to service fault management, the options for collaboration with impact analysis and recovery have also been discussed. An assessment of the achievements in relation to the requirements has concluded the chapter.
guidelines for life cycle
The use of service-oriented event correlation within an organization has a life cycle similar to the one of the services. Recommendations for these phases are given in Chapter 5 highlighting the considerations and trade-offs in the implementation phase.
implementation at the LRZ
While these recommendations have an abstraction level similar to ITIL to be applicable for a variety of organizations, they are taken as the basis for the implementation at the LRZ as described in Chapter 6. It is explained why the Web Hosting Service and the E-Mail Service have been selected out of the service portfolio for the start of the implementation of the event correlation framework. For these services the dependencies have been collected from several documentations and employee interviews and are modeled using the information model where several trade-offs concerning the modeling depth have been considered. Based on the dependencies, events and rules are defined using TEC. Here, the rules do not just have to reflect the dependencies, but they also have to cope with the limitations of TEC with respect to service-orientation and multiple root causes. For the case-based reasoning it is explained how the BMC Remedy ARS installation can be modified. The same holds for the Intelligent Assistant where it is shown how the service event information is collected in the decision tree traversal. Based on a summary of the prototypical implementation, a concrete recommendation is given how the fault management at the LRZ can be improved in the future. In summary, the main innovative aspects of the thesis are the inclusion of user reports into the automated diagnosis defining a standardized representation as
240
7.2. Future Development Possibilities well as the event correlation algorithm. This algorithm is based on a thorough analysis of available techniques combining and extending them according to the needs of service-orientation. Refinements have been proposed for the specification of diagnosis workflows as well as for the service and dependency modeling. A lot of effort has been invested to prototypically implement the approach at the LRZ in order to show its feasibility.
7.2
Future Development Possibilities
The fault management framework allows for extensions in different directions which result from possible modifications of the event correlation and special solutions for service domains. Event correlation related developments The way how events are used in the event correlation framework can be regarded as a reactive manner. Events that are reported from users denote that some symptoms have already occurred. Even though the events that result from the service monitoring try to prevent that users are affected, these events also show that some symptoms are already there. A way to be aware of critical situations before any symptoms occur is to perform trend analysis. An idea for doing so is to define events and correlation rules with respect to the tendencies reported in the events. Examples of such events on the resource level can be a rising utilization of a CPU, memory, or disk space. On the service level the number of users accessing the service can be tracked so that additional capacities can be ordered which usually requires some advance planning.
using events for trend analysis
In the event correlation workflow the correlation steps have been differentiated with respect to the kinds of dependencies. The reason for that is to allow for a parallel processing of events which are not related in the first place. Especially for large organizations, it can be useful to further differentiate the correlation of events and to form correlation hierarchies. If, for example, a large server farm is used, it can be reasonable to correlate events related to the server farm to each other in the first place before these events are correlated to other events.
hierarchical event correlation
Furthermore, as outlined in [MF04] event correlation engines can become a bottleneck in fault diagnosis when many parameters have to be monitored per managed system (around 100 per device in the referenced e-business scenario). Therefore, event correlation may have to be further distributed up to a local event correlation on each machine. This situation is already part of autonomic computing where a device manages itself to a certain extent.
autonomous event correlation
The classification of RBR/CBR combinations in [HP07] (compare Fig. 3.28) gives an overview of possibilities for the collaboration of RBR and CBR modules. Based on the experiences gained in a given scenario, it could be inves-
modification of RBR/CBR collaboration
241
Chapter 7. Conclusions and Future Work tigated whether a more active role of the CBR module is beneficial. To save time the case-based reasoner could search for previous cases already on arrival of service events so that related cases are already available when the correlation fails. Another possibility would be to direct events to rule-based or case-based reasoning according to some criteria or to introduce a common score indicating the assumed accuracy of a solution reported by either one of the modules. Another possibility is to adopt the idea of the approach for highly dynamical situations and to have an additional CBR module containing cases of the overall network and service situation (see Section 3.4.6). security management collaboration
Event correlation is a technique that is also applied for security management where security related events are correlated in order to detect attacks. Faults and security incidents (e.g. DoS attacks) may have similar effects on the quality of provided services and have to be set in context to each other so that security incidents are considered as potential root causes of service degradations. As a consequence, several steps have to be carried out for the collaboration. Security events should be defined as additional input events for the event correlation and additional security related rules have to be specified to achieve an integrated correlation. Security related information should also be part of the correlation results so that it is indicated whether a root cause resource is faulty or whether it has been abused. The CSM to subproviders and maybe also to users should be used to exchange security related symptoms, e.g. about distributed DoS attacks.
QoS threshold specification with respect to SLAs
Service domain related developments In this thesis no method for specification of SLA conditions has been recommended in order to preserve the genericity of the framework. For application to a scenario where SLAs are in place a derivation from these conditions in order to gain thresholds for QoR parameters is needed. These thresholds are required to appropriately raise events with respect to quality degradations which influence the SLA fulfillment. The mapping of SLA conditions onto services and resources is even more important for impact analysis where it is vital to be able to calculate the effect of the current resource conditions onto SLAs. This issue is going to be addressed in [Sch07].
SLA-related time constraints in the diagnosis
It is related to the specification of time conditions for the event correlation which have to be set in a concrete scenario. It is necessary to specify how long events should be valid and which conditions may lead to an invalidity of events. The correlation examples in Section 6.2.3 have shown that different policies can be applied for this (in the second example previously witnessed positive events are not accepted). Time conditions also hold for the escalation procedures towards the use of the manual problem solving.
adaptation for Web/Grid services
The area of Web services and Grid services has evolved into an important research area over the recent years. Fault management using these looselycoupled services can be a difficult task especially with respect to locating the root cause of a symptom in one of the collaborating services. Therefore, it would be beneficial to refine the event correlation framework for these kinds 242
7.3. Outlook of services and to detail some recommendations.
7.3
Outlook
In the industry a general trend towards policies that aim to reduce the complexity in the implementation of services can be witnessed [BRH+ 07]. The policies aim to make use of a limited set of vendors (e.g. policy limiting the variety of database products to two vendors) which is also helpful for effort reduction in fault management. A reduced set of equipment allows to gain more knowledge about the used hardware and software. For the service-oriented event correlation this means that more accurate models can be provided which will therefore also lead to a higher accuracy of the automated diagnosis.
streamlining trend
Even though the modeling already considered redundancies on the service level, this aspect is likely to become more important in the future due to the use of Web services and related developments. The competition among the services and the standardization of functionalities being provided can result in an easy exchange of the services. This situation is already present for stock exchanges where no differences exist in the product that can be purchased so that only the QoS conditions are used for the decision (here, availability and pricing).
inter-service dependencies
At the LRZ the implementation of ITIL will become a focus in the following years. Reasons for the introduction which also hold for many other organizations are the paradigm shift towards the management of services and processes as well as the standardization of processes according to best practice recommendations. Important services with respect to these changes are the federated identity management (TUM’s IntegraTUM project [Int]) where critical services will be concentrated at the LRZ (an unavailability of this service will then affect network logins for the whole university). The same holds for the centralization of TUM e-mail servers at the LRZ. As discussed in Chapter 6, deficits in the Service Support processes exist primarily in Configuration and Change Management, but improvements in Incident and Problem Management are also recommended.
ITIL at the LRZ
243
Appendix A Complete Code of the Correlation Algorithm
The correlation algorithm development in Section 4.5.2 has used a stepwise method to improve the algorithm for which only the new pieces have been given as code segments in each part. The complete code of the algorithm is summarized here so that all valid parts are joined together. Furthermore, an additional figure (Fig. A.1) is provided to show which code segments are executed by which framework components. CSM input code in Fig. A.2.
The pseudocode for reporting events at the CSM is given
Rule-based component code for service level correlation The code for the rule-based component is logically divided into the code for correlation of service events (see Fig. A.3) and the aggregated event correlation (see Fig. A.4). In contrast to the code in Section 4.5.2, the failure of the correlation to antecedents (i.e. no negative events for antecedents are found to explain a negative event for the dependent) is considered in the code. Code for resource event correlator The code for the rule-based reasoning in the resource event correlator is depicted in Fig. A.5. Event working set code The event working set in Section 4.5.2 has been the same for the service management level and the resource management level. In order to have a clearer distinction between service and resource level the code is provided here for an event working set (service level) in Fig. A.6 and an event working set (resource level) in Fig. A.7.
245
Appendix A. Complete Code of the Correlation Algorithm
Customer Service Management INPUT AT CSM
service event
QoS probing and measurement
probe service
service event related events
rule−based reasoner
candidate list
store event
no rule match
case−based reasoner
SERVICE EVENT WORKING SET
subservice symptom report
find cause
subservice CSM client
RESOURCE EVENT WORKING SET resource management resource probing and monitoring
service event correlator
event working set
SERVICE EVENT CORR. AGGRE. EVENT CORR. probe resource
service management
resource event
resource event RESOURCE EVENT CORR. resource event correlator
Figure A.1: Mapping of the framework components and code segments
246
1: 2: 3: 4: 5: 6: 7: 8: 9: 10: 11: 12: 13: 14: 15: 16: 17: 18: 19: 20: 21: 22:
procedure I NPUT AT CSM if reporting of new symptom then traverse IA decision tree if no user fault and credential verification ok then transfer resulting service event to event working set else report back to user end if else ⊲ check status of previous service event retrieve old service event if service event not correlated then update service event using the IA else ⊲ try roll-back of correlation if correlation time of service event exceeded then return ⊲ roll-back not promising as related events already out-of-date else track links to correlated events (recursively) transfer events to event correlator end if end if end if return end procedure Figure A.2: Input procedure
247
Appendix A. Complete Code of the Correlation Algorithm 1: 2: 3: 4: 5: 6: 7: 8: 9: 10: 11: 12: 13: 14: 15: 16: 17: 18: 19: 20: 21: 22: 23: 24: 25: 26: 27: 28: 29: 30: 31: 32: 33: 34: 35: 36: 37: 38: 39: 40:
248
procedure S ERVICE E VENT C ORRELATION serviceEventSet ← null while true do ⊲ permanent correlation loop add new service events to serviceEventSet (received from event working set) for each service event in serviceEventSet do get antecedents(service of the service event) if number(antecedent) = 0 then ⊲ it is a subprovider’s service send to subprovider CSM, remove from serviceEventSet else for each antecedent in antecedents do if antecedent is a service then if no event(antecedent) exists in serviceEventSet then if no test(antecedent) has been triggered yet then trigger test(antecedent) end if else if (status(antecedent) = false) then correlate to previous event end if else ⊲ antecedent is a resource send service event to event working set (as correlated service event) end if end for end if end for for each service event in serviceEventSet do if correlation to all antecedents that are services performed then if one or more status(antecedent) = false then ⊲ successful correlation remove service event from serviceEventSet else report service event to case-based reasoner remove service event from serviceEventSet end if ⊲ correlation failed end if if correlation time slot for service event exceeded then send service event to event working set end if end for end while return end procedure Figure A.3: Procedure for service event correlation
1: 2: 3: 4: 5: 6: 7: 8: 9: 10: 11: 12: 13: 14: 15: 16: 17: 18: 19: 20: 21: 22: 23: 24: 25: 26: 27: 28: 29: 30: 31: 32: 33: 34: 35: 36: 37: 38: 39: 40:
procedure AGGREGATED E VENT C ORRELATION serviceEventSet ← null resourceEventSet ← null while true do ⊲ permanent correlation loop add new service events to serviceEventSet (received from event working set) add new resource events to resourceEventSet (received from event working set) for each service event in serviceEventSet do get antecedents(service of the service event) for each antecedent in antecedents that is a resource do if no event(antecedent) exists in resourceEventSet then if no test(antecedent) has been triggered yet then trigger test(antecedent) end if else if status(antecedent) = false then correlate to previous event end if end for end for for each service event in serviceEventSet do if correlation to all antecedents that are resources performed then if one or more status(antecedent) = false then ⊲ successful correlation send resources in resource events correlated to this service event as candidates to resource management remove service event from serviceEventSet else report service event to case-based reasoner remove service event from serviceEventSet end if ⊲ correlation failed end if if correlation time slot for service event exceeded then send service event to event working set end if end for for each resource event in resourceEventSet do if correlation time slot for resource event exceeded then send resource event to event working set end if end for end while return end procedure Figure A.4: Procedure for aggregated event correlation
249
Appendix A. Complete Code of the Correlation Algorithm
1: 2: 3: 4: 5: 6: 7: 8: 9: 10: 11: 12: 13: 14: 15: 16: 17: 18: 19: 20: 21: 22: 23: 24: 25: 26: 27: 28:
procedure R ESOURCE E VENT C ORRELATION resourceEventSet ← null while true do ⊲ permanent correlation loop add new resource events to resourceEventSet (received from event working set) for each resource event in resourceEventSet do get antecedents(resource of the resource event) for each antecedent in antecedents do if no event(antecedent) exists in resourceEventSet then if no test(antecedent) has been triggered yet then trigger test(antecedent) end if else if status(antecedent) = false then correlate to previous event end if end for end for for each resource event in resourceEventSet do if correlation to all antecedents performed then send resource event to event working set (as correlated resource event) remove resource event from resourceEventSet ⊲ completely correlated resource event end if if correlation time slot for resource event exceeded then send resource event to event working set end if end for end while return end procedure Figure A.5: Procedure for resource event correlation
250
1: 2: 3: 4: 5: 6: 7: 8: 9: 10: 11: 12: 13: 14: 15: 16: 17: 18: 19: 20: 21: 22: 23: 24:
procedure S ERVICE E VENT WORKING S ET while true do serviceEventSet ← null correlatedServiceEventSet ← null ⊲ variable correlationServices externally maintained serviceEventSet ← new service events from CSM and own monitoring for each service event in serviceEventSet do if service(service event) not in correlationServices then remove service event ⊲ exclude events for not considered services end if end for send serviceEventSet to service event correlator ⊲ condition that at least one antecedent of the service is a service can be added correlatedServiceEvents ← correlated service events from service event correlator send correlatedServiceEvents to aggregated event correlator serviceEventSet ← non-correlated events from service event correlator and aggregated event correlator for each service event in serviceEventSet do if important service event then send event to case-based reasoner else discard event end if end for end while return end procedure Figure A.6: Management of events on the service level
251
Appendix A. Complete Code of the Correlation Algorithm
1: 2: 3: 4: 5: 6: 7: 8: 9: 10: 11: 12: 13:
14: 15: 16: 17: 18: 19: 20: 21: 22: 23: 24:
procedure R ESOURCE E VENT WORKING S ET while true do resourceEventSet ← null correlatedResourceEventSet ← null ⊲ variable correlationResources externally maintained resourceEventSet ← new resource events from resource monitoring and testing for each resource event in resourceEventSet do if resource(resource event) not in correlationResources then remove resource event ⊲ exclude events for not considered services and their resources as well as other unused resources end if end for send resourceEventSet to resource event correlator correlatedResourceEvents ← correlated resource events from resource event correlator send correlatedResourceEvents to aggregated event correlator ⊲ condition that at least one dependent of each resource is a service can be added resourceEventSet ← non-correlated events from resource event correlator and aggregated event correlator for each resource event in resourceEventSet do if important resource event then send event to case-based reasoner else discard event end if end for end while return end procedure Figure A.7: Management of events on the resource level
252
Appendix B Tivoli Enterprise Console Implementation Code
A listing of code from the implementation of the rule-based reasoning module using TEC is provided here supplementary to Chapter 6. The code is divided into the definition of events for the example services, the specification of rules, and correlation examples. Event definition The complete source code for the definition of additional events is given in Listing B.1. It starts with basic event classes for resources, services, and service functionalities for which subclasses with respect to meeting of thresholds are derived. Information events indicate the registration of a logical connection between events in case of the LINKED event and the triggering of tests in case of the ACTIVE PROBING events. Listing B.1: Event definitions in baroc file 1 2 3
################################################# # Base event classes #################################################
4 5 6 7 8 9 10 11 12 13 14 15
# Resource Events TEC_CLASS: TEC_LRZ_RESOURCE_QOR_EVENT ISA EVENT DEFINES { source: STRING, default = "LRZ resource monitoring"; severity: SEVERITY, default = WARNING; status: STATUS, default = OPEN; date_reception: INT32; resource_QoRParam: STRING; }; END
16 17 18 19 20 21 22 23 24
# Service Events TEC_CLASS: TEC_LRZ_SERVICE_QOS_EVENT DEFINES { source: STRING, default severity: SEVERITY, status: STATUS, date_reception: INT32;
ISA EVENT = "LRZ service monitoring"; default = WARNING; default = OPEN;
253
Appendix B. Tivoli Enterprise Console Implementation Code 25 26 27 28 29 30 31 32 33 34
date_referring: INT32; service_func_QoSParam: STRING; service_access_point: STRING; valid_to: INT32; description: STRING; keywords: STRING; linked_cause_handles: LIST_OF INTEGER, linked_cause_dates: LIST_OF INT32, }; END
default = []; default = [];
35 36 37 38
TEC_CLASS: TEC_LRZ_SERVICEFUNC_QOS_EVENT ISA TEC_LRZ_SERVICE_QOS_EVENT END
39 40 41 42 43 44
################################################# # Event classes for QoS/QoR indication #################################################
45 46 47 48
49
# Service QoS "not ok" or "ok" events TEC_CLASS: TEC_LRZ_SERVICE_QOS_NOK ISA TEC_LRZ_SERVICE_QOS_EVENT ; END
50 51 52 53 54 55 56
TEC_CLASS: TEC_LRZ_SERVICE_QOS_OK ISA TEC_LRZ_SERVICE_QOS_EVENT DEFINES { severity: SEVERITY, default = HARMLESS; }; END
57 58 59 60 61
62
# Service functionality QoS "not ok" or "ok" events TEC_CLASS: TEC_LRZ_SERVICEFUNC_QOS_NOK ISA TEC_LRZ_SERVICEFUNC_QOS_EVENT; END
63 64 65 66 67 68 69
TEC_CLASS: TEC_LRZ_SERVICEFUNC_QOS_OK ISA TEC_LRZ_SERVICEFUNC_QOS_EVENT DEFINES { severity: SEVERITY, default = HARMLESS; }; END
70 71 72 73 74
75
# Resource QoR "not ok" or "ok" events TEC_CLASS: TEC_LRZ_RESOURCE_QOR_NOK ISA TEC_LRZ_RESOURCE_QOR_EVENT; END
76 77
TEC_CLASS:
254
78 79 80 81 82
TEC_LRZ_RESOURCE_QOR_OK ISA TEC_LRZ_RESOURCE_QOR_EVENT DEFINES { severity: SEVERITY, default = HARMLESS; }; END
83 84 85 86
################################################# # Informational events #################################################
87 88 89 90 91 92 93 94 95 96 97 98 99 100
# Probable cause for an effect service event found TEC_CLASS: TEC_LRZ_LINKED_EVENT ISA EVENT DEFINES { effect_service: STRING; effect_event_handle: INTEGER; effect_event_date: INT32; effect_class: STRING; cause_event_handle: INTEGER; cause_event_date: INT32; cause_class: STRING; }; END
101 102 103 104 105 106 107 108 109 110 111
# Common active probing event TEC_CLASS: TEC_LRZ_ACTIVE_PROBING_EVENT ISA EVENT DEFINES { sender_date: INT32; sender_handle: INTEGER; services: LIST_OF STRING, default = []; resources: LIST_OF STRING, default = []; }; END
112 113 114 115 116 117 118 119 120 121
# active probing event for a resource TEC_CLASS: TEC_LRZ_ACTIVE_PROBING_RESOURCE ISA EVENT DEFINES { sender_date: INT32; sender_handle: INTEGER; resource: STRING; }; END
122 123 124 125 126 127 128 129 130 131
# active probing event for a service TEC_CLASS: TEC_LRZ_ACTIVE_PROBING_SERVICE ISA EVENT DEFINES { sender_date: INT32; sender_handle: INTEGER; service: STRING; }; END
132 133
#################################################
255
Appendix B. Tivoli Enterprise Console Implementation Code 134 135 136 137 138
# Event without meaning to close all open events ################################################# TEC_CLASS: TEC_LRZ_CLOSE_ALL ISA EVENT; END
Rule definition The specified rules for the correlation are given in Listing B.2. Please refer to Section 6.2.3 and in particular Fig. 6.12 for more information about the rules. Listing B.2: Rule definitions in rls file 1
%--------------------------------------------------------------
2
% This is a startup rule used to initialize global parameters . %--------------------------------------------------------------
3
4 5 6 7 8 9 10
rule: startup: ( event: _event of_class ’TEC_Start’ where [ hostname: _hostname ],
11
% Set up global variables for the rule set. reception_action: setup: ( % Debug flag rerecord(lrz_debug, ’yes’),
12 13 14 15 16 17
% Debug file rerecord(lrz_logger, ’/tivoli/server/hans_rb/lrz01/lrz2. log’),
18 19
20
% Latency rerecord(lrz_latency, 200),
21 22 23
% Latency for duplicate events rerecord(lrz_dup_latency, 30),
24 25 26
% Time to keep service events open, if no root cause found rerecord(lrz_timer, 1800)
27
28 29
),
30 31
% Initializes trace/log/debug files. reception_action: initialize: ( tl_init(lrz_tl, lrz_debug, lrz_logger), commit_rule )
32 33 34 35 36 37 38
).
256
39 40 41
%--------------------------------------------------------------
42
% This is a shutdown rule used to finalize global parameters. %--------------------------------------------------------------
43
44 45 46 47 48
rule: shutdown: ( event: _event of_class ’TEC_Stop’ where [],
49
% Closes trace/log/debug files. reception_action: finalize: ( tl_stop(lrz_tl), commit_rule )
50 51 52 53 54 55 56
).
57 58 59
%---------------------------------------------------------------
60
% Rule for closing all events %---------------------------------------------------------------
61
62 63 64 65 66
rule: close_all: ( event: _event of_class ’TEC_LRZ_CLOSE_ALL’ where [],
67
action: ( all_instances( event: _ev of_class _ev_class where [ status: outside [’CLOSED’] ] ), set_event_status(_ev, ’CLOSED’), tl_str(lrz_tl, ’*’) ),
68 69 70 71 72 73 74 75 76 77 78 79 80
action: ( tl_str(lrz_tl, ’all CLOSED\n\n\n’), commit_rule )
81 82 83 84 85 86
).
87 88 89
%---------------------------------------------------------------
257
Appendix B. Tivoli Enterprise Console Implementation Code 90 91
92 93 94 95 96 97 98 99 100 101 102 103 104 105 106 107 108 109
% Rule to handle previous service events for the same service %--------------------------------------------------------------rule: duplicate_services: ( event: _event of_class _class within [ ’TEC_LRZ_SERVICE_QOS_OK’, ’TEC_LRZ_SERVICE_QOS_NOK’, ’TEC_LRZ_SERVICEFUNC_QOS_OK’, ’TEC_LRZ_SERVICEFUNC_QOS_NOK’ ] where [ status: outside [’CLOSED’], severity: _severity, server_handle: _srv_handle, date_reception: _date, event_handle: _ev_handle, hostname: _hostname, service_func_QoSParam: _service_func_QoSParam ],
110 111 112 113
114
action: start: ( tl_str(lrz_tl, ’\n\n’) ),
115 116 117 118
action: check_for_same_service: ( tl_fmt(lrz_tl, ’\t...processing %s event\n’, [_class]),
119
all_instances(_event, event: _same_event of_class within [’TEC_LRZ_SERVICE_QOS_OK’, ’TEC_LRZ_SERVICE_QOS_NOK’,’ TEC_LRZ_SERVICEFUNC_QOS_OK’,’ TEC_LRZ_SERVICEFUNC_QOS_NOK’] where [ status: outside [’CLOSED’], service_func_QoSParam: equals _service_func_QoSParam ] ), bo_get_class_of(_same_event, _same_class),
120
121 122 123 124 125 126 127
% Instead of dropping we prefer closing the event change_event_status(_event, ’CLOSED’),
128 129 130
tl_fmt(lrz_tl, ’\t...event %s correlated to previous %s\n ’, [_class, _same_class]),
131
132 133 134 135
% Prevent analysis of this event in the current rule commit_set ),
136 137 138
action: end: (
258
tl_str(lrz_tl, ’\n’)
139
)
140 141
).
142 143 144 145 146 147 148
149 150
151 152 153 154 155 156 157 158 159 160 161 162 163 164 165 166 167 168 169
%correlation %--------------------------------------------------------------% Correlation rule %--------------------------------------------------------------rule: lrz_correlate: ( event: _event of_class _class within [ ’TEC_LRZ_SERVICE_QOS_NOK’, ’TEC_LRZ_SERVICEFUNC_QOS_NOK’ ] where [ status: outside [’CLOSED’], severity: _severity, event_handle: _event_handle, date_reception: _date, event_handle: _ev_handle, hostname: _hostname, service_func_QoSParam: _service_func_QoSParam, service_access_point: _service_access_point, linked_cause_handles: _linked_cause_handles, linked_cause_dates: _linked_cause_dates ],
170 171 172 173
action: setup_correlation: ( tl_fmt(lrz_tl, ’\n\n ’, [_service_func_QoSParam]),
174 175 176
%get variables recorded(lrz_latency, _latency),
177 178 179 180 181
length(_linked_cause_handles, _l), % workaround to get integer in debug sprintf(_tmp, ’%u’, _l), tl_fmt(lrz_tl, ’\t...processing %s event on service %s with %s linked events\n’, [_class, _service, _tmp]),
182 183 184 185
%Resetting correlation vars reset_global_grp(’lrz_correlation’, []) ),
186 187 188
action: correlate_resources: (
259
Appendix B. Tivoli Enterprise Console Implementation Code tl_str(lrz_tl, ’\t\n ’),
189
190
% Based on received effect event class, define the possible cause classes ( member(_class, [’TEC_LRZ_SERVICE_QOS_NOK’,’ TEC_LRZ_SERVICEFUNC_QOS_NOK’]), _cause_classes = [’TEC_LRZ_RESOURCE_QOR_NOK’,’ TEC_LRZ_RESOURCE_QOR_OK’] ), set_global_var(’lrz_correlation’, ’dependent_resources’, []),
191
192 193
194
195 196
197
tl_str(lrz_tl, ’\t...cause classes identified\n’), ( _service_func_QoSParam == ’WebHosting_any_AvailInt’, _dependent_resources = [’csr1-2wr_Avail’,’swm1-2 wr_Avail’,’swm2-2wr_Avail’,’slb1_Avail’,’slb2_Avail ’,’swk4-2wr_Avail’,’swk1-2wr_Avail’,’nx114_Avail’,’ nx115_Avail’,’nx116_Avail’,’nx117_Avail’,’ nx118_Avail’,’nx119_Avail’] ; _service_func_QoSParam == ’ WebHostingWithZope_any_AvailInt’, _dependent_resources = [’swk3-2wr_Avail’,’swk2-2 wr_Avail’,’zope1_Avail’,’zope2_Avail’] ; _service_func_QoSParam == ’WebHosting_any_DelayInt’, _dependent_resources = [’csr1-2wr_ProcTime’,’swm1-2 wr_ProcTime’,’swm2-2wr_ProcTime’,’slb1_ProcTime’,’ slb2_ProcTime’,’swk4-2wr_ProcTime’,’swk1-2 wr_ProcTime’,’nx114_ProcTime’,’nx115_ProcTime’,’ nx116_ProcTime’,’nx117_ProcTime’,’nx118_ProcTime’,’ nx119_ProcTime’] ; _service_func_QoSParam == ’ WebHostingWithZope_any_DelayInt’, _dependent_resources = [’swk3-2wr_ProcTime’,’swk2-2 wr_ProcTime’,’zope1_ProcTime’,’zope2_ProcTime’] ; _service_func_QoSParam == ’DNS_any_AvailInt’, _dependent_resources = [’dns1_Avail’, ’dns2_Avail’] ; _service_func_QoSParam == ’EMail_any_AvailInt’, _dependent_resources = [’csr1-2wr_Avail’,’swm1-2 wr_Avail’,’swm2-2wr_Avail’,’swk9-2wr_Avail’,’swk10-2 wr_Avail’,’swk14-2wr_Avail’,’swk15-2wr_Avail’,’ lxmhs01_Avail’, ’lxmhs02_Avail’] ; _service_func_QoSParam == ’EMail_ReceiveEMail_AvailInt ’, _dependent_resources = [’lxmhs11_Avail’,’lxmhs12_Avail ’,’lxmhs19_Avail’,’lxmhs20_Avail’,’lxmhs21_Avail’,’ lxmhs22_Avail’] ;
198 199 200 201
202 203
204
205 206 207
208 209
210
211 212 213 214 215 216
217 218
219
220
260
_service_func_QoSParam == ’ EMail_ReceiveEMailSentFromOutsideMWN_AvailInt’, _dependent_resources = [’lxmhs05_Avail’,’lxmhs06_Avail ’,’lxmhs25_Avail’,’lxmhs26_Avail’]
221
222
223
; _service_func_QoSParam == ’EMail_any_DelayInt’, _dependent_resources = [’csr1-2wr_ProcTime’,’swm1-2 wr_ProcTime’,’swm2-2wr_ProcTime’,’swk9-2wr_ProcTime ’,’swk10-2wr_ProcTime’,’swk14-2wr_ProcTime’,’swk15-2 wr_ProcTime’,’lxmhs01_ProcTime’,’lxmhs01_QueueLength ’,’lxmhs02_ProcTime’,’lxms02_QueueLength’]
224 225
226
; _service_func_QoSParam == ’EMail_ReceiveEMail_DelayInt ’, _dependent_resources = [’lxmhs11_ProcTime’,’ lxmhs12_ProcTime’,’lxmhs19_ProcTime’,’ lxmhs20_ProcTime’,’lxmhs21_ProcTime’,’ lxmhs22_ProcTime’]
227
228
229
; _service_func_QoSParam == ’ EMail_ReceiveEMailSentFromOutsideMWN_DelayInt’, _dependent_resources = [’lxmhs05_ProcTime’,’ lxmhs06_ProcTime’,’lxmhs25_ProcTime’,’ lxmhs26_ProcTime’]
230
231
232
),
233 234 235 236
length(_dependent_resources, _dependent_length), sprintf(_tmp, ’%u’, _dependent_length), tl_fmt(lrz_tl, ’\t...%s dependent resources for service % s identified\n’, [_tmp, _service_func_QoSParam]),
237 238 239
% Set global correlation var set_global_var(’lrz_correlation’, ’dependent_resources’, _dependent_resources),
240 241 242 243 244 245 246 247 248 249 250
251
252
253 254 255
% Search for cause events not empty_list(_dependent_resources), ( tl_str(lrz_tl, ’\t...searching for cause events...\n’), all_instances( event: _cause_event of_class within _cause_classes where [ status: _cause_status outside [’CLOSED’], resource_QoRParam: _cause_resource within _dependent_resources, date_reception: _cause_date outside _linked_cause_dates, event_handle: _cause_event_handle outside _linked_cause_handles ], _event -600 -0 ),
256 257
bo_get_class_of(_cause_event, _cause_class),
261
Appendix B. Tivoli Enterprise Console Implementation Code tl_fmt(lrz_tl, ’\t...found %s event on resource %s\n’, [_cause_class, _cause_resource]),
258
259
% Remove this _cause_resource from list of dependents _default = [], get_global_var(’lrz_correlation’, ’dependent_resources ’, _new_dependent_resources, _default), delete(_new_dependent_resources, _cause_resource, _restof_dependent_resources), set_global_var(’lrz_correlation’, ’dependent_resources ’, _restof_dependent_resources),
260 261 262
263
264
265
% Generate linked event generate_event(’TEC_LRZ_LINKED_EVENT’, [ effect_service=_service_func_QoSParam, effect_event_handle=_event_handle, effect_event_date=_date, effect_class=_class, cause_event_handle=_cause_event_handle, cause_event_date=_cause_date, cause_class=_cause_class ] ), tl_str(lrz_tl, ’\t...TEC_LRZ_LINKED_EVENT generated\n’)
266 267 268 269 270 271 272 273 274 275 276 277 278 279 280
) ),
281 282 283 284 285 286 287
288 289 290 291 292 293 294 295 296 297 298 299
300 301 302
303 304
% reception_action! Will not be called in redo analysis reception_action: check_resource_restlist: ( % Get list of dependent resources _default = [], get_global_var(’lrz_correlation’, ’dependent_resources’, _probe_resources, _default), length(_probe_resources, _l), sprintf(_tmp, ’%u’, _l), ( _l > 0, generate_event(’TEC_LRZ_ACTIVE_PROBING_EVENT’, [ sender_handle=_event_handle, sender_date=_date, resources=_probe_resources ] ), tl_fmt(lrz_tl, ’\t...active probing event generated for %s resource(s)\n’, _tmp) ; _l == 0, tl_str(lrz_tl, ’\t...no resources found for active probing\n’) ) ),
305 306
action: exit_resources:
262
307
(
308
tl_str(lrz_tl, ’\t\n ’) ),
309 310 311 312 313
action: correlate_services: ( tl_str(lrz_tl, ’\t\n ’),
314 315
316 317
318
319
% Based on received effect event class, define the possible cause classes ( member(_class, [’TEC_LRZ_SERVICE_QOS_NOK’,’ TEC_LRZ_SERVICEFUNC_QOS_NOK’]), _cause_classes = [’TEC_LRZ_SERVICE_QOS_NOK’,’ TEC_LRZ_SERVICEFUNC_QOS_NOK’,’TEC_LRZ_SERVICE_QOS_OK ’,’TEC_LRZ_SERVICEFUNC_QOS_OK’] ),
320 321
set_global_var(’lrz_correlation’, ’dependent_services’, []),
322 323
( _service_func_QoSParam == ’ WebHosting_StaticWebPageRetrieval_Avail’, _dependent_services = [’WebHosting_any_AvailInt’,’ Storage_any_Avail’,’Firewall_any_Avail’,’ DNS_any_Avail’,’Connectivity_any_Avail’]
324
325
326
; _service_func_QoSParam == ’ WebHosting_DynamicWebPageRetrieval_Avail’, _dependent_services = [’WebHosting_any_AvailInt’,’ Storage_any_Avail’,’Firewall_any_Avail’,’ DNS_any_Avail’,’Connectivity_any_Avail’]
327
328
329
; _service_func_QoSParam == ’ WebHosting_AccessToProtectedArea_Avail’, _dependent_services = [’WebHosting_any_AvailInt’,’ Storage_any_Avail’,’Firewall_any_Avail’,’ DNS_any_Avail’,’Connectivity_any_Avail’,’ Authentication_any_Avail’]
330
331
332
; _service_func_QoSParam == ’ WebHosting_ChangeWebPage_Avail’, _dependent_services = [’WebHosting_any_AvailInt’,’ Storage_any_Avail’,’Firewall_any_Avail’,’ DNS_any_Avail’,’Connectivity_any_Avail’,’ Authentication_any_Avail’]
333
334
335 336
337
; _service_func_QoSParam == ’ WebHostingWithZope_StaticWebPageRetrieval_Avail’, _dependent_services = [’WebHostingWithZope_any_AvailInt ’,’WebHosting_any_AvailInt’,’Storage_any_Avail’,’ Firewall_any_Avail’,’DNS_any_Avail’,’ Connectivity_any_Avail’]
263
Appendix B. Tivoli Enterprise Console Implementation Code ;
338
_service_func_QoSParam == ’ WebHostingWithZope_DynamicWebPageRetrieval_Avail’, _dependent_services = [’WebHostingWithZope_any_AvailInt ’,’WebHosting_any_AvailInt’,’Storage_any_Avail’,’ Firewall_any_Avail’,’DNS_any_Avail’,’ Connectivity_any_Avail’]
339
340
;
341
_service_func_QoSParam == ’ WebHostingWithZope_AccessToProtectedArea_Avail’, _dependent_services = [’WebHostingWithZope_any_AvailInt ’,’WebHosting_any_AvailInt’,’Storage_any_Avail’,’ Firewall_any_Avail’,’DNS_any_Avail’,’ Connectivity_any_Avail’,’Authentication_any_Avail’]
342
343
;
344
_service_func_QoSParam == ’ WebHostingWithZope_ChangeWebPage_Avail’, _dependent_services = [’WebHostingWithZope_any_AvailInt ’,’WebHosting_any_AvailInt’,’Storage_any_Avail’,’ Firewall_any_Avail’,’DNS_any_Avail’,’ Connectivity_any_Avail’,’Authentication_any_Avail’]
345
346
;
347
_service_func_QoSParam == ’ WebHosting_StaticWebPageRetrieval_Delay’, _dependent_services = [’ WebHosting_StaticWebPageRetrieval_Avail’,’ WebHosting_any_DelayInt’,’Storage_any_Delay’,’ Firewall_any_Delay’,’DNS_any_Delay’,’ Connectivity_any_Delay’]
348
349
;
350
_service_func_QoSParam == ’ WebHosting_DynamicWebPageRetrieval_Delay’, _dependent_services = [’ WebHosting_DynamicWebPageRetrieval_Avail’,’ WebHosting_any_DelayInt’,’Storage_any_Delay’,’ Firewall_any_Delay’,’DNS_any_Delay’,’ Connectivity_any_Delay’]
351
352
;
353
_service_func_QoSParam == ’ WebHosting_AccessToProtectedArea_Delay’, _dependent_services = [’ WebHosting_AccessToProtectedArea_Avail’,’ WebHosting_any_DelayInt’,’Storage_any_Delay’,’ Firewall_any_Delay’,’DNS_any_Delay’,’ Connectivity_any_Delay’,’Authentication_any_Delay’]
354
355
;
356
_service_func_QoSParam == ’ WebHosting_ChangeWebPage_Delay’, _dependent_services = [’WebHosting_ChangeWebPage_Avail ’,’WebHosting_any_DelayInt’,’Storage_any_Delay’,’ Firewall_any_Delay’,’DNS_any_Delay’,’ Connectivity_any_Delay’,’Authentication_any_Delay’]
357
358
;
359
_service_func_QoSParam == ’WebHosting_any_DelayInt’, _dependent_services = [’WebHosting_any_AvailInt’]
360 361
;
362
264
_service_func_QoSParam == ’ WebHostingWithZope_StaticWebPageRetrieval_Delay’, _dependent_services = [’ WebHostingWithZope_StaticWebPageRetrieval_Avail’,’ WebHostingWithZope_any_DelayInt’,’ WebHosting_any_DelayInt’,’Storage_any_Delay’,’ Firewall_any_Delay’,’DNS_any_Delay’,’ Connectivity_any_Delay’]
363
364
365
; _service_func_QoSParam == ’ WebHostingWithZope_DynamicWebPageRetrieval_Delay’, _dependent_services = [’ WebHostingWithZope_DynamicWebPageRetrieval_Avail’,’ WebHostingWithZope_any_DelayInt’,’ WebHosting_any_DelayInt’,’Storage_any_Delay’,’ Firewall_any_Delay’,’DNS_any_Delay’,’ Connectivity_any_Delay’]
366
367
368
; _service_func_QoSParam == ’ WebHostingWithZope_AccessToProtectedArea_Delay’, _dependent_services = [’ WebHostingWithZope_AccessToProtectedArea_Avail’,’ WebHostingWithZope_any_DelayInt’,’ WebHosting_any_DelayInt’,’Storage_any_Delay’,’ Firewall_any_Delay’,’DNS_any_Delay’,’ Connectivity_any_Delay’,’Authentication_any_Delay’]
369
370
371
; _service_func_QoSParam == ’ WebHostingWithZope_ChangeWebPage_Delay’, _dependent_services = [’ WebHostingWithZope_ChangeWebPage_Avail’,’ WebHostingWithZope_any_DelayInt’,’ WebHosting_any_DelayInt’,’Storage_any_Delay’,’ Firewall_any_Delay’,’DNS_any_Delay’,’ Connectivity_any_Delay’,’Authentication_any_Delay’]
372
373
374
; _service_func_QoSParam == ’ WebHostingWithZope_any_DelayInt’, _dependent_services = [’WebHostingWithZope_any_AvailInt ’]
375
376
377
; _service_func_QoSParam == ’DNS_any_Avail’, _dependent_services = [’DNSExt_any_Avail’,’ DNS_any_AvailInt’,’Connectivity_any_Avail’]
378 379
380
; _service_func_QoSParam == ’DNS_any_Delay’, _dependent_services = [’DNS_any_Avail’,’ DNSExt_any_Delay’,’DNS_any_DelayInt’,’ Connectivity_any_Delay’]
381 382
383 384
385
; _service_func_QoSParam == ’ EMail_ReceiveEMailSentFromMWN_Avail’, _dependent_services = [’EMail_any_AvailInt’,’ EMail_ReceiveEMail_AvailInt’,’Storage_any_Avail’,’ Firewall_any_Avail’,’DNS_any_Avail’,’ Connectivity_any_Avail’,’Authentication_any_Avail’]
265
Appendix B. Tivoli Enterprise Console Implementation Code ;
386
_service_func_QoSParam == ’ EMail_ReceiveEMailSentFromOutsideMWN_Avail’, _dependent_services = [’EMail_any_AvailInt’,’ EMail_ReceiveEMail_AvailInt’,’ EMail_ReceiveEMailSentFromOutsideMWN_AvailInt’,’ Storage_any_Avail’,’Firewall_any_Avail’,’ DNS_any_Avail’,’Connectivity_any_Avail’,’ Authentication_any_Avail’,’EMailExternal_any_Avail’]
387
388
;
389
_service_func_QoSParam == ’ EMail_SendEMailFromMWNToMWN_Avail’, _dependent_services = [’EMail_any_AvailInt’,’ Storage_any_Avail’,’Firewall_any_Avail’,’ DNS_any_Avail’,’Connectivity_any_Avail’]
390
391
;
392
_service_func_QoSParam == ’ EMail_SendEMailFromOutsideMWNToMWN_Avail’, _dependent_services = [’EMail_any_AvailInt’,’ Storage_any_Avail’,’Firewall_any_Avail’,’ DNS_any_Avail’,’Connectivity_any_Avail’,’ Authentication_any_Avail’]
393
394
;
395
_service_func_QoSParam == ’ EMail_SendEMailFromMWNToOutsideMWN_Avail’, _dependent_services = [’EMail_any_AvailInt’,’ Storage_any_Avail’,’Firewall_any_Avail’,’ DNS_any_Avail’,’Connectivity_any_Avail’,’ EMailExternal_any_Avail’]
396
397
;
398
_service_func_QoSParam == ’ EMail_SendFromOutsideMWNToOutsideMWN_Avail’, _dependent_services = [’EMail_any_AvailInt’,’ Storage_any_Avail’,’Firewall_any_Avail’,’ DNS_any_Avail’,’Connectivity_any_Avail’,’ Authentication_any_Avail’,’EMailExternal_any_Avail’]
399
400
;
401
_service_func_QoSParam == ’WebMail_ReceiveEMail_Avail’, _dependent_services = [’ EMail_ReceiveEMailSentFromMWN_Avail’,’ EMail_ReceiveEMailSentFromOutsideMWN_Avail’,’ WebHosting_any_Avail’]
402 403
;
404
_service_func_QoSParam == ’WebMail_SentEMail_Avail’, _dependent_services = [’ EMail_SendEMailFromOutsideMWNToMWN_Avail’,’ EMail_SendEMailFromOutsideMWNToOutsideMWN_Avail’,’ WebHosting_any_Avail’]
405 406
;
407
_service_func_QoSParam == ’ EMail_ReceiveEMailSentFromMWN_Delay’, _dependent_services = [’ EMail_ReceiveEMailSentFromMWN_Avail’,’ EMail_any_DelayInt’,’EMail_ReceiveEMail_DelayInt’,’ Storage_any_Delay’,’Firewall_any_Delay’,’ DNS_any_Delay’,’Connectivity_any_Delay’,’
408
409
266
Authentication_any_Delay’] 410
; _service_func_QoSParam == ’ EMail_ReceiveEMailSentFromOutsideMWN_Delay’, _dependent_services = [’ EMail_ReceiveEMailSentFromOutsideMWN_Avail’,’ EMail_any_DelayInt’,’EMail_ReceiveEMail_DelayInt’,’ EMail_ReceiveEMailSentFromOutsideMWN_DelayInt’,’ Storage_any_Delay’,’Firewall_any_Delay’,’ DNS_any_Delay’,’Connectivity_any_Delay’,’ Authentication_any_Delay’,’EMailExternal_any_Delay’]
411
412
413
; _service_func_QoSParam == ’ EMail_SendEMailFromMWNToMWN_Delay’, _dependent_services = [’ EMail_SendEMailFromMWNToMWN_Avail’,’ EMail_any_DelayInt’,’Storage_any_Delay’,’ Firewall_any_Delay’,’DNS_any_Delay’,’ Connectivity_any_Delay’]
414
415
416
; _service_func_QoSParam == ’ EMail_SendEMailFromOutsideMWNToMWN_Delay’, _dependent_services = [’ EMail_SendEMailFromOutsideMWNToMWN_Avail’,’ EMail_any_DelayInt’,’Storage_any_Delay’,’ Firewall_any_Delay’,’DNS_any_Delay’,’ Connectivity_any_Delay’,’Authentication_any_Delay’]
417
418
419
; _service_func_QoSParam == ’ EMail_SendEMailFromMWNToOutsideMWN_Delay’, _dependent_services = [’ EMail_SendEMailFromMWNToOutsideMWN_Avail’,’ EMail_any_DelayInt’,’Storage_any_Delay’,’ Firewall_any_Delay’,’DNS_any_Delay’,’ Connectivity_any_Delay’,’EMailExternal_any_Delay’]
420
421
422
; _service_func_QoSParam == ’ EMail_SendFromOutsideMWNToOutsideMWN_Delay’, _dependent_services = [’ EMail_SendFromOutsideMWNToOutsideMWN_Avail’,’ EMail_any_DelayInt’,’Storage_any_Delay’,’ Firewall_any_Delay’,’DNS_any_Delay’,’ Connectivity_any_Delay’,’Authentication_any_Delay’,’ EMailExternal_any_Delay’]
423
424
425
; _service_func_QoSParam == ’EMail_any_DelayInt’, _dependent_services = [’EMail_any_AvailInt’]
426 427 428
; _service_func_QoSParam == ’EMail_ReceiveEMail_DelayInt ’, _dependent_services = [’EMail_ReceiveEMail_AvailInt’]
429
430 431 432
433
; _service_func_QoSParam == ’ EMail_ReceiveEMailSentFromOutsideMWN_DelayInt’, _dependent_services = [’ EMail_ReceiveEMailSentFromOutsideMWN_AvailInt’]
267
Appendix B. Tivoli Enterprise Console Implementation Code ;
434
_service_func_QoSParam == ’WebMail_ReceiveEMail_Delay’, _dependent_services = [’WebMail_ReceiveEMail_Avail’,’ EMail_ReceiveEMailSentFromMWN_Delay’,’ EMail_ReceiveEMailSentFromOutsideMWN_Delay’,’ WebHosting_any_Delay’]
435 436
;
437
_service_func_QoSParam == ’WebMail_SentEMail_Delay’, _dependent_services = [’WebMail_SentEMail_Avail’,’ EMail_SendEMailFromOutsideMWNToMWN_Delay’,’ EMail_SendEMailFromOutsideMWNToOutsideMWN_Delay’,’ WebHosting_any_Delay’]
438 439
),
440 441
length(_dependent_services, _dependent_length), sprintf(_tmp, ’%u’, _dependent_length), tl_fmt(lrz_tl, ’\t...%s dependent subservices for %s identified\n’, [_tmp, _service_func_QoSParam]),
442 443 444
445
% Set global correlation var set_global_var(’lrz_correlation’, ’dependent_services’, _dependent_services),
446 447
448
% Search for cause events not empty_list(_dependent_services), ( tl_str(lrz_tl, ’\t...searching for cause events...\n’), all_instances( event: _cause_event of_class within _cause_classes where [ status: outside [’CLOSED’], service_func_QoSParam: _cause_service within _dependent_services, date_reception: _cause_date outside _linked_cause_dates ], _event -600 -600 ),
449 450 451 452 453 454 455 456 457 458
459
460 461 462 463
bo_get_class_of(_cause_event, _cause_class), tl_fmt(lrz_tl, ’\t...found %s event on service %s\n’, [ _cause_class, _cause_service]),
464 465
466
% Remove this _cause_service from list of dependents _default = [], get_global_var(’lrz_correlation’, ’dependent_services’, _new_dependent_services, _default), delete(_new_dependent_services, _cause_service, _restof_dependent_services), set_global_var(’lrz_correlation’, ’dependent_services’, _restof_dependent_services),
467 468 469
470
471
472
% Generate linked event generate_event(’TEC_LRZ_LINKED_EVENT’, [
473 474 475
268
effect_service=_service_func_QoSParam, effect_event_handle=_event_handle, effect_event_date=_date, effect_class=_class, cause_event_handle=_cause_event_handle, cause_event_date=_cause_date, cause_class=_cause_class
476 477 478 479 480 481 482
] ), tl_str(lrz_tl, ’\t...TEC_LRZ_LINKED_EVENT generated\n’)
483 484 485
) ),
486 487 488 489
reception_action: check_service_restlist: ( % Get list of dependent services _default = [], get_global_var(’lrz_correlation’, ’dependent_services’, _probe_services, _default), length(_probe_services, _l), sprintf(_tmp, ’%u’, _l), ( _l > 0, generate_event(’TEC_LRZ_ACTIVE_PROBING_EVENT’, [ sender_handle=_event_handle, sender_date=_date, services=_probe_services ] ), tl_fmt(lrz_tl, ’\t...TEC_LRZ_ACTIVE_PROBING_EVENT generated for %s service(s)\n’, _tmp) ; _l == 0, tl_str(lrz_tl, ’\t...no services found for active probing\n’)%, %change_event_status(_event, ’CLOSED’) ) ),
490 491 492 493 494
495 496 497 498 499 500 501 502 503 504 505 506
507 508 509
510 511 512 513
action: exit_services: ( tl_str(lrz_tl, ’\t\n’) ),
514 515 516 517 518
action: exit_rule: ( tl_str(lrz_tl, ’\n’) )
519 520 521 522 523
).
524 525 526
%---------------------------------------------------------------
527
% Rule to request redo analysis of service event
269
Appendix B. Tivoli Enterprise Console Implementation Code 528
%---------------------------------------------------------------
529
rule: service_handler: ( event: _event of_class _class within [’TEC_LRZ_SERVICEFUNC_QOS_NOK’,’ TEC_LRZ_SERVICEFUNC_QOS_OK’,’TEC_LRZ_SERVICE_QOS_NOK’,’ TEC_LRZ_SERVICE_QOS_OK’] where [ status: outside [’CLOSED’], service_func_QoSParam: _service_func_QoSParam ],
530 531 532
533 534 535 536 537
reception_action: ( tl_str(lrz_tl, ’\n\n’),
538 539 540 541
% Request redoanalysis of events previous to this tl_fmt(lrz_tl, ’\t...searching for AP event for service func %s...\n’, _service_func_QoSParam), all_instances( event: _ap_event of_class ’TEC_LRZ_ACTIVE_PROBING_SERVICE’ where [ status: outside [’CLOSED’], service: equals _service_func_QoSParam, sender_handle: _sender_handle, sender_date: _sender_date ], _event -600 -0 ),
542 543
544 545 546 547 548 549 550 551 552 553 554 555
change_event_status(_ap_event, ’CLOSED’), tl_str(lrz_tl, ’\t...searching for service event\n’), first_instance( event: _se_event of_class within [ ’TEC_LRZ_SERVICE_QOS_NOK’, ’TEC_LRZ_SERVICEFUNC_QOS_NOK’ ] where [ status: outside [’CLOSED’], date_reception: equals _sender_date, event_handle: equals _sender_handle ] ), tl_str(lrz_tl, ’\t...request redo analysis of previous service event\n’), redo_analysis(_se_event) ),
556 557 558 559 560 561 562 563 564 565 566 567 568 569 570
571 572 573
reception_action: ( tl_str(lrz_tl, ’\n’) )
574 575 576 577 578
).
270
579 580
%---------------------------------------------------------------
581
% Rule to request redo analysis of resource event %---------------------------------------------------------------
582
583 584 585 586 587 588 589 590
rule: resource_handler: ( event: _event of_class _class within [’TEC_LRZ_RESOURCE_QOR_NOK’] where [ status: outside [’CLOSED’], resource_QoRParam: _resource_QoRParam ],
591 592 593 594
reception_action: ( tl_str(lrz_tl, ’\n\n’),
595 596 597
598 599 600 601 602 603 604 605 606 607 608
% Request redoanalysis of events previous to this tl_fmt(lrz_tl, ’\t...searching for AP event for resource %s...\n’, _resource_QoRParam), all_instances( event: _ap_event of_class ’TEC_LRZ_ACTIVE_PROBING_RESOURCE’ where [ status: outside [’CLOSED’], resource: equals _resource_QoRParam, sender_handle: _sender_handle, sender_date: _sender_date ], _event -600 -0 ),
609 610 611
612 613 614 615 616 617 618 619 620 621 622 623 624 625 626
627 628
sprintf(_tmp, ’%u’, _sender_date), tl_fmt(lrz_tl, ’\t...found AP event for %s with date %s\n ’, [_resource_QoRParam, _tmp]), change_event_status(_ap_event, ’CLOSED’), tl_str(lrz_tl, ’\t...searching for service event\n’), first_instance( event: _se_event of_class within [ ’TEC_LRZ_SERVICE_QOS_NOK’, ’TEC_LRZ_SERVICEFUNC_QOS_NOK’ ] where [ status: within [’ACK’], date_reception: equals _sender_date, event_handle: equals _sender_handle ] ), tl_str(lrz_tl, ’\t...request redo analysis of previous service event\n’), redo_analysis(_se_event) ),
629
271
Appendix B. Tivoli Enterprise Console Implementation Code reception_action: ( tl_str(lrz_tl, ’\n’) )
630 631 632 633 634
).
635 636 637
%---------------------------------------------------------------
638
% Rule to link events %---------------------------------------------------------------
639
640 641 642 643 644 645 646 647 648 649 650 651 652 653
rule: linking: ( event: _event of_class _class within [’TEC_LRZ_LINKED_EVENT’] where [ status: outside [’CLOSED’], effect_service: _effect_service, effect_event_handle: _effect_event_handle, effect_event_date: _effect_event_date, effect_class: _effect_class, cause_event_handle: _cause_event_handle, cause_event_date: _cause_event_date, cause_class: _cause_class ],
654 655 656 657
action: setup: ( tl_str(lrz_tl, ’\n\n’),
658
% Search for effect event tl_fmt(lrz_tl, ’\t...searching for effect event %s...\n’, _effect_class), first_instance( event: _effect_event of_class _effect_class within [ ’TEC_LRZ_SERVICE_QOS_NOK’, ’TEC_LRZ_SERVICEFUNC_QOS_NOK’ ] where [ event_handle: equals _effect_event_handle, date_reception: equals _effect_event_date ] ), tl_fmt(lrz_tl, ’\t...found %s event\n’, [_effect_class]),
659 660
661 662 663 664 665 666 667 668 669 670 671 672 673
% Need to get attributes, because of compiler warning message bo_get_slotval(_effect_event, ’linked_cause_dates’, _linked_cause_dates), bo_get_slotval(_effect_event, ’linked_cause_handles’, _linked_cause_handles),
674
675
676
677
% Add cause handle and date to effect event to link them (
678 679
272
not empty_list(_linked_cause_handles), append([_cause_event_handle], _linked_cause_handles, _tmp_h), append([_cause_event_date], _linked_cause_dates, _tmp_d )
680 681
682
;
683
empty_list(_linked_cause_handles), _tmp_h = [_cause_event_handle], _tmp_d = [_cause_event_date]
684 685 686
),
687 688
% Update effect event bo_set_slotval(_effect_event, ’linked_cause_handles’, _tmp_h), bo_set_slotval(_effect_event, ’linked_cause_dates’, _tmp_d), tl_str(lrz_tl, ’\t...Events correlated!\n’) ),
689 690
691
692 693 694
action: end: ( change_event_status(_event, ’CLOSED’), tl_str(lrz_tl, ’\n’) )
695 696 697 698 699 700
).
701 702 703
%---------------------------------------------------------------
704
% Rule to generate specific active probing events %---------------------------------------------------------------
705
706 707 708 709 710 711 712 713 714 715 716
rule: active_probing: ( event: _event of_class _class within [’TEC_LRZ_ACTIVE_PROBING_EVENT’] where [ status: outside [’CLOSED’], services: _services, resources: _resources, sender_handle: _sender_handle, sender_date: _sender_date ],
717 718 719 720 721 722 723 724 725 726 727 728 729
action: ( tl_str(lrz_tl, ’\n\n’), length(_services, _ls), length(_resources, _rs), ( _ls > 0, rremove(_service, _services, _new_services), generate_event(’TEC_LRZ_ACTIVE_PROBING_SERVICE’, [ service=_service, sender_handle=_sender_handle,
273
Appendix B. Tivoli Enterprise Console Implementation Code sender_date=_sender_date
730
]
731
), tl_fmt(lrz_tl, ’\t...TEC_LRZ_ACTIVE_PROBING_SERVICE event for %s generated\n’, _service), bo_set_slotval(_event, ’service’, _new_services), tl_str(lrz_tl, ’nach slotval__S’), redo_analysis(_event)
732 733
734 735 736
;
737
_rs > 0, rremove(_resource, _resources, _new_resources), generate_event(’TEC_LRZ_ACTIVE_PROBING_RESOURCE’, [ sender_date=_sender_date, sender_handle=_sender_handle, resource=_resource ] ), tl_fmt(lrz_tl, ’\t...TEC_LRZ_ACTIVE_PROBING_RESOURCE event for %s generated\n’, _resource), bo_set_slotval(_event, ’resource’, _new_resources), redo_analysis(_event)
738 739 740 741 742 743 744 745 746 747
748 749
) ),
750 751 752
action: exit_rule: ( change_event_status(_event, ’CLOSED’), drop_received_event, tl_str(lrz_tl, ’\n’) )
753 754 755 756 757 758 759
).
760 761 762
%---------------------------------------------------------------
763
% Timer rule for expiration of service events %---------------------------------------------------------------
764
765 766 767 768 769 770 771
timer_rule: timer_expiration: ( event: _event of_class _class where [ event_handle: _event_handle, date_reception: _date ],
772 773
timer_info: equals ’ServiceEvent_expiration’,
774 775 776 777
action: ( tl_fmt(lrz_tl, ’\nServiceEvent %s expired.\n’, [_class]),
778
% Search for cause event ( first_instance(
779 780 781
274
event: _pc_event of_class ’TEC_LRZ_LINKED_EVENT’ where [ effect_event_handle: equals _event_handle, effect_event_date: equals _date, cause_class: _cause_class ]
782 783 784 785 786 787 788
), tl_fmt(lrz_tl, ’Linked event %s was found.\n’, _cause_class)
789 790
;
791
% No causes found for this service event % -> forward to administrator / case-based reasoner tl_str(lrz_tl, ’No linked event found.\n’)
792 793 794
),
795 796
change_event_status(_event, ’CLOSED’), tl_fmt(lrz_tl, ’%s event closed\n’, _class)
797 798
)
799 800
).
Example correlation for the Web Hosting Service In addition to the verbal description in 6.2.3, the log file for the correlation example for the Web Hosting Service is provided here. Listing B.3: Log file for the first example correlation 1 2 3
...searching for AP event for resource zope1_Avail...
4 5 6 7
...processing TEC_LRZ_SERVICE_QOS_OK event
8 9 10
11
...searching for AP event for service func Firewall_any_Avail...
12 13 14 15
...processing TEC_LRZ_SERVICE_QOS_OK event
16 17 18
19
...searching for AP event for service func Connectivity_any_Avail...
20 21 22 23
...processing TEC_LRZ_SERVICEFUNC_QOS_NOK event
24 25
275
Appendix B. Tivoli Enterprise Console Implementation Code 26 27 28 29 30 31
32 33
34
35
36 37
...cause classes identified ...no resources found for active probing ...6 dependent subservices for WebHostingWithZope_StaticWebPageRetrieval_Avail identified ...searching for cause events... ...found TEC_LRZ_SERVICE_QOS_OK event on service Connectivity_any_Avail ...found TEC_LRZ_SERVICE_QOS_OK event on service Firewall_any_Avail ...TEC_LRZ_ACTIVE_PROBING_EVENT generated for 4 service(s)
38 39 40
41
...searching for AP event for service func WebHostingWithZope_StaticWebPageRetrieval_Avail...
42 43 44
45
46
47
48
...TEC_LRZ_ACTIVE_PROBING_SERVICE event for WebHostingWithZope_any_AvailInt generated ...TEC_LRZ_ACTIVE_PROBING_SERVICE event for WebHosting_any_AvailInt generated ...TEC_LRZ_ACTIVE_PROBING_SERVICE event for Storage_any_Avail generated ...TEC_LRZ_ACTIVE_PROBING_SERVICE event for DNS_any_Avail generated
49 50 51 52
...processing TEC_LRZ_SERVICE_QOS_OK event
53 54 55
56 57 58
...searching for AP event for service func WebHosting_any_AvailInt... ...searching for service event ...request redo analysis of previous service event
59 60 61 62
...processing TEC_LRZ_SERVICEFUNC_QOS_NOK event
63 64
65 66 67 68
...cause classes identified
276
69
70 71
72
73
74 75
...6 dependent subservices for WebHostingWithZope_StaticWebPageRetrieval_Avail identified ...searching for cause events... ...found TEC_LRZ_SERVICE_QOS_OK event on service Connectivity_any_Avail ...found TEC_LRZ_SERVICE_QOS_OK event on service WebHosting_any_AvailInt ...found TEC_LRZ_SERVICE_QOS_OK event on service Firewall_any_Avail
76 77 78 79
...processing TEC_LRZ_SERVICE_QOS_NOK event
80 81
82 83 84
85 86
87 88
89 90 91 92 93 94 95
...cause classes identified ...4 dependent resources for service WebHostingWithZope_any_AvailInt identified ...searching for cause events... ...found TEC_LRZ_RESOURCE_QOR_OK event on resource swk2-2wr_Avail ...TEC_LRZ_LINKED_EVENT generated ...found TEC_LRZ_RESOURCE_QOR_NOK event on resource zope1_Avail ...TEC_LRZ_LINKED_EVENT generated ...active probing event generated for 2 resource(s) ...no services found for active probing
96 97 98
99 100 101
...searching for AP event for service func WebHostingWithZope_any_AvailInt... ...searching for service event ...request redo analysis of previous service event
102 103 104
105 106 107
...searching for effect event TEC_LRZ_SERVICE_QOS_NOK ... ...found TEC_LRZ_SERVICE_QOS_NOK event ...Events correlated!
108 109 110
111 112
...searching for effect event TEC_LRZ_SERVICE_QOS_NOK ... ...found TEC_LRZ_SERVICE_QOS_NOK event ...Events correlated!
277
Appendix B. Tivoli Enterprise Console Implementation Code 113
114 115 116
117
118
...TEC_LRZ_ACTIVE_PROBING_RESOURCE event for swk3-2 wr_Avail generated ...TEC_LRZ_ACTIVE_PROBING_RESOURCE event for zope2_Avail generated
119 120 121 122
...processing TEC_LRZ_SERVICEFUNC_QOS_NOK event
123 124
125 126 127 128 129
130 131
132
133
134
135 136
...cause classes identified ...6 dependent subservices for WebHostingWithZope_StaticWebPageRetrieval_Avail identified ...searching for cause events... ...found TEC_LRZ_SERVICE_QOS_OK event on service Connectivity_any_Avail ...found TEC_LRZ_SERVICE_QOS_OK event on service WebHosting_any_AvailInt ...found TEC_LRZ_SERVICE_QOS_OK event on service Firewall_any_Avail ...found TEC_LRZ_SERVICE_QOS_NOK event on service WebHostingWithZope_any_AvailInt
137 138 139 140
...processing TEC_LRZ_SERVICE_QOS_OK event
141 142 143
144 145 146
...searching for AP event for service func Storage_any_Avail... ...searching for service event ...request redo analysis of previous service event
147 148 149 150
...processing TEC_LRZ_SERVICEFUNC_QOS_NOK event
151 152
153 154 155 156
...cause classes identified
278
157
158 159
160
161
162
163
164 165
...6 dependent subservices for WebHostingWithZope_StaticWebPageRetrieval_Avail identified ...searching for cause events... ...found TEC_LRZ_SERVICE_QOS_OK event on service Connectivity_any_Avail ...found TEC_LRZ_SERVICE_QOS_OK event on service WebHosting_any_AvailInt ...found TEC_LRZ_SERVICE_QOS_OK event on service Firewall_any_Avail ...found TEC_LRZ_SERVICE_QOS_NOK event on service WebHostingWithZope_any_AvailInt ...found TEC_LRZ_SERVICE_QOS_OK event on service Storage_any_Avail
166 167 168 169
...processing TEC_LRZ_SERVICE_QOS_OK event
170 171 172
173 174 175
...searching for AP event for service func DNS_any_Avail... ...searching for service event ...request redo analysis of previous service event
176 177 178 179
...processing TEC_LRZ_SERVICEFUNC_QOS_NOK event
180 181
182 183 184 185 186
187 188
189
190
191
192
193
194 195
...cause classes identified ...6 dependent subservices for WebHostingWithZope_StaticWebPageRetrieval_Avail identified ...searching for cause events... ...found TEC_LRZ_SERVICE_QOS_OK event on service Connectivity_any_Avail ...found TEC_LRZ_SERVICE_QOS_OK event on service WebHosting_any_AvailInt ...found TEC_LRZ_SERVICE_QOS_OK event on service Firewall_any_Avail ...found TEC_LRZ_SERVICE_QOS_NOK event on service WebHostingWithZope_any_AvailInt ...found TEC_LRZ_SERVICE_QOS_OK event on service Storage_any_Avail ...found TEC_LRZ_SERVICE_QOS_OK event on service DNS_any_Avail
279
Appendix B. Tivoli Enterprise Console Implementation Code Example correlation for the E-Mail Service Similar to the example for the Web Hosting Service, the correlation log file for the E-Mail Service correlation example is provided here. Listing B.4: Log file for the second example correlation 1 2 3
...processing TEC_LRZ_SERVICEFUNC_QOS_NOK event
4 5 6 7 8 9 10 11
12 13
14 15
...cause classes identified ...no resources found for active probing ...4 dependent subservices for WebMail_ReceiveEMail_Delay identified ...searching for cause events... ...TEC_LRZ_ACTIVE_PROBING_EVENT generated for 4 service(s)
16 17 18
19
...searching for AP event for service func WebMail_ReceiveEMail_Delay...
20 21 22
23
24
25
26
...TEC_LRZ_ACTIVE_PROBING_SERVICE event for WebMail_ReceiveEMail_Avail generated ...TEC_LRZ_ACTIVE_PROBING_SERVICE event for EMail_ReceiveEMailSentFromMWN_Delay generated ...TEC_LRZ_ACTIVE_PROBING_SERVICE event for EMail_ReceiveEMailSentFromOutsideMWN_Delay generated ...TEC_LRZ_ACTIVE_PROBING_SERVICE event for WebHosting_any_Delay generated
27 28 29 30
...processing TEC_LRZ_SERVICEFUNC_QOS_OK event
31 32 33
34 35 36
...searching for AP event for service func WebMail_ReceiveEMail_Avail... ...searching for service event ...request redo analysis of previous service event
37 38 39 40
...processing TEC_LRZ_SERVICEFUNC_QOS_NOK event
41 42
280
43 44 45 46 47
48 49
50 51
...cause classes identified ...4 dependent subservices for WebMail_ReceiveEMail_Delay identified ...searching for cause events... ...found TEC_LRZ_SERVICEFUNC_QOS_OK event on service WebMail_ReceiveEMail_Avail
52 53 54 55
...processing TEC_LRZ_SERVICEFUNC_QOS_NOK event
56 57
58 59 60 61 62 63
64 65
66 67
...cause classes identified ...no resources found for active probing ...10 dependent subservices for EMail_ReceiveEMailSentFromOutsideMWN_Delay identified ...searching for cause events... ...TEC_LRZ_ACTIVE_PROBING_EVENT generated for 10 service(s)
68 69 70
71 72 73
...searching for AP event for service func EMail_ReceiveEMailSentFromOutsideMWN_Delay... ...searching for service event ...request redo analysis of previous service event
74 75 76
77
78
79
80
81
82
...TEC_LRZ_ACTIVE_PROBING_SERVICE event for EMail_ReceiveEMailSentFromOutsideMWN_Avail generated ...TEC_LRZ_ACTIVE_PROBING_SERVICE event for EMail_any_DelayInt generated ...TEC_LRZ_ACTIVE_PROBING_SERVICE event for EMail_ReceiveEMail_DelayInt generated ...TEC_LRZ_ACTIVE_PROBING_SERVICE event for EMail_ReceiveEMailSentFromOutsideMWN_DelayInt generated ...TEC_LRZ_ACTIVE_PROBING_SERVICE event for Storage_any_Delay generated ...TEC_LRZ_ACTIVE_PROBING_SERVICE event for Firewall_any_Delay generated ...TEC_LRZ_ACTIVE_PROBING_SERVICE event for DNS_any_Delay generated
281
Appendix B. Tivoli Enterprise Console Implementation Code 83
84
85
86
...TEC_LRZ_ACTIVE_PROBING_SERVICE event for Connectivity_any_Delay generated ...TEC_LRZ_ACTIVE_PROBING_SERVICE event for Authentication_any_Delay generated ...TEC_LRZ_ACTIVE_PROBING_SERVICE event for EMailExternal_any_Delay generated
87 88 89 90
...processing TEC_LRZ_SERVICEFUNC_QOS_NOK event
91 92 93 94 95 96 97
98 99
100
101 102
...cause classes identified ...4 dependent subservices for WebMail_ReceiveEMail_Delay identified ...searching for cause events... ...found TEC_LRZ_SERVICEFUNC_QOS_OK event on service WebMail_ReceiveEMail_Avail ...found TEC_LRZ_SERVICEFUNC_QOS_NOK event on service EMail_ReceiveEMailSentFromOutsideMWN_Delay
103 104 105 106
...processing TEC_LRZ_SERVICE_QOS_OK event
107 108 109
110 111 112
...searching for AP event for service func WebHosting_any_Delay... ...searching for service event ...request redo analysis of previous service event
113 114 115 116
...processing TEC_LRZ_SERVICEFUNC_QOS_NOK event
117 118 119 120 121 122 123
124 125
126
127
...cause classes identified ...4 dependent subservices for WebMail_ReceiveEMail_Delay identified ...searching for cause events... ...found TEC_LRZ_SERVICEFUNC_QOS_OK event on service WebMail_ReceiveEMail_Avail ...found TEC_LRZ_SERVICEFUNC_QOS_NOK event on service EMail_ReceiveEMailSentFromOutsideMWN_Delay ...found TEC_LRZ_SERVICE_QOS_OK event on service WebHosting_any_Delay
282
128 129
130 131 132 133
...processing TEC_LRZ_SERVICEFUNC_QOS_NOK event
134 135
136 137 138 139 140 141
142 143
144 145
...cause classes identified ...no resources found for active probing ...8 dependent subservices for EMail_ReceiveEMailSentFromMWN_Delay identified ...searching for cause events... ...TEC_LRZ_ACTIVE_PROBING_EVENT generated for 8 service(s)
146 147 148
149 150 151
...searching for AP event for service func EMail_ReceiveEMailSentFromMWN_Delay... ...searching for service event ...request redo analysis of previous service event
152 153 154
155
156
157
158
159
160
161
162
...TEC_LRZ_ACTIVE_PROBING_SERVICE event for EMail_ReceiveEMailSentFromMWN_Avail generated ...TEC_LRZ_ACTIVE_PROBING_SERVICE event for EMail_any_DelayInt generated ...TEC_LRZ_ACTIVE_PROBING_SERVICE event for EMail_ReceiveEMail_DelayInt generated ...TEC_LRZ_ACTIVE_PROBING_SERVICE event for Storage_any_Delay generated ...TEC_LRZ_ACTIVE_PROBING_SERVICE event for Firewall_any_Delay generated ...TEC_LRZ_ACTIVE_PROBING_SERVICE event for DNS_any_Delay generated ...TEC_LRZ_ACTIVE_PROBING_SERVICE event for Connectivity_any_Delay generated ...TEC_LRZ_ACTIVE_PROBING_SERVICE event for Authentication_any_Delay generated
163 164 165 166
...processing TEC_LRZ_SERVICEFUNC_QOS_NOK event
167 168 169 170 171
...cause classes identified
283
Appendix B. Tivoli Enterprise Console Implementation Code 172 173
174 175
176
177
178
179 180
...4 dependent subservices for WebMail_ReceiveEMail_Delay identified ...searching for cause events... ...found TEC_LRZ_SERVICEFUNC_QOS_OK event on service WebMail_ReceiveEMail_Avail ...found TEC_LRZ_SERVICEFUNC_QOS_NOK event on service EMail_ReceiveEMailSentFromOutsideMWN_Delay ...found TEC_LRZ_SERVICE_QOS_OK event on service WebHosting_any_Delay ...found TEC_LRZ_SERVICEFUNC_QOS_NOK event on service EMail_ReceiveEMailSentFromMWN_Delay
181 182 183 184
...processing TEC_LRZ_SERVICEFUNC_QOS_OK event
185 186 187
188 189 190
...searching for AP event for service func EMail_ReceiveEMailSentFromOutsideMWN_Avail... ...searching for service event ...request redo analysis of previous service event
191 192 193 194
...processing TEC_LRZ_SERVICEFUNC_QOS_NOK event
195 196
197 198 199 200 201
202 203
204 205
...cause classes identified ...10 dependent subservices for EMail_ReceiveEMailSentFromOutsideMWN_Delay identified ...searching for cause events... ...found TEC_LRZ_SERVICEFUNC_QOS_OK event on service EMail_ReceiveEMailSentFromOutsideMWN_Avail
206 207 208 209
...processing TEC_LRZ_SERVICEFUNC_QOS_OK event
210 211 212
213 214 215
...searching for AP event for service func EMail_ReceiveEMailSentFromMWN_Avail... ...searching for service event ...request redo analysis of previous service event
216
284
217 218 219
...processing TEC_LRZ_SERVICEFUNC_QOS_NOK event
220 221
222 223 224 225 226
227 228
229 230
...cause classes identified ...8 dependent subservices for EMail_ReceiveEMailSentFromMWN_Delay identified ...searching for cause events... ...found TEC_LRZ_SERVICEFUNC_QOS_OK event on service EMail_ReceiveEMailSentFromMWN_Avail
231 232 233 234
...processing TEC_LRZ_SERVICEFUNC_QOS_OK event
235 236 237
238 239 240 241 242
...searching for AP event for service func EMail_ReceiveEMail_DelayInt... ...searching for service event ...request redo analysis of previous service event ...searching for service event ...request redo analysis of previous service event
243 244 245 246
...processing TEC_LRZ_SERVICEFUNC_QOS_NOK event
247 248
249 250 251 252 253
254 255
256
257 258
...cause classes identified ...8 dependent subservices for EMail_ReceiveEMailSentFromMWN_Delay identified ...searching for cause events... ...found TEC_LRZ_SERVICEFUNC_QOS_OK event on service EMail_ReceiveEMailSentFromMWN_Avail ...found TEC_LRZ_SERVICEFUNC_QOS_OK event on service EMail_ReceiveEMail_DelayInt
259 260 261 262
...processing TEC_LRZ_SERVICEFUNC_QOS_NOK event
263
285
Appendix B. Tivoli Enterprise Console Implementation Code 264
265 266 267 268 269
270 271
272
273 274
...cause classes identified ...10 dependent subservices for EMail_ReceiveEMailSentFromOutsideMWN_Delay identified ...searching for cause events... ...found TEC_LRZ_SERVICEFUNC_QOS_OK event on service EMail_ReceiveEMailSentFromOutsideMWN_Avail ...found TEC_LRZ_SERVICEFUNC_QOS_OK event on service EMail_ReceiveEMail_DelayInt
275 276 277 278
...processing TEC_LRZ_SERVICEFUNC_QOS_OK event
279 280 281
282 283 284
...searching for AP event for service func EMail_ReceiveEMailSentFromOutsideMWN_DelayInt... ...searching for service event ...request redo analysis of previous service event
285 286 287 288
...processing TEC_LRZ_SERVICEFUNC_QOS_NOK event
289 290
291 292 293 294 295
296 297
298
299
300 301
...cause classes identified ...10 dependent subservices for EMail_ReceiveEMailSentFromOutsideMWN_Delay identified ...searching for cause events... ...found TEC_LRZ_SERVICEFUNC_QOS_OK event on service EMail_ReceiveEMailSentFromOutsideMWN_Avail ...found TEC_LRZ_SERVICEFUNC_QOS_OK event on service EMail_ReceiveEMail_DelayInt ...found TEC_LRZ_SERVICEFUNC_QOS_OK event on service EMail_ReceiveEMailSentFromOutsideMWN_DelayInt
302 303 304 305
...processing TEC_LRZ_SERVICE_QOS_OK event
306 307
286
308
309 310 311 312 313
...searching for AP event for service func Storage_any_Delay... ...searching for service event ...request redo analysis of previous service event ...searching for service event ...request redo analysis of previous service event
314 315 316 317
...processing TEC_LRZ_SERVICEFUNC_QOS_NOK event
318 319
320 321 322 323 324
325 326
327
328
329 330
...cause classes identified ...8 dependent subservices for EMail_ReceiveEMailSentFromMWN_Delay identified ...searching for cause events... ...found TEC_LRZ_SERVICEFUNC_QOS_OK event on service EMail_ReceiveEMailSentFromMWN_Avail ...found TEC_LRZ_SERVICEFUNC_QOS_OK event on service EMail_ReceiveEMail_DelayInt ...found TEC_LRZ_SERVICE_QOS_OK event on service Storage_any_Delay
331 332 333 334
...processing TEC_LRZ_SERVICEFUNC_QOS_NOK event
335 336
337 338 339 340 341
342 343
344
345
346
347 348
...cause classes identified ...10 dependent subservices for EMail_ReceiveEMailSentFromOutsideMWN_Delay identified ...searching for cause events... ...found TEC_LRZ_SERVICEFUNC_QOS_OK event on service EMail_ReceiveEMailSentFromOutsideMWN_Avail ...found TEC_LRZ_SERVICEFUNC_QOS_OK event on service EMail_ReceiveEMail_DelayInt ...found TEC_LRZ_SERVICEFUNC_QOS_OK event on service EMail_ReceiveEMailSentFromOutsideMWN_DelayInt ...found TEC_LRZ_SERVICE_QOS_OK event on service Storage_any_Delay
349 350
287
Appendix B. Tivoli Enterprise Console Implementation Code 351 352
...processing TEC_LRZ_SERVICE_QOS_OK event
353 354 355
356 357 358 359 360
...searching for AP event for service func Firewall_any_Delay... ...searching for service event ...request redo analysis of previous service event ...searching for service event ...request redo analysis of previous service event
361 362 363 364
...processing TEC_LRZ_SERVICEFUNC_QOS_NOK event
365 366
367 368 369 370 371
372 373
374
375
376
377 378
...cause classes identified ...8 dependent subservices for EMail_ReceiveEMailSentFromMWN_Delay identified ...searching for cause events... ...found TEC_LRZ_SERVICEFUNC_QOS_OK event on service EMail_ReceiveEMailSentFromMWN_Avail ...found TEC_LRZ_SERVICEFUNC_QOS_OK event on service EMail_ReceiveEMail_DelayInt ...found TEC_LRZ_SERVICE_QOS_OK event on service Storage_any_Delay ...found TEC_LRZ_SERVICE_QOS_OK event on service Firewall_any_Delay
379 380 381 382
...processing TEC_LRZ_SERVICEFUNC_QOS_NOK event
383 384
385 386 387 388 389
390 391
392
393
...cause classes identified ...10 dependent subservices for EMail_ReceiveEMailSentFromOutsideMWN_Delay identified ...searching for cause events... ...found TEC_LRZ_SERVICEFUNC_QOS_OK event on service EMail_ReceiveEMailSentFromOutsideMWN_Avail ...found TEC_LRZ_SERVICEFUNC_QOS_OK event on service EMail_ReceiveEMail_DelayInt ...found TEC_LRZ_SERVICEFUNC_QOS_OK event on service EMail_ReceiveEMailSentFromOutsideMWN_DelayInt
288
394
395
396 397
...found TEC_LRZ_SERVICE_QOS_OK event on service Storage_any_Delay ...found TEC_LRZ_SERVICE_QOS_OK event on service Firewall_any_Delay
398 399 400 401
...processing TEC_LRZ_SERVICE_QOS_OK event
402 403 404
405 406 407 408 409
...searching for AP event for service func DNS_any_Delay... ...searching for service event ...request redo analysis of previous service event ...searching for service event ...request redo analysis of previous service event
410 411 412 413
...processing TEC_LRZ_SERVICEFUNC_QOS_NOK event
414 415
416 417 418 419 420
421 422
423
424
425
426
427 428
...cause classes identified ...8 dependent subservices for EMail_ReceiveEMailSentFromMWN_Delay identified ...searching for cause events... ...found TEC_LRZ_SERVICEFUNC_QOS_OK event on service EMail_ReceiveEMailSentFromMWN_Avail ...found TEC_LRZ_SERVICEFUNC_QOS_OK event on service EMail_ReceiveEMail_DelayInt ...found TEC_LRZ_SERVICE_QOS_OK event on service Storage_any_Delay ...found TEC_LRZ_SERVICE_QOS_OK event on service Firewall_any_Delay ...found TEC_LRZ_SERVICE_QOS_OK event on service DNS_any_Delay
429 430 431 432
...processing TEC_LRZ_SERVICEFUNC_QOS_NOK event
433 434
435 436 437 438
...cause classes identified
289
Appendix B. Tivoli Enterprise Console Implementation Code 439
440 441
442
443
444
445
446
447 448
...10 dependent subservices for EMail_ReceiveEMailSentFromOutsideMWN_Delay identified ...searching for cause events... ...found TEC_LRZ_SERVICEFUNC_QOS_OK event on service EMail_ReceiveEMailSentFromOutsideMWN_Avail ...found TEC_LRZ_SERVICEFUNC_QOS_OK event on service EMail_ReceiveEMail_DelayInt ...found TEC_LRZ_SERVICEFUNC_QOS_OK event on service EMail_ReceiveEMailSentFromOutsideMWN_DelayInt ...found TEC_LRZ_SERVICE_QOS_OK event on service Storage_any_Delay ...found TEC_LRZ_SERVICE_QOS_OK event on service Firewall_any_Delay ...found TEC_LRZ_SERVICE_QOS_OK event on service DNS_any_Delay
449 450 451 452
...processing TEC_LRZ_SERVICE_QOS_OK event
453 454 455
456 457 458 459 460
...searching for AP event for service func Connectivity_any_Delay... ...searching for service event ...request redo analysis of previous service event ...searching for service event ...request redo analysis of previous service event
461 462 463 464
...processing TEC_LRZ_SERVICEFUNC_QOS_NOK event
465 466
467 468 469 470 471
472 473
474
475
476
477
...cause classes identified ...8 dependent subservices for EMail_ReceiveEMailSentFromMWN_Delay identified ...searching for cause events... ...found TEC_LRZ_SERVICEFUNC_QOS_OK event on service EMail_ReceiveEMailSentFromMWN_Avail ...found TEC_LRZ_SERVICEFUNC_QOS_OK event on service EMail_ReceiveEMail_DelayInt ...found TEC_LRZ_SERVICE_QOS_OK event on service Storage_any_Delay ...found TEC_LRZ_SERVICE_QOS_OK event on service Firewall_any_Delay ...found TEC_LRZ_SERVICE_QOS_OK event on service DNS_any_Delay
290
478
479 480
...found TEC_LRZ_SERVICE_QOS_OK event on service Connectivity_any_Delay
481 482 483 484
...processing TEC_LRZ_SERVICEFUNC_QOS_NOK event
485 486
487 488 489 490 491
492 493
494
495
496
497
498
499
500 501
...cause classes identified ...10 dependent subservices for EMail_ReceiveEMailSentFromOutsideMWN_Delay identified ...searching for cause events... ...found TEC_LRZ_SERVICEFUNC_QOS_OK event on service EMail_ReceiveEMailSentFromOutsideMWN_Avail ...found TEC_LRZ_SERVICEFUNC_QOS_OK event on service EMail_ReceiveEMail_DelayInt ...found TEC_LRZ_SERVICEFUNC_QOS_OK event on service EMail_ReceiveEMailSentFromOutsideMWN_DelayInt ...found TEC_LRZ_SERVICE_QOS_OK event on service Storage_any_Delay ...found TEC_LRZ_SERVICE_QOS_OK event on service Firewall_any_Delay ...found TEC_LRZ_SERVICE_QOS_OK event on service DNS_any_Delay ...found TEC_LRZ_SERVICE_QOS_OK event on service Connectivity_any_Delay
502 503 504 505
...processing TEC_LRZ_SERVICE_QOS_OK event
506 507 508
509 510 511 512 513
...searching for AP event for service func Authentication_any_Delay... ...searching for service event ...request redo analysis of previous service event ...searching for service event ...request redo analysis of previous service event
514 515 516 517
...processing TEC_LRZ_SERVICEFUNC_QOS_NOK event
518 519
520
291
Appendix B. Tivoli Enterprise Console Implementation Code 521 522 523 524
525 526
527
528
529
530
531
532
533 534
...cause classes identified ...8 dependent subservices for EMail_ReceiveEMailSentFromMWN_Delay identified ...searching for cause events... ...found TEC_LRZ_SERVICEFUNC_QOS_OK event on service EMail_ReceiveEMailSentFromMWN_Avail ...found TEC_LRZ_SERVICEFUNC_QOS_OK event on service EMail_ReceiveEMail_DelayInt ...found TEC_LRZ_SERVICE_QOS_OK event on service Storage_any_Delay ...found TEC_LRZ_SERVICE_QOS_OK event on service Firewall_any_Delay ...found TEC_LRZ_SERVICE_QOS_OK event on service DNS_any_Delay ...found TEC_LRZ_SERVICE_QOS_OK event on service Connectivity_any_Delay ...found TEC_LRZ_SERVICE_QOS_OK event on service Authentication_any_Delay
535 536 537 538
...processing TEC_LRZ_SERVICEFUNC_QOS_NOK event
539 540
541 542 543 544 545
546 547
548
549
550
551
552
553
554
555 556
...cause classes identified ...10 dependent subservices for EMail_ReceiveEMailSentFromOutsideMWN_Delay identified ...searching for cause events... ...found TEC_LRZ_SERVICEFUNC_QOS_OK event on service EMail_ReceiveEMailSentFromOutsideMWN_Avail ...found TEC_LRZ_SERVICEFUNC_QOS_OK event on service EMail_ReceiveEMail_DelayInt ...found TEC_LRZ_SERVICEFUNC_QOS_OK event on service EMail_ReceiveEMailSentFromOutsideMWN_DelayInt ...found TEC_LRZ_SERVICE_QOS_OK event on service Storage_any_Delay ...found TEC_LRZ_SERVICE_QOS_OK event on service Firewall_any_Delay ...found TEC_LRZ_SERVICE_QOS_OK event on service DNS_any_Delay ...found TEC_LRZ_SERVICE_QOS_OK event on service Connectivity_any_Delay ...found TEC_LRZ_SERVICE_QOS_OK event on service Authentication_any_Delay
557
292
558 559 560
...processing TEC_LRZ_SERVICE_QOS_OK event
561 562 563
564 565 566
...searching for AP event for service func EMailExternal_any_Delay... ...searching for service event ...request redo analysis of previous service event
567 568 569 570
...processing TEC_LRZ_SERVICEFUNC_QOS_NOK event
571 572
573 574 575 576 577
578 579
580
581
582
583
584
585
586
587
588 589
...cause classes identified ...10 dependent subservices for EMail_ReceiveEMailSentFromOutsideMWN_Delay identified ...searching for cause events... ...found TEC_LRZ_SERVICEFUNC_QOS_OK event on service EMail_ReceiveEMailSentFromOutsideMWN_Avail ...found TEC_LRZ_SERVICEFUNC_QOS_OK event on service EMail_ReceiveEMail_DelayInt ...found TEC_LRZ_SERVICEFUNC_QOS_OK event on service EMail_ReceiveEMailSentFromOutsideMWN_DelayInt ...found TEC_LRZ_SERVICE_QOS_OK event on service Storage_any_Delay ...found TEC_LRZ_SERVICE_QOS_OK event on service Firewall_any_Delay ...found TEC_LRZ_SERVICE_QOS_OK event on service DNS_any_Delay ...found TEC_LRZ_SERVICE_QOS_OK event on service Connectivity_any_Delay ...found TEC_LRZ_SERVICE_QOS_OK event on service Authentication_any_Delay ...found TEC_LRZ_SERVICE_QOS_OK event on service EMailExternal_any_Delay
590 591 592 593
...processing TEC_LRZ_SERVICE_QOS_NOK event
594 595 596 597 598
599
...cause classes identified ...11 dependent resources for service EMail_any_DelayInt identified ...searching for cause events...
293
Appendix B. Tivoli Enterprise Console Implementation Code 600 601 602 603
604 605
606 607
...active probing event generated for 11 resource(s) ...1 dependent subservices for EMail_any_DelayInt identified ...searching for cause events... ...TEC_LRZ_ACTIVE_PROBING_EVENT generated for 1 service(s)
608 609 610
611 612 613 614 615
...searching for AP event for service func EMail_any_DelayInt... ...searching for service event ...request redo analysis of previous service event ...searching for service event ...request redo analysis of previous service event
616 617 618
619
620
621
622
623
624
625
626
627
628
629
...TEC_LRZ_ACTIVE_PROBING_RESOURCE wr_ProcTime generated ...TEC_LRZ_ACTIVE_PROBING_RESOURCE wr_ProcTime generated ...TEC_LRZ_ACTIVE_PROBING_RESOURCE wr_ProcTime generated ...TEC_LRZ_ACTIVE_PROBING_RESOURCE wr_ProcTime generated ...TEC_LRZ_ACTIVE_PROBING_RESOURCE wr_ProcTime generated ...TEC_LRZ_ACTIVE_PROBING_RESOURCE wr_ProcTime generated ...TEC_LRZ_ACTIVE_PROBING_RESOURCE wr_ProcTime generated ...TEC_LRZ_ACTIVE_PROBING_RESOURCE lxmhs01_ProcTime generated ...TEC_LRZ_ACTIVE_PROBING_RESOURCE lxmhs01_QueueLength generated ...TEC_LRZ_ACTIVE_PROBING_RESOURCE lxmhs02_ProcTime generated ...TEC_LRZ_ACTIVE_PROBING_RESOURCE lxms02_QueueLength generated
event for csr1-2 event for swm1-2 event for swm2-2 event for swk9-2 event for swk10-2 event for swk14-2 event for swk15-2 event for event for event for event for
630 631 632
633
...TEC_LRZ_ACTIVE_PROBING_SERVICE event for EMail_any_AvailInt generated
634 635 636 637
...processing TEC_LRZ_SERVICEFUNC_QOS_NOK event
638 639
294
640 641 642 643 644
645 646
647
648
649
650
651
652
653
654 655
...cause classes identified ...8 dependent subservices for EMail_ReceiveEMailSentFromMWN_Delay identified ...searching for cause events... ...found TEC_LRZ_SERVICEFUNC_QOS_OK event on service EMail_ReceiveEMailSentFromMWN_Avail ...found TEC_LRZ_SERVICEFUNC_QOS_OK event on service EMail_ReceiveEMail_DelayInt ...found TEC_LRZ_SERVICE_QOS_OK event on service Storage_any_Delay ...found TEC_LRZ_SERVICE_QOS_OK event on service Firewall_any_Delay ...found TEC_LRZ_SERVICE_QOS_OK event on service DNS_any_Delay ...found TEC_LRZ_SERVICE_QOS_OK event on service Connectivity_any_Delay ...found TEC_LRZ_SERVICE_QOS_OK event on service Authentication_any_Delay ...found TEC_LRZ_SERVICE_QOS_NOK event on service EMail_any_DelayInt
656 657 658 659
...processing TEC_LRZ_SERVICEFUNC_QOS_NOK event
660 661
662 663 664 665 666
667 668
669
670
671
672
673
674
675
...cause classes identified ...10 dependent subservices for EMail_ReceiveEMailSentFromOutsideMWN_Delay identified ...searching for cause events... ...found TEC_LRZ_SERVICEFUNC_QOS_OK event on service EMail_ReceiveEMailSentFromOutsideMWN_Avail ...found TEC_LRZ_SERVICEFUNC_QOS_OK event on service EMail_ReceiveEMail_DelayInt ...found TEC_LRZ_SERVICEFUNC_QOS_OK event on service EMail_ReceiveEMailSentFromOutsideMWN_DelayInt ...found TEC_LRZ_SERVICE_QOS_OK event on service Storage_any_Delay ...found TEC_LRZ_SERVICE_QOS_OK event on service Firewall_any_Delay ...found TEC_LRZ_SERVICE_QOS_OK event on service DNS_any_Delay ...found TEC_LRZ_SERVICE_QOS_OK event on service Connectivity_any_Delay ...found TEC_LRZ_SERVICE_QOS_OK event on service Authentication_any_Delay
295
Appendix B. Tivoli Enterprise Console Implementation Code 676
677
678 679
...found TEC_LRZ_SERVICE_QOS_OK event on service EMailExternal_any_Delay ...found TEC_LRZ_SERVICE_QOS_NOK event on service EMail_any_DelayInt
680 681 682
683
684 685
...searching for AP event for resource lxmhs01_QueueLength... ...found AP event for lxmhs01_QueueLength with date 1175601474 ...searching for service event
686 687 688 689
...processing TEC_LRZ_SERVICE_QOS_NOK event
690 691 692 693 694
695 696 697 698 699 700 701
...cause classes identified ...9 dependent resources for service EMail_any_AvailInt identified ...searching for cause events... ...active probing event generated for 9 resource(s) ...no services found for active probing
702 703 704
705 706 707
...searching for AP event for service func EMail_any_AvailInt... ...searching for service event ...request redo analysis of previous service event
708 709 710
711
712
713
714
715
716
717
...TEC_LRZ_ACTIVE_PROBING_RESOURCE wr_Avail generated ...TEC_LRZ_ACTIVE_PROBING_RESOURCE wr_Avail generated ...TEC_LRZ_ACTIVE_PROBING_RESOURCE wr_Avail generated ...TEC_LRZ_ACTIVE_PROBING_RESOURCE wr_Avail generated ...TEC_LRZ_ACTIVE_PROBING_RESOURCE wr_Avail generated ...TEC_LRZ_ACTIVE_PROBING_RESOURCE wr_Avail generated ...TEC_LRZ_ACTIVE_PROBING_RESOURCE wr_Avail generated ...TEC_LRZ_ACTIVE_PROBING_RESOURCE lxmhs01_Avail generated
296
event for csr1-2 event for swm1-2 event for swm2-2 event for swk9-2 event for swk10-2 event for swk14-2 event for swk15-2 event for
718
719
...TEC_LRZ_ACTIVE_PROBING_RESOURCE event for lxmhs02_Avail generated
720 721 722 723
...processing TEC_LRZ_SERVICE_QOS_NOK event
724 725 726 727 728
729 730 731 732
733 734
735 736
...cause classes identified ...11 dependent resources for service EMail_any_DelayInt identified ...searching for cause events... ...1 dependent subservices for EMail_any_DelayInt identified ...searching for cause events... ...found TEC_LRZ_SERVICE_QOS_NOK event on service EMail_any_AvailInt
737 738 739
740
741 742
...searching for AP event for resource lxmhs02_Avail ... ...found AP event for lxmhs02_Avail with date 1175601494 ...searching for service event
297
LIST OF FIGURES
1.1
Management pyramid: disciplines and functional areas . . . . . .
2
1.2
Relationship to other MNM Team theses . . . . . . . . . . . . . .
5
1.3
Thesis structure . . . . . . . . . . . . . . . . . . . . . . . . . . .
8
2.1
MNM Service View [GHH+ 01] . . . . . . . . . . . . . . . . . . 10
2.2
MNM Realization View [GHH+ 01] . . . . . . . . . . . . . . . . 11
2.3
Fault management related terms . . . . . . . . . . . . . . . . . . 13
2.4
Dependencies of the Web Hosting Service . . . . . . . . . . . . . 17
2.5
Dependencies of the E-Mail Service . . . . . . . . . . . . . . . . 20
2.6
LRZ fault diagnosis workflow . . . . . . . . . . . . . . . . . . . 23
2.7
Generic service fault diagnosis framework (the numbers refer to section numbers where requirements related to the elements are specified) . . . . . . . . . . . . . . . . . . . . . . . . . . . . . . 24
2.8
Three kinds of service monitoring: instrumented code, virtual users, internal monitoring . . . . . . . . . . . . . . . . . . . . . . 25
2.9
Three kinds of dependencies: Inter-service dependencies, service-resource dependencies, inter-resource dependencies . . . . 30
2.10 Dimensions of dependencies [HMSS06] . . . . . . . . . . . . . . 31 2.11 Possible modeling granularities: a) service to service dependencies, b) service functionality to service functionality dependencies
31
2.12 Interactions between services allowing to differentiate present/absent dependencies . . . . . . . . . . . . . . . . . . . . . . . . . . 32 3.1
Collaboration of ITIL processes and databases [Bit05] . . . . . . 40
3.2
Input/output of the Incident Management process [OGC00] . . . . 41
3.3
Input/output of the Problem Management process [Bit05] . . . . . 44
3.4
eTOM level 1: Operations processes highlighting the Assurance process [TMF05] . . . . . . . . . . . . . . . . . . . . . . . . . . 47 299
List of Figures 3.5
eTOM level 2: Assurance processes [TMF05] . . . . . . . . . . . 48
3.6
eTOM level 3: Customer Interface Management decomposition [TMF05] . . . . . . . . . . . . . . . . . . . . . . . . . . . . . . 48
3.7
eTOM level 3: Problem Handling decomposition [TMF05] . . . . 49
3.8
eTOM level 3: Customer QoS/SLA Management decomposition [TMF05] . . . . . . . . . . . . . . . . . . . . . . . . . . . . . . 49
3.9
eTOM level 3: Retention and Loyalty decomposition [TMF05] . . 50
3.10 eTOM level 3: Service Problem Management decomposition [TMF05] . . . . . . . . . . . . . . . . . . . . . . . . . . . . . . 50 3.11 eTOM level 3: Service Quality Management decomposition [TMF05] . . . . . . . . . . . . . . . . . . . . . . . . . . . . . . 51 3.12 eTOM level 3: Resource Trouble Management decomposition [TMF05] . . . . . . . . . . . . . . . . . . . . . . . . . . . . . . 52 3.13 eTOM level 3: Resource Performance Management decomposition [TMF05] . . . . . . . . . . . . . . . . . . . . . . . . . . . . 53 3.14 eTOM example processing of a customer problem report [TMF05, Bre04] (please note the horizontal ordering of processes in contrast to the organization used before) . . . . . . . . . . . . . 54 3.15 Methodology for specifying service attributes [DgFS07] . . . . . 58 3.16 Dependency hierarchy using the composite pattern [HMSS06] . . 60 3.17 General customer service management scenario [LLN98] . . . . . 62 3.18 Workflow for trouble report input [Ner01] . . . . . . . . . . . . . 63 3.19 CSMTroubleReport format [LN99, Lan01] . . . . . . . . . . . . . 65 3.20 State diagram for TRState according to [NMF97] . . . . . . . . . 66 3.21 Example part of a decision tree [Ber04] . . . . . . . . . . . . . . 68 3.22 Structuring of decision trees according to the service hierarchy [Ber04] . . . . . . . . . . . . . . . . . . . . . . . . . . . . . . . 68 3.23 Classification of fault localization techniques from [SS01] . . . . 71 3.24 SMONA architecture [DgFS07] . . . . . . . . . . . . . . . . . . 73 3.25 The basic structure of RBR [Lew99] . . . . . . . . . . . . . . . . 76 3.26 A correlation matrix and two derived codebooks (minimum codebook and codebook with more than one discriminating event) [YKM+ 96] . . . . . . . . . . . . . . . . . . . . . . . . . . . . . 80 3.27 The basic structure of CBR and options for each step [JLB04] . . 82 3.28 Classification of combination possibilities of RBR and CBR [HP07] 86 3.29 Netcool correlation methods [Net04] . . . . . . . . . . . . . . . . 88 3.30 Components of a trouble ticket system [HAN99] . . . . . . . . . 90 300
List of Figures 3.31 Integration of a trouble ticket system [HAN99] . . . . . . . . . . 91 3.32 QoS measurement process [Gar04] . . . . . . . . . . . . . . . . . 95 3.33 Service fault impact and recovery framework [HSS05a] . . . . . . 97 4.1
Service event generation from user reports . . . . . . . . . . . . . 111
4.2
Example of service dependencies (lightning denotes symptom reports) . . . . . . . . . . . . . . . . . . . . . . . . . . . . . . . . 114
4.3
Service event correlation using inter-service dependencies . . . . 115
4.4
Resource event correlation using inter-resource dependencies . . . 116
4.5
Aggregated event correlation using service-resource dependencies 118
4.6
Workflow for correcting service events . . . . . . . . . . . . . . . 120
4.7
Workflow for dealing with uncorrelated events . . . . . . . . . . . 121
4.8
Event correlation workflow . . . . . . . . . . . . . . . . . . . . . 123
4.9
Framework for service-oriented event correlation (simplified version) . . . . . . . . . . . . . . . . . . . . . . . . . . . . . . . . . 125
4.10 Customer Service Management component . . . . . . . . . . . . 126 4.11 Framework for service-oriented event correlation (refined version of [HS05]) . . . . . . . . . . . . . . . . . . . . . . . . . . . . . . 129 4.12 Detailed development of the correlation architecture . . . . . . . . 130 4.13 Hybrid event correlation architecture . . . . . . . . . . . . . . . . 130 4.14 Basic version of the correlation algorithm . . . . . . . . . . . . . 134 4.15 Parallel version of basic algorithm (part 1) . . . . . . . . . . . . . 135 4.16 Parallel version of basic algorithm (part 2) . . . . . . . . . . . . . 136 4.17 Changed output of correlation algorithm for provider hierarchies . 137 4.18 Code segment with assumption that status of antecedents is known 138 4.19 New code segment for triggering on demand tests . . . . . . . . . 139 4.20 Correlation procedure for service event correlation . . . . . . . . 140 4.21 Correlation procedure for resource event correlation . . . . . . . . 141 4.22 Correlation procedure for aggregated event correlation . . . . . . 142 4.23 Management of events in event working set (part 1) . . . . . . . . 144 4.24 Management of events in event working set (part 2) . . . . . . . . 145 4.25 Example of a transaction time as sum of processing times on the resource level . . . . . . . . . . . . . . . . . . . . . . . . . . . . 146 4.26 Input procedure . . . . . . . . . . . . . . . . . . . . . . . . . . . 148 301
List of Figures 4.27 Events for services and resources in an example situation (a) and in a worst case scenario (b) . . . . . . . . . . . . . . . . . . . . . 152 4.28 Possibilities for rule generation . . . . . . . . . . . . . . . . . . . 154 4.29 Basic class model for service fault diagnosis . . . . . . . . . . . . 156 4.30 Details of the service and resource classes with respect to dependencies (left side) . . . . . . . . . . . . . . . . . . . . . . . . . . 158 4.31 Details of the service and resource classes with respect to dependencies (right side) . . . . . . . . . . . . . . . . . . . . . . . . . 159 4.32 Classes related to the Service class and additional operations . . . 160 4.33 QoS and QoR classes . . . . . . . . . . . . . . . . . . . . . . . . 163 4.34 Event hierarchy classes (abstract classes) . . . . . . . . . . . . . . 165 4.35 Case template (assuming three QoS parameters, SAPs, keywords and additional keywords) . . . . . . . . . . . . . . . . . . . . . . 173 4.36 Framework for service-oriented event correlation and service impact analysis and fault recovery (refined version of [HSS05c]) . . 176 5.1
Service-oriented event correlation life cycle (arrows indicate the dependencies between the steps) . . . . . . . . . . . . . . . . . . 184
6.1
Resources of the Web Hosting Service . . . . . . . . . . . . . . . 196
6.2
Server load balancers and switch environment . . . . . . . . . . . 197
6.3
Model for the inter-service dependencies of the Web Hosting Service (QoS parameter availability) . . . . . . . . . . . . . . . . . . 200
6.4
Model for the service-resource dependencies of the Web Hosting Service (QoS parameter availability) . . . . . . . . . . . . . . . . 201
6.5
Model for the inter-service dependencies of the Web Hosting Service (QoS parameter delay) . . . . . . . . . . . . . . . . . . . . . 202
6.6
Model for the service-resource dependencies of the Web Hosting Service (QoS parameter delay) . . . . . . . . . . . . . . . . . . . 203
6.7
Resources of the E-Mail Service . . . . . . . . . . . . . . . . . . 204
6.8
Model for the inter-service dependencies of the E-Mail Service (QoS parameter availability) . . . . . . . . . . . . . . . . . . . . 208
6.9
Model for the service-resource dependencies of the E-Mail Service (QoS parameter availability) . . . . . . . . . . . . . . . . . . 209
6.10 Model for the service-resource dependencies of the E-Mail Service (QoS parameter delay) . . . . . . . . . . . . . . . . . . . . . 211 6.11 Tivoli Enterprise Console components [IBM03c] . . . . . . . . . 218 6.12 Implemented correlation rule set (updated from [Bey07]) . . . . . 221 302
List of Figures 6.13 Timeline for the Web Hosting Service correlation example . . . . 223 6.14 Timeline for the E-Mail Service correlation example (beginning) . 225 6.15 Timeline for the E-Mail Service correlation example (continued) . 227 6.16 Screenshot from the BMC Remedy ARS installation at the LRZ . 227 6.17 Example of a case related to the WebMail Service . . . . . . . . . 228 6.18 Hierarchy for the E-Mail Service related decision trees highlighting the example tree [Ber04] . . . . . . . . . . . . . . . . . . . . 230 6.19 Decision tree for the e-mail reception (refined version of [Ber04]) 231 6.20 Prototypical implementation at the LRZ (upper part: tool name, lower part: component role, solid arrows: control flow, dashed arrows: information flow) . . . . . . . . . . . . . . . . . . . . . . 235 6.21 Proposal for implementation at the LRZ (upper part: tool name, lower part: component role, solid arrows: control flow, dashed arrows: information flow) . . . . . . . . . . . . . . . . . . . . . . 236 A.1 Mapping of the framework components and code segments . . . . 246 A.2 Input procedure . . . . . . . . . . . . . . . . . . . . . . . . . . . 247 A.3 Procedure for service event correlation . . . . . . . . . . . . . . . 248 A.4 Procedure for aggregated event correlation . . . . . . . . . . . . . 249 A.5 Procedure for resource event correlation . . . . . . . . . . . . . . 250 A.6 Management of events on the service level . . . . . . . . . . . . . 251 A.7 Management of events on the resource level . . . . . . . . . . . . 252
303
LIST OF TABLES
2.1
Amount of e-mails at the LRZ in 2005 (base unit 1,000) [LRZ06] . . . . . . . . . . . . . . . . . . . . . . . . . . . . . 19
2.2
Requirements summary . . . . . . . . . . . . . . . . . . . . . 36
3.1
Workflow analysis summary . . . . . . . . . . . . . . . . . . 99
3.2
Management information repositories summary . . . . . . . . 100
3.3
Fault management interfaces summary . . . . . . . . . . . . . 101
3.4
Service problem diagnosis summary . . . . . . . . . . . . . . 102
3.5
Embedding into overall management solution summary . . . . 104
4.1
Summary of algorithm refinement . . . . . . . . . . . . . . . 150
4.2
Comparison with requirements . . . . . . . . . . . . . . . . . 181
6.1
Trouble tickets for the Web Hosting Service . . . . . . . . . . 199
6.2
Quick tickets for the Web Hosting Service . . . . . . . . . . . 199
6.3
Trouble tickets for subservices . . . . . . . . . . . . . . . . . 199
6.4
Quick tickets for subservices . . . . . . . . . . . . . . . . . . 199
6.5
Trouble tickets for the E-Mail Service . . . . . . . . . . . . . 207
6.6
Quick tickets for the E-Mail Service . . . . . . . . . . . . . . 207
6.7
Service event categories related to the Web Hosting Service . . 215
6.8
Resource event categories related to the Web Hosting Service . 215
6.9
Service event categories related to the E-Mail Service . . . . . 216
6.10 Resource event categories related to the E-Mail Service . . . . 216
305
LITERATURE
[AAG+ 04a] M. Agarwal, K. Appleby, M. Gupta, G. Kar, A. Neogi, and A. Sailer. Problem Determination Using Dependency Graphs and Run-Time Behavior Models. In Proceedings of the 15th IFIP International Workshop on Distributed Systems: Operations and Management (DSOM 2004), pages 171–182, Davis, California, USA, November 2004. [AAG+ 04b] M. Agarwal, K. Appleby, M. Gupta, G. Kar, A. Neogi, and A. Sailer. Problem Determination Using Dependency Graphs and Run-Time Behavior Models. Technical Report RI04004, IBM Research Report, 2004. [ABB+ 04]
C. Araujo, A. Biazetti, A. Bussani, J. Dinger, M. Feridun, and A. Tanner. Simplifying Correlation Rule Creation for Effective Systems Monitoring. In Proceedings of the 15th IFIP International Workshop on Distributed Systems: Operations and Management (DSOM 2004), pages 266–268, Davis, California, USA, November 2004.
[AGK+ 04] M. Agarwal, M. Gupta, G. Kar, A. Neogi, and A. Sailer. Mining Activity Data for Dynamic Dependency Discovery in E-Business Systems. eTransactions on Network and Service Management (eTNSM), September 2004. [AGS01]
K. Appleby, G. Goldszmidt, and M. Steinder. Yemanja - A Layered Event Correlation Engine for Multi-domain Server Farms. In Proceedings of the Seventh IFIP/IEEE International Symposium on Integrated Network Management, pages 329–344, Seattle, Washington, USA, May 2001.
[Alt]
Altusys Corporation. http://www.altusystems.com.
[AMW+ 03] M. Aguilera, J. Mogul, J. Wiener, P. Reynolds, and A. Mutchitacharoen. Performance Debugging for Distributed Systems of Black Boxes. In Proceedings of the 19th ACM Symposium on Operating Systems Principles, pages 329–344, Bolton Landing, New York, USA, October 2003. [AP94]
A. Aamodt and E. Plaza. Case-Based Reasoning: Foundational Issues, Methodological Variations, and System Approaches. AICom - Artificial Intelligence Communications, IOS Press, 7(1):39–59, 1994.
[Apr]
SpectroRx, Aprisma Management Technologies (part of Computer Associates). http://www.aprisma.com. 307
Literature [Apr00]
Event Correlation in Spectrum and Other Commercial Products, Aprisma Management Technologies. http://www.aprisma.com/literature/whitepapers/wp0551.pdf, September 2000.
[Apr04]
Event Correlation and Root Cause Analysis in Spectrum, Aprisma Management Technologies. http://www.aprisma.com/literature/white-papers/wp0536.pdf, March 2004.
[ARM98]
Systems Management: Application Response Measurement (ARM). Technical report, OpenGroup, July 1998.
[BBMR05] A. Beygelzimer, M. Brodie, S. Ma, and I. Rish. Test-Based Diagnosis: Tree and Matrix Representations. In Proceedings of the 9th IFIP/IEEE International Symposium on Integrated Network Management (IM 2005), pages 529–542, Nice, France, May 2005. [BC03]
A. Bansal and A. Clemm. Auto-Discovery at the Network and Service Management Layer. In Proceedings of the 8th IFIP/IEEE International Symposium on Integrated Network Management (IM 2003), pages 365–378, Colorado Springs, Colorado, USA, March 2003.
[BCF94]
A. Bouloutas, S. Calo, and A. Finkel. Alarm Correlation and Fault Identification in Communication Networks. IEEE Transactions on Communications, 42(2):523–533, 1994.
[BCS99]
P. Bhoj, S. Chutani, and S. Singhal. SLA Management in Federated Environments. In Proceedings of the 6th IFIP/IEEE International Symposium on Integrated Network Management (IM 1999), pages 293–308, Boston, Massassuchets, USA, May 1999.
[Ber04]
D. Bernsau. Entwurf von Entscheidungsb¨aumen f¨ur den Intelligent Assistant der BMW Group - in German. Diploma thesis, University of Munich, Department of Computer Science, Munich, Germany, December 2004.
[Bey07]
H. Beyer. Dienstorientierte Ereigniskorrelation - in German. Diploma thesis, Technical University of Munich, Department of Computer Science, Munich, Germany, January 2007.
[BGH06]
M. Brenner, M. Garschhammer, and H.-G. Hegering. When Infrastructure Management Just won’t do: The Trend towards Organizational IT Service Management. In Managing Development and Application of Digital Technologies, Springer Verlag, pages 131–146, Munich, Germany, June 2006. CDTM.
[BGSS06]
M. Brenner, M. Garschhammer, M. Sailer, and T. Schaaf. CMDB - Yet another MIB? On Reusing Management Model Concepts in ITIL Configuration Management. In Proceedings of the 17th International IFIP/IEEE Workshop on Distributed Systems: Operations and Management (DSOM 2006), pages 269– 280, Dublin, Ireland, October 2006.
[BHM+ 01] L. Burns, J. Hellerstein, S. Ma, C. Perng, D. Rabenhorst, and D. Taylor. Towards Discovery of Event Correlation Rules. In Proceedings of the 7th IFIP/IEEE International Symposium on Integrated Network Management (IM 2001), pages 345–359, Seattle, Washington, USA, May 2001. 308
Literature [Bit05]
C. Bitterich. Klassifizierung und Modellierung von DienstmanagementInformationen - ein Design Pattern-basierter Ansatz - in German. Diploma thesis, University of Munich, Department of Computer Science, Munich, Germany, December 2005.
[BJ00]
A. Bierman and K. Jones. Physical Topology MIB. Technical Report RFC 2922, IETF Network Working Group, 2000.
[BKH01]
S. Bagchi, G. Kar, and J. Hellerstein. Dependency Analysis in Distributed Systems using Fault Injections: Application to Problem Determination in an ECommerce Environment. In Proceedings of the 12th International IFIP/IEEE Workshop on Distributed Systems: Operations and Management (DSOM 2001), Nancy, France, October 2001.
[BKK01]
A. Brown, G. Kar, and A. Keller. An Active Approach to Characterizing Dynamic Dependencies for Problem Determination in a Distributed Application Environment. In Proceedings of the 7th IFIP/IEEE International Symposium on Integrated Network Management (IM 2001), pages 377–390, Seattle, Washington, USA, May 2001.
[BMCa]
BMC Remedy Action Request System, BMC Remedy Corporation. http://www.bmc.com/remedy/.
[BMCb]
BMC Remedy Link for Tivoli, BMC Remedy Corporation. http://www.bmc.com/products/proddocview/0,2832,19052 0 43047845136635,00.html.
[Bon04]
Bon, J. van, editor. IT Service Management, an Introduction based on ITIL. itSMF Library. Van Haren Publishing, 2004.
[Bre04]
M. Brenner. enhanced Telecom Operations Map - in German. In Vom LAN zum Kommunikationsnetz - Netze und Protokolle, Germany, June 2004. Interest Verlag.
[BRH+ 07]
M. Brenner, G. Dreo Rodosek, A. Hanemann, H.-G. Hegering, and R. Koenig. Service Provisioning. In Network and Systems Management Handbook (to appear), Oslo, Norway, December 2007. Elsevier.
[BS04]
C. Bartolini and M. Salle. Business Driven Prioritization of Service Incidents. In Proceedings of the 15th IFIP International Workshop on Distributed Systems: Operations and Management (DSOM 2004), pages 64–75, Davis, California, USA, November 2004.
[BSC04]
A. Benjamim, J. Sauve, and W. Cirne. Independently Auditing Service Level Agreements in the Grid. In The 11th International Workshop of the HP OpenView University Association (HPOVUA 2004), Paris, France, June 2004.
[BST06]
C. Bartolini, M. Salle, and D. Trastour. IT Service Management Driven by Business Objectives - An Application to Incident Management. In Proceedings of the 10th IEEE/IFIP International Network Management and Operations Symposium (NOMS 2006), Vancouver, British Columbia, Canada, April 2006.
[Cac]
Cacti - The complete RRDtool-Based Graphing Solution. http://cacti.net. 309
Literature [CCL99]
J. Choi, M. Choi, and S. Lee. An Alarm Correlation and Fault Identification Scheme Based on OSI Managed Object Classes. In Proceedings of the IEEE International Conference on Communications (ICC 1999), pages 1547–1551, Vancouver, British Columbia, Canada, June 1999.
[CFK+ 02]
K. Czajkowski, I. Foster, C. Kesselman, V. Sander, and S. Tuecke. SNAP: A Protocol for Negotiating Service Level Agreements and Coordinating Resource Management in Distributed Systems. In Proceedings of Job Scheduling Strategies for Parallel Processing (JSSPP 2002), pages 153–183, Edinburgh, Scotland, July 2002.
[CIM06]
CIM Standards, Version 2.13, Distributed Management Task Force. http://www.dmtf.org/standards/cim, September 2006.
[CJ05]
T. Chatain and C. Jard. Models for the Supervision of Web Services Orchestration with Dynamic Changes. In Proceedings of the IARIA International Conference on Service Assurance with Partial and Intermittent Resources (SAPIR 2005), Lisbon, Portugal, July 2005. IEEE press.
[CKF+ 02]
M. Chen, E. Kiciman, E. Fratkin, A. Fox, and E. Brewer. Pinpoint: Problem Determination in Large, Dynamic Internet Services. In Proceedings of the IEEE International Conference on Dependable Systems and Networks (DSN2002), Bethesda, Maryland, USA, June 2002.
[CMRW96] J. Case, K. McCloghrie, M. Rose, and S. Waldbusser. Structure of Management Information for Version 2 of the Simple Network Management Protocol (SNMPv2). Technical Report RFC 1902, IETF, January 1996. [COB]
Common Objectives for Information and related Technology (COBIT 4.0). http://www.isaca.org/cobit.
[CR99]
D. Caswell and S. Ramanathan. Using Service Models for Management of Internet Services. Technical Report HPL-1999-43, HP Laboratories, March 1999.
[CYL01]
C. Chao, D. Yang, and A. Liu. An Automated Fault Diagnosis System Using Hierarchical Reasoning and Alarm Correlation. Journal of Network and Systems Management, 9(2), June 2001.
[Den02]
M. Denecke. Generische Interaktionsmuster f¨ur aufgabenorientierte Dialogsysteme - in German. Phd thesis, University of Karlsruhe (TH), Karlsruhe, Germany, May 2002.
[DgFS07]
V. Danciu, N. gentschen Felde, and M. Sailer. Declarative Specification of Service Management Attributes. In Proceedings of the 10th IFIP/IEEE International Conference on Integrated Network Management (IM 2007), Munich, Germany, May 2007.
[DHHS06]
V. Danciu, A. Hanemann, H.-G. Hegering, and M. Sailer. IT Service Management: Getting the View. In Managing Development and Application of Digital Technologies, pages 109–130, Munich, Germany, June 2006. CDTM, Springer Verlag.
310
Literature [DK03]
M. Debusmann and A. Keller. SLA-driven Management of Distributed Systems Using the Common Information Model. In Proceedings of the 8th IFIP/IEEE International Symposium on Integrated Network Management (IM 2003), pages 563–576, Colorado Springs, Colorado, USA, March 2003.
[Doo95]
R. Doorenbos. Production Matching for Large Learning Systems. Phd thesis, Carnegie Mellon University, Pittsburgh, USA, January 1995.
[DR02]
G. Dreo Rodosek. A Framework for IT Service Management. Habilitation, University of Munich (LMU), Department of Computer Science, Munich, Germany, June 2002.
[DR03]
G. Dreo Rodosek. A Generic Model for IT Services and Service Management. In Proceedings of the 8th IFIP/IEEE International Symposium on Integrated Network Management (IM 2003), pages 171–184, Colorado Springs, Colorado, USA, March 2003.
[DRK98]
G. Dreo Rodosek and T. Kaiser. Intelligent Assistant: User-guided Fault Localization. In Proceedings of the 9th IFIP/IEEE International Workshop on Distributed Systems: Operations & Management (DSOM 98), pages 119–129, Newark, Delaware, USA, October 1998.
[DS05]
V. Danciu and M. Sailer. A Monitoring Architecture Supporting Service Management Data Composition. In Proceedings of the 12th International Workshop of the HP OpenView University Association (HPOVUA 2005), pages 393–396, Porto, Portugal, July 2005.
[DV95]
G. Dreo and R. Valta. Using Master Tickets as a Storage for Problem-Solving Expertise. In Proceedings of the Fourth IFIP/IEEE International Symposium on Integrated Network Management, Santa Barbara, California, USA, May 1995.
[EK02]
C. Ensel and A. Keller. An Approach for Managing Service Dependencies with XML and the Resource Description Framework. Journal of Network and Systems Management, 10(2), June 2002.
[Emp]
Empolis Orenge. http://www.empolis.de.
[Ens01a]
C. Ensel. A Scalable Approach to Automated Service Dependency Modeling in Heterogeous Environments. In Proceedings of the 5th IEEE International Enterprise Distributed Object Computing Conference (EDOC 2001), Seattle, Washington, USA, September 2001.
[Ens01b]
C. Ensel. New Approach for Automated Generation of Service Dependency Models. In Network Management as a Strategy for Evolution and Development; Second IEEE Latin American Network Operation and Management Symposium (LANOMS 2001), Belo Horizonte, Brazil, August 2001.
[FJP99]
S. Frolund, M. Jain, and J. Pruyne. SoLOMon: Monitoring End-User Service Levels. In Proceedings of the 6th IFIP/IEEE International Symposium on Integrated Network Management (IM 1999), pages 261–274, Boston, Massassuchets, USA, May 1999. 311
Literature [For79]
C. Forgy. On the Efficient Implementation of Production Systems. Phd thesis, Carnegie Mellon University, Pittsburgh, USA, 1979.
[For82]
C. Forgy. Rete: A Fast Algorithm for the Many Pattern/Many Object Pattern Match Problem. Artifical Intelligence Journal, 19(1):17–37, 1982.
[Gar04]
M. Garschhammer. Dienstg¨utebehandlung im Dienstlebenszyklus: von der formalen Spezifikation zur rechnergest¨utzten Umsetzung - in German. Phd thesis, University of Munich, Department of Computer Science, Munich, Germany, August 2004.
[GBK01]
M. Guiagoussou, R. Boutaba, and M. Kadoch. A Java API for Advanced Fault Management. In Proceedings of the Seventh IFIP/IEEE International Symposium on Integrated Network Management, pages 483–498, Seattle, Washington, USA, May 2001.
[GHH+ 01] M. Garschhammer, R. Hauck, H.-G. Hegering, B. Kempter, M. Langer, M. Nerb, I. Radisic, H. Roelle, and H. Schmidt. Towards Generic Service Management Concepts - A Service Model Based Approach. In Proceedings of the Seventh IFIP/IEEE International Symposium on Integrated Network Management, pages 719–732, Seattle, Washington, USA, May 2001. [GHH+ 02] M. Garschhammer, R. Hauck, H.-G. Hegering, B. Kempter, I. Radisic, H. Roelle, and H. Schmidt. A Case-Driven Methodology for Applying the MNM Service Model. In Proceedings of the 8th IFIP/IEEE International Network and Operations Management Symposium (NOMS 2002), pages 697–710, Florence, Italy, April 2002. [GHK+ 01] M. Garschhammer, R. Hauck, B. Kempter, I. Radisic, H. Roelle, and H. Schmidt. The MNM Service Model - Refined Views on Generic Service Management. Journal of Communications and Networks, 3(4), November 2001. [GKK04]
J. Gao, G. Kar, and P. Kermani. Approaches to Building Self Healing Systems Using Dependency Analysis. In Proceedings of the 9th IFIP/IEEE International Network Management and Operations Symposium (NOMS 2004), pages 119– 132, Seoul, Korea, April 2004.
[GNA]
GNATS - The GNU Bug Tracking System, GNU project, Free Software Foundation. http://www.gnu.org/software/gnats.
[GNAK03] M. Gupta, A. Neogi, M. Agarwal, and G. Kar. Discovering Dynamic Dependencies in Enterprise Environments for Problem Determination. In Proceedings of the 14th IFIP/IEEE Workshop on Distributed Sytems: Operations and Management, Heidelberg, Germany, October 2003. [GRM97]
Information Technology - Open Systems Interconnection - Structure of Management Information - Part 7: General Relationship Model, IS 10165-7, ISO and International Electrotechnical Committee, 1997.
[Gru98]
B. Gruschke. Integrated Event Management: Event Correlation Using Dependency Graphs. In Proceedings of the 9th IFIP/IEEE International Workshop on Distributed Systems: Operations & Management (DSOM 98), pages 130–141, Newark, Delaware, USA, October 1998.
312
Literature [Gru99]
B. Gruschke. Entwurf eines Eventkorrelators mit Abh¨angigkeitsgraphen - in German. Phd thesis, University of Munich, Department of Computer Science, Munich, Germany, November 1999.
[HAN99]
H.-G. Hegering, S. Abeck, and B. Neumair. Integrated Management of Networked Systems - Concepts, Architectures and their Operational Application. Morgan Kaufmann Publishers, 1999.
[Han06]
A. Hanemann. A Hybrid Rule-Based/Case-Based Reasoning Approach for Service Fault Diagnosis. In Proceedings of 20th International Conference on Advanced Information Networking and Application (AINA2006); includes proceedings of International Symposium on Frontiers in Networking with Applications (FINA 2006), pages 734–738, Vienna, Austria, April 2006. IEEE press.
[Han07]
A. Hanemann. Refining ITIL/eTOM Processes for Automation in Service Fault Management. In Proceedings of the 2nd IFIP/IEEE International Workshop on Business-Driven IT Management (BDIM 2007), Munich, Germany, May 2007.
[Has01]
P. Hasselmeyer. Managing Dynamic Service Dependencies. In Proceedings of the 12th International IFIP/IEEE Workshop on Distributed Systems: Operations and Management (DSOM 2001), Nancy, France, October 2001.
[HCdK92]
W. Hamscher, L. Console, and J. de Kleer. Readings in Model-Based Diagnosis. Morgan Kaufmann Publishers, 1992.
[HCH+ 99]
L. Ho, D. Cavuto, M. Hasan, S. Papavassiliou, and A. Zawadzki. Adaptive Network/Service Fault Detection in Transaction-Oriented Wide Area Networks. In Proceedings of the 6th IFIP/IEEE International Symposium on Integrated Network Management (IM 1999), pages 761–775, Boston, Massassuchets, USA, May 1999.
[Hei04]
E. Heidinger. Ein CIM-basiertes Modell der RechnernetzepraktikumInfrastruktur - in German. Advanced Practical, Technical University of Munich, Department of Computer Science, Munich, Germany, January 2004.
[Hin06]
S. Hintzen. Evaluierung des Service Desk und Incident Management am LRZ - in German. Diploma thesis, University of Munich, Department of Computer Science, Munich, Germany, January 2006.
[HKS99]
H. Hazewinkel, C. Kalbfleisch, and J. Schoenwaelder. Definition of Managed Objects for WWW Services. Technical Report RFC 2594, IETF, May 1999.
[HMP02]
J. Hellerstein, S. Ma, and C. Perng. Discovering Actionable Patterns from Event Data. IBM Systems Journal, 41(3):475–493, 2002.
[HMSS06] A. Hanemann, P. Marcu, M. Sailer, and D. Schmitz. Specification of Dependencies for IT Service Fault Management. In Proceedings of the 1st International Conference on Software and Data Technologies, pages 257–260, Setubal, Portugal, September 2006. INSTICC press. [HP a]
HP OpenView Event Correlation Services, Hewlett Packard Corporation. http://www.managementsoftware.hp.com/products/ecs/. 313
Literature [HP b]
HP OpenView NetworkNodeManager, Hewlett Packard http://www.openview.hp.com/products/nnm/.
Corporation.
[HP c]
HP OpenView ServiceCenter, Hewlett Packard http://h20229.www2.hp.com/products/ovsc/index.html.
Corporation.
[HP07]
I. Hatzilygeroudis and J. Prentzas. Categorizing Approaches Combining RuleBased and Case-Based Reasoning (to appear). Journal of Expert Systems, Blackwell Publishing, 2007.
[HS05]
A. Hanemann and M. Sailer. Towards a Framework for Service-Oriented Event Correlation. In Proceedings of the IARIA International Conference on Service Assurance with Partial and Intermittent Resources (SAPIR 2005), Lisbon, Portugal, July 2005. IEEE press.
[HSS04]
A. Hanemann, M. Sailer, and D. Schmitz. Assured Service Quality by Improved Fault Management - Service-Oriented Event Correlation. In Proceedings of the 2nd ACM International Conference on Service-Oriented Computing (ICSOC04), pages 183–192, New York City, New York, USA, November 2004.
[HSS05a]
A. Hanemann, M. Sailer, and D. Schmitz. A Framework for Failure Impact Analysis and Recovery with Respect to Service Level Agreements. In Proceedings of the IEEE International Conference on Services Computing (SCC 2005, volume II), pages 49–56, Orlando, Florida, USA, July 2005. IEEE press.
[HSS05b]
A. Hanemann, M. Sailer, and D. Schmitz. Towards a Framework for Failure Impact Analysis and Recovery with Respect to Service Level Agreements. In Proceedings of the 9th IFIP/IEEE International Conference on Integrated Network Management (IM 2005, Poster-CD), Nice, France, May 2005.
[HSS05c]
A. Hanemann, M. Sailer, and D. Schmitz. Towards a Framework for IT Service Fault Management. In Proceedings of the European University Information Systems Conference (EUNIS 2005), Manchester, England, June 2005.
[HSV99]
M. Hasan, B. Sugla, and R. Viswanathan. A Conceptual Framework for Network Management Event Correlation and Filtering Systems. In Proceedings of the 6th IFIP/IEEE International Symposium on Integrated Network Management (IM 1999), pages 233–246, Boston, Massassuchets, USA, May 1999.
[IBMa]
IBM Tivoli Application Dependency Discovery Manager, International Business Machines Corporation. http://www-306.ibm.com/software/tivoli/products/taddm/.
[IBMb]
IBM Tivoli Enterprise Console, International Business Machines Corporation. http://www-306.ibm.com/software/tivoli/products/enterprise-console/.
[IBMc]
IBM Tivoli Alert Adapter for BMC Remedy ARS, International Business Machines Corporation/Candle. http://publib.boulder.ibm.com/tividd/td/IBMTivoliAlertAdapterforRemedyARS2.0.html.
[IBM03a]
IBM Tivoli Enterprise Console, Rule Developer’s Guide, International Business Machines Corporation. http://publib.boulder.ibm.com/tividd/td/EnterpriseConsole3.9.html, August 2003.
314
Literature [IBM03b]
IBM Tivoli Enterprise Console, Rule Set Reference, International Business Machines Corporation. http://publib.boulder.ibm.com/tividd/td/EnterpriseConsole3.9.html, August 2003.
[IBM03c]
IBM Tivoli Enterprise Console, User’s Guide, International Business Machines Corporation. http://publib.boulder.ibm.com/tividd/td/EnterpriseConsole3.9.html, August 2003.
[Inf]
InfoVista Corporation. http://www.infovista.com.
[Int]
IntegraTUM project, Technische Universit¨at Muenchen. mytum.de/iuk/integratum/index html.
[JBL04]
G. Jakobson, J. Buford, and L. Lewis. Towards an Architecture for Reasoning about Complex Event-Based Dynamic Situations. In Proceedings of the Third International Workshop on Distributed Event Based Systems (DEBS 2004), Edinburgh, Scotland, May 2004.
[JBL05]
G. Jakobson, J. Buford, and L. Lewis. A Hybrid Approach to Event Correlation and Situation Management. In Proceedings of the 9th IFIP/IEEE International Symposium on Integrated Network Management (IM 2005, Poster-CD), Nice, France, May 2005.
[JBo]
JBoss Rules, JBoss - a division of RedHat Linux. http://labs.jboss.com/portal/jbossrules/.
[jCo]
jColibri - Case Based Reasoning framework. http://gaia.fdi.ucm.es/projects/jcolibri/.
[JLB04]
G. Jakobson, L. Lewis, and J. Buford. An Approach to Integrated Cognitive Fusion. In Proceedings of the 7th ISIF International Conference on Information Fusion (FUSION2004), pages 1210–1217, Stockholm, Sweden, June 2004.
[JW93]
G. Jakobson and M. Weissman. Alarm Correlation. IEEE Network, 7(6), November 1993.
[JW95]
G. Jakobson and M. Weissman. Real-time Telecommunication Network Management: Extending Event Correlation with Temporal Constraints. In Proceedings of the Fourth IFIP/IEEE International Symposium on Integrated Network Management, pages 290–301, Santa Barbara, California, USA, May 1995.
[JWB+ 00]
G. Jakobson, M. Weissman, L. Brenner, C. Lafond, and C. Matheus. GRACE: Building Next Generation Event Correlation Services. In Proceedings of the 7th IFIP/IEEE International Network Management and Operations Symposium (NOMS 2000), pages 701–714, Honolulu, Hawaii, USA, April 2000.
[KBS02]
H.-J. Kettschau, S. Brueck, and P. Schefczik. LUCAS - an Expert System for Intelligent Fault Management and Alarm Correlation. In Proceedings of the 8th IFIP/IEEE International Network and Operations Management Symposium (NOMS 2002), pages 903–906, Florence, Italy, April 2002.
[KH04]
E. Kirmani and C. S. Hood. Diagnosing Network States through Intelligent Probing. In Proceedings of the 9th IFIP/IEEE International Network Management and Operations Symposium (NOMS 2004), pages 147–160, Seoul, Korea, April 2004.
http://portal.-
315
Literature [KHL+ 99]
M. Katchabaw, S. Howard, H. Lufiyya, A. Marshall, and M. Bauer. Making Distributed Applications Manageable through Instrumentation. The Journal of Systems and Software, 45(2):81–97, 1999.
[KK01]
A. Keller and G. Kar. Determining Service Dependencies in Distributed Systems. In Proceedings of the IEEE International Conference on Communications (ICC 2001), Helsinki, Finland, June 2001.
[KKC00]
G. Kar, A. Keller, and S. Calo. Managing Application Services over Service Provider Networks: Architecture and Dependency Analysis. In Proceedings of the 7th IFIP/IEEE International Network and Operations Management Symposium (NOMS 2000), pages 61–75, Honolulu, Hawaii, USA, April 2000.
[KL02]
A. Keller and H. Ludwig. The WSLA Framework: Specifying and Monitoring Service Level Agreements for Web Services. Technical Report RC22456 (W0205-171), IBM Research, Yorktown Heights, New York, USA, May 2002.
[KMT99]
M. Klemittinen, H. Mannila, and H. Toivonen. Rule Discovery in Telecommunciation Alarm Data. Journal of Network and Systems Management, 7(4):395– 423, Dec 1999.
[KN96]
R. Kaplan and D. Norton. The Balanced Scorecard: Translating Strategy into Action. Harvard Business School Press, Cambridge, Massachusetts, USA, 1996.
[Kol93]
J. Kolodner. Case-Based Reasoning. Morgan Kaufmann Publishers, San Mateo, California, USA, 1993.
[KS95]
I. Katzela and M. Schwartz. Schemes for Fault Identification in Communication Networks. IEEE Transactions on Networking, 3(6), 1995.
[KS00]
R. Kasseri and B. Stewart. Event MIB. Technical Report RFC 2981, IETF, October 2000.
[KTK01]
C. Kruegel, T. Toth, and C. Kerer. Decentralized Event Correlation for Intrusion Detection. In Proceedings of the International Conference on Information Security and Cryptology (ICISC 2001), Seoul, Korea, December 2001.
[KYY+ 95] S. Kliger, S. Yemini, Y. Yemini, D. Ohsie, and S. Stolfo. A Coding Approach to Event Correlation. In Proceedings of the Fourth IFIP/IEEE International Symposium on Integrated Network Management, pages 266–277, Santa Barbara, California, USA, May 1995. [Lan01]
M. Langer. Konzeption und Anwendung einer Customer Service Management Architektur - in German. PhD thesis, Technical University of Munich, Department of Computer Science, Munich, Germany, March 2001.
[Lew93]
L. Lewis. A Case-based Reasoning Approach for the Resolution of Faults in Communication Networks. In Proceedings of the Third IFIP/IEEE International Symposium on Integrated Network Management, pages 671–682, San Francisco, California, USA, April 1993. IFIP/IEEE.
[Lew95]
L. Lewis. Managing Computer Networks - A Case-Based Reasoning Approach. Artech House, Inc., 1995.
316
Literature [Lew99]
L. Lewis. Service Level Management for Enterprise Networks. Artech House, Inc., 1999.
[LLN98]
M. Langer, S. Loidl, and M. Nerb. Customer Service Management: A more Transparent View to Your Subscribed Services. In Proceedings of the 9th IFIP/IEEE International Workshop on Distributed Systems: Operations & Management (DSOM 98), pages 195–206, Newark, Delaware, USA, October 1998.
[LN99]
M. Langer and M. Nerb. Defining a Trouble Report Format for the Seamless Integration of Problem Management into Customer Service Management. In Proceedings of the 6th International Workshop of the HP OpenView University Association (HPOVUA99), Bologna, Italy, June 1999. HPOVUA.
[LR99]
L. Lewis and P. Ray. Service Level Management: Definition, Architecture, and Research Challenges. In Proceedings of the IEEE Global Telecommunications Conference (Globecom 1999), pages 1974–1978, Rio de Janeiro, Brazil, December 1999.
[LRZa]
E-Mail am LRZ - in German, Leibniz Supercomputing Center. http://www.lrzmuenchen.de/services/netzdienste/email/.
[LRZb]
Webhosting: Virtueller WWW-Server am LRZ - in German, Leibniz Supercomputing Center. http://www.lrz-muenchen.de/services/netzdienste/www/vserver/.
[LRZc]
SquirrelMail - in German, Leibniz Supercomputing Center. http://www.lrzmuenchen.de/services/netzdienste/email/squirrelmail.
[LRZd]
Virtuelle WWW-Server am LRZ - in German, Leibniz Supercomputing Center. http://www.lrz-muenchen.de/services/netzdienste/www/uns virt/.
[LRZ06]
Jahresbericht 2005 des Leibniz-Rechenzentrums (LRZ annual report 2005) in German, Leibniz Supercomputing Center. http://www.lrz-muenchen.de/wir/berichte/, April 2006.
[LSE03]
D. Lamanna, J. Skene, and W. Emmerich. SLAng: A Language for Defining Service Level Agreements. In 9th IEEE International Workshop on Future Trends of Distributed Computing Systems (FTDCS 2003), San Juan, Puerto Rico, May 2003.
[LWD92]
A. Lazar, W. Wang, and R. Deng. Models and Algorithms for Network Fault Detection and Identification: A Review. In Proceedings of IEEE International Conference on Communications/International Symposium on Information Theory and Its Applications, pages 999–1003, Singapore, Nov 1992.
[Mar06]
P. Marcu. Modellierung von Abh¨angigkeiten in IT-Diensten - in German. Diploma thesis, University of Munich, Department of Computer Science, Munich, Germany, June 2006.
[Mei97]
D. Meira. A Model for Alarm Correlation in Telecommunication Networks. PhD thesis, Universidade Federal de Minas Gerais, Belo Horizonte, Brazil, 1997. 317
Literature [MF04]
J. Martin-Flatin. Distributed Event Correlation and Self-Managed Systems. In Proceedings of the 1st International Workshop on Self-* Properties in Complex Information Systems (Self-Star 2004), pages 61–64, Bertinoro, Italy, May 2004.
[MLKB02] G. Molenkamp, H. Lutfiyya, M. Katchabaw, and M. Bauer. Diagnosing Quality of Service Faults in Distributed Applications. In Proceedings of the 20th IEEE International Performance, Computing, and Communications Conference, pages 375–382, Phoenix, Arizona, USA, April 2002. [Mod94]
A. Modes. Entwurf und Realisierung eines Intelligent Assistant f¨ur ein Trouble Ticket System - in German. Diploma Thesis, Technical University of Munich, Department of Computer Science, Munich, Germany, 1994.
[Nag]
Nagios. http://www.nagios.org.
[Ner]
Nerve Center, Open Service. center.php.
[Ner01]
M. Nerb. Customer Service Management als Basis f¨ur interorganisationales Dienstmanagement - in German. PhD thesis, Technical University of Munich, Department of Computer Science, Munich, Germany, March 2001.
[Neta]
Netcool, Micromuse Incorporated. http://www.micromuse.com.
[Netb]
assureME Assurance Solutions (includes former OSI NETeXPERT), Agilent Technologies Corporation. http://assureme.comms.agilent.com/.
[Net03]
A Technical Overview of Netcool/Impact, Micromuse Incorporated. http://www.micromuse.com/downloads/pdf lit/wp-impact.pdf, October 2003.
[Net04]
Managing Today’s Mission-Critical Infrastructures: Discovery, Collection, Correlation, and Resolution with the Netcool Suite, Micromuse Incorporated. http://www.micromuse.com/downloads/pdf lit/wps/Muse Discovery Correlation Resolution Jan04.pdf, January 2004.
[NMF97]
Customer to Service Provider Trouble Administration Information Agreement. Issue 1.0 (NMF 601), Network Management Forum, March 1997.
[Nod]
NodeBrain - An Open Source Agent for Event Monitoring Applications, The Boeing Company. http://www.nodebrain.org.
[Nyg95]
Y. Nygate. Event Correlation Using Rule and Object Based Techniques. In Proceedings of the Fourth IFIP/IEEE International Symposium on Integrated Network Management, pages 278–289, Santa Barbara, California, USA, May 1995.
[OGC00]
OGC (Office of Government Commerce), editor. Service Support. IT Infrastructure Library (ITIL). The Stationary Office, Norwich, UK, 2000.
[OGC01]
OGC (Office of Government Commerce), editor. Service Delivery. IT Infrastructure Library (ITIL). The Stationary Office, Norwich, UK, 2001.
318
http://www.openservice.com/products/nerve-
Literature [OJBZ06]
A. Orso, S. Joshi, M. Burger, and A. Zeller. Isolating Relevant Component Interactions with JINSI. In Proceedings of the Fourth International ICSE Workshop on Dynamic Analysis (WODA 2006), pages 3–9, Shanghai, China, May 2006.
[ORM04]
N. Odintsova, I. Rish, and S. Ma. Multi-Fault Diagnosis in Dynamic Systems. Technical Report RC23385, IBM Research, Yorktown Heights, New York, USA, October 2004.
[ORM05]
N. Odintsova, I. Rish, and S. Ma. Multi-fault Diagnosis in Dynamic Systems. In Proceedings of the 9th IFIP/IEEE International Symposium on Integrated Network Management (IM 2005, Poster-CD), Nice, France, May 2005.
[OTR]
Open Source Ticket Request System. http://otrs.org.
[Ott99]
A. Otto. Einsatz des Intelligent Assistant im Problemmanagement des BMW Extranets - in German. Diploma Thesis, Technical University of Munich, Department of Computer Science, Munich, Germany, 1999.
[Pas04]
A. Paschke. Regel-basiertes SLA-Management - Ein regelbasierter Ansatz zum automatisierten IT-Dienstleistungsmanagement - in German. Technical report, Technical University of Munich, June 2004.
[Pea88]
J. Pearl. Probabilistic Reasoning in Intelligent Systems: Networks of Plausible Inference. Morgan Kaufmann Publishers, 1988.
[PNM99]
G. Penido, J.M. Nogueira, and C. Machado. An Automatic Fault Diagnosis and Correlation System for Telecommunications Management. In Proceedings of the 6th IFIP/IEEE International Symposium on Integrated Network Management (IM 1999), pages 779–791, Boston, Massassuchets, USA, May 1999.
[RBO+ 04]
I. Rish, M. Brodie, N. Odintsova, S. Ma, and G. Grabarnik. Real-time Problem Determination in Distributed Systems Using Active Probing. In Proceedings of the 9th IFIP/IEEE International Network Management and Operations Symposium (NOMS 2004), pages 133–146, Seoul, Korea, April 2004.
[RCN99]
S. Ramanathan, D. Caswell, and S. Neal. Auto-Discovery Capabilities for Service Management: An ISP Case Study. Technical Report HPL-1999-68, HP Laboratories, Palo Alto, California, USA, May 1999.
[RDF]
Resource Description Framework, http://www.w3.org/RDF.
World
[RML]
RuleML - the Rule http://www.ruleml.org.
Language,
[RR91]
M. Register and A. Rewari. CANASTA: The Crash Analysis Troubleshooting Assistant. In Innovative Applications of Artificial Intelligence 3, Menlo Park, California, USA, 1991. AAAI.
[RSM+ 07]
R. Reboucas, J. Sauve, A. Moura, C. Bartolini, and D. Trastour. A Decision Support Tool to Optimize the Scheduling of IT Changes. In Proceedings of the 10th IFIP/IEEE International Conference on Integrated Network Management (IM 2007), Munich, Germany, May 2007.
Markup
Wide
Web RuleML
Consortium. initiative.
319
Literature [Sai05]
M. Sailer. Towards a Service Management Information Base. In Proceedings of the IBM PhD Student Symposium at the 3rd International Conference on Service-Oriented Computing (ICSOC 2005); IBM Research Report No. 23826, Amsterdam, The Netherlands, December 2005.
[SB04]
M. Salle and C. Bartolini. Management by Contract. In Proceedings of the 9th IFIP/IEEE International Network Management and Operations Symposium (NOMS 2004), pages 787–800, Seoul, Korea, April 2004.
[SBFR99]
M. Sabin, A. Bakman, E. Freunder, and R. Russell. A Constraint-Based Approach to Fault Management for Groupware Services. In Proceedings of the 6th IFIP/IEEE International Symposium on Integrated Network Management (IM 1999), pages 731–744, Boston, Massassuchets, USA, May 1999. IFIP/IEEE.
[Sch00]
H. Schmidt. Service Contracts based on Workflow Modeling. In Proceedings of the 11th IFIP/IEEE International Symposium on Distributed Systems: Operations and Management (DSOM 2001), Austin, Texas, USA, December 2000.
[Sch01a]
F. Schmidt. Erstellung eines Entscheidungsbaum-Editors f¨ur den Intelligent Assistent des LRZ - in German. Advanced Practical, University of Munich, Department of Computer Science, Munich, Germany, June 2001.
[Sch01b]
H. Schmidt. Entwurf von Service Level Agreements auf der Basis von Dienstprozessen - in German. PhD thesis, University of Munich, Department of Computer Science, Munich, Germany, 2001.
[Sch07]
D. Schmitz. Application of Service-Oriented Impact Analysis and Recovery Techniques for IT Service Fault Management (in preparation). PhD thesis, University of Munich, Department of Computer Science, Munich, Germany, December 2007.
[SEC]
Simple Event Correlator (SEC), Risto Vaarandi, Tallinn Technical University, Estonia. http://kodu.neti.ee/˜risto/sec/.
[Slo94]
M. Sloman. Policy Driven Management for Distributed Systems. Journal of Network and Systems Management, 2(4), 1994.
[Sma]
EMC Smarts Family. smarts family/index.jsp.
[Sma01]
Downstream Suppression is Not Root Cause Analysis, Smarts Corporation. http://www.smarts.com/resources/DS WhitePaper 0802.pdf, 2001.
[SRF97]
M. Sabin, R. Russell, and E. Freuder. Generating Diagnostic Tools for Network Fault Management. In Proceedings of the Fifth IFIP/IEEE International Symposium on Integrated Network Management (IM 1997), pages 700–711, San Diego, California, USA, May 1997.
[SRFM01]
M. Sabin, R. Russell, E. Freuder, and I. Miftode. Using Constraint Technology to Diagnose Configuration Errors in Networks Managed with SPECTRUM. In Proceedings of 8th IEEE International Conference on Telecommunications (ICT 2001), Bucharest, Romania, June 2001.
320
http://www.emc.com/products/software/smarts/-
Literature [SS01]
M. Steinder and A. Sethi. The Present and Future of Event Correlation: A Need for End-to-End Service Fault Localization. In Proceedings of the 5th IIIS World Multiconference on Systemics, Cybernetics, and Informatics (SCI 2001), pages 124–129, Orlando, Florida, USA, July 2001.
[SS03]
M. Steinder and A. Sethi. Probabilistic Event-Driven Fault Diagnosis through Incremental Hypothesis Updating. In Proceedings of the 8th IFIP/IEEE International Symposium on Integrated Network Management (IM 2003), pages 635–648, Colorado Springs, Colorado, USA, March 2003.
[SS04]
M. Steinder and A. Sethi. A Survey of Fault Localization Techniques in Computer Networks. Science of Computer Programming, Elsevier, 53(1):165–194, 2004.
[SS06]
S. Shankar and O. Satyanarayanan. An Automated System fo Analyzing Impact of Faults in IP Telephony Networks. In Proceedings of the 10th IFIP/IEEE International Network Management and Operations Symposium (NOMS 2006), Vancouver, British Columbia, Canada, April 2006.
[TASB05]
Y. Tang, E. Al-Shaer, and R. Boutaba. Active Integrated Fault Localization in Communication Networks. In Proceedings of the 9th IFIP/IEEE International Symposium on Integrated Network Management (IM 2005), pages 543–556, Nice, France, May 2005.
[TJ01]
K.-D. Tuchs and K. Jobmann. Intelligent Search for Correlated Alarm Events in Databases. In Proceedings of the 7th IFIP/IEEE International Symposium on Integrated Network Management (IM 2001), pages 285–288, Seattle, Washington, USA, May 2001.
[TMF04a]
Shared Information/Data (SID) Model, Addendum 4S0 - Service Overview Business Entity Definitions. NGOSS Release 4.0, TeleManagement Forum, August 2004.
[TMF04b]
The NGOSS Technology-Neutral Architecture. NGOSS Release 4.5, TeleManagement Forum, November 2004.
[TMF05]
enhanced Telecom Operations Map (eTOM), The Business Process Framework for the Information and Communications Services Industry, TeleManagement Forum. GB 921 Release 5.0, April 2005.
[Udu99]
D. Udupa. Telecommunications Management Network. McGraw-Hill, 1999.
[Vaa02]
R. Vaarandi. Platform Independent Event Correlation Tool for Network Management. In Proceedings of the 8th IFIP/IEEE International Network and Operations Management Symposium (NOMS 2002), pages 907–909, Florence, Italy, April 2002.
[Wan89]
Z. Wang. Model of Network Faults. In Proceedings of the IFIP/IEEE International Symposium on Integrated Network Management (IM 1989), pages 345– 352, Boston, Massassuchets, USA, May 1989.
[Wek]
Weka 3 - Data Mining with Open Source Machine Learning Software in Java, University of Waitako. http://www.cs.waikato.ac.nz/˜ml/weka/. 321
Literature [Wie02]
H. Wietgrefe. Investigation and Practical Assessment of Alarm Correlation Methods for the Use in GSM Access Networks. In Proceedings of the 8th IFIP/IEEE International Network and Operations Management Symposium (NOMS 2002), pages 391–403, Florence, Italy, April 2002.
[WSA05]
Web Services Agreement Specification (WS-Agreement). Technical Report Version 7, OGF, Grid Resource Allocation Agreement Protocol WG, June 2005.
[WTJ+ 97]
H. Wietgrefe, K.-D. Tuchs, K. Jobmann, G. Carls, P. Froelich, W. Nejdl, and S. Steinfeld. Using Neural Networks for Alarm Correlation in Cellular Phone Networks. In International Workshop on Applications of Neural Networks to Telecommunications (IWANNT 1997), Melbourne, Australia, June 1997.
[WTM95]
A. Weiner, D. Thurman, and C. Mitchell. Applying Case-Based Reasoning to Aid Fault Management in Supervisory Control. In Proceedings of the IEEE International Conference on Systems, Man and Cybernetics, pages 4213–4218, Vancouver, British Columbia, Canada, October 1995.
[YKM+ 96] S. Yemini, S. Kliger, E. Mozes, Y. Yemini, and D. Ohsie. High Speed and Robust Event Correlation. IEEE Communiations Magazine, 34(5), May 1996. [ZXLM02] Q. Zheng, K. Xu, W. Lv, and S. Ma. Intelligent Search of Correlated Alarms from Database Containing Noise Data. In Proceedings of the 8th IFIP/IEEE International Network and Operations Management Symposium (NOMS 2002), pages 405–419, Florence, Italy, April 2002.
322
ABBREVIATIONS
AFS
Andrew File System
AI
artificial intelligence
API
application programming interface
ARM
Application Response Measurement
CBR
case-based reasoning
CGI
Common Gateway Interface
CIMOM CIM CI
CIM Object Manager Common Information Model Configuration Item
CMDB
Configuration Management Database
COBIT
Common Objectives for Information and related Technology
CPU
central processing unit
CRM
Customer Relationship Management
CSM
customer service management/Customer Service Management
DMTF
Distributed Management Task Force
DNS
Domain Name System
DoS
Denial of Service
DSL
Digital Subscriber Line
eTOM FAQ FCAPS GE GSM HA
enhanced Telecom Operations Map frequently asked questions fault, configuration, accounting, performance, security Gigabit Ethernet Global System for Mobile Communications high availability 323
Abbreviations HTML
Hypertext Markup Language
HTTPS
Hypertext Transfer Protocol Secure
HTTP IA IETF IP ISDN
Intelligent Assistant Internet Engineering Task Force Internet Protocol Integrated Services Digital Network
ISP
Internet Service Provider
ITIL
IT Infrastructure Library
itSMF IT KPI LAN LDAP
IT Service Management Forum information technology key performance indicator local area network Lightweight Directory Access Protocol
LMU
Ludwig-Maximilians-Universit¨at M¨unchen
LRZ
Leibniz Supercomputing Center
MBO
Management by Business Objectives
MBR
model-based reasoning
MIB MNM Team
Management Information Base Munich Network Management Team
MOF
Managed Object Format
MSE
ManagedServiceElement
MTBF
mean time between failures
MTTR
mean time to repair
MWN MX record NFS NGOSS NP
324
Hypertext Transfer Protocol
Munich Scientific Network (M¨unchener Wissenschaftsnetz) Mail Exchange Resource Record Network File System Next Generation Operation Support and Software nondeterministic polynomial
OGC
Office of Government Commerce
PHP
PHP Hypertext Processor
Abbreviations QoD
Quality of Device
QoR
Quality of Resource
QoS
Quality of Service
QT
quick ticket
RBR
rule-based reasoning
RDF
Resource Description Framework
RFC
request for change
SAP
service access point
SID
Shared Information/Data Model
SISL
Service Information Specification Language
SLA
service level agreement
SLM
service level management
SMONA
Service Monitoring Architecture
SMTP
Simple Mail Transfer Protocol
SNMP
Simple Network Management Protocol
TCP
Transport Control Protocol
TMF
TeleManagement Forum
TMN
Telecommunications Management Network
TTS TT
trouble ticket system trouble ticket
TUM
Technische Universit¨at M¨unchen
URL
Uniform Resource Locator
VPN
Virtual Private Network
W3C
World Wide Web Consortium
WAN
wide area network
WBEM
Web Based Enterprise Management
WSLA
Web Service Level Agreement
WWW
World Wide Web
XML
eXtensible Markup Language
325
INDEX
ACS, 83 active monitoring, 70 active probing, 71, 87, 88, 102–104, 179, 240 adaptation by abstraction, 83 adaptation methodology, 183 adaptation step, 82 administrative status, 157 Aggregated Business Entity, 57 aggregated event correlation, 117, 122, 127, 128 Aggregated System Entity, 57 alarm, 14 algorithm performance, 151 alpha network, 78, 171 Altusys, 87 AMaViS, 205 Andrew File System, 17, 198, 200 antecedent, 59, 133 Apache, 16, 79 application management, 2 application programming interface, 69 Application Response Measurement, 61 artificial intelligence, 71 assessment, 99 Assurance process, 47, 50, 53, 122 Authentication Service, 20, 21 automated case generation, 173 automated rule derivation, 154 autonomic computing, 241 Autonomous System, 196 availability, 161 Availability Management process, 40 Balanced Scorecard, 39 basic algorithm, 132, 133, 169, 170 basic architecture, 130 basic class model, 156, 157 belief network, 83–85 benefit, 4, 70, 107, 130, 184 beta network, 78, 171 Big-Oh, 151 Billing process, 47 binary state, 133
blacklisting, 210 BMC Remedy ARS, 22, 91, 195, 198, 217, 226, 229, 235, 237–240 Boeing NodeBrain, 217 business management, 2, 28 Cacti, 73, 234, 237 CANASTA, 87 candidate list, 110, 118, 122, 134, 141, 149, 170, 177 case database, 83, 154, 155, 172 case retrieval step, 82 case-based reasoner, 131, 132, 143, 148, 154, 193, 237, 238 case-based reasoning, 41, 82, 83, 85–87, 102–104, 128, 130–132, 154, 155, 166, 174, 176, 177, 179, 187, 226, 228, 240, 241 central processing unit, 18, 61, 113, 132, 157, 165, 186, 206 centralized event correlation, 70 Change Management process, 39, 41, 43, 45 change of dependency, 147 change of event, 147 change of reports, 111 CIM Object Manager, 56 Cisco Catalyst 6509, 196 COBIT, 39 code instrumentation, 61 codebook, 80, 81 codebook approach, 80, 102, 103 Common Gateway Interface, 16, 198 Common Information Model, 56, 57, 59, 94, 100, 101, 104, 155, 160, 162, 204, 210 CompositeDependency class, 160 CompositeInterResourceDependency class, 162 CompositeInterServiceDependency class, 161 CompositeServiceResourceDependency class, 162 Configuration Item, 40, 42, 45, 57 Configuration Management Database, 39, 44, 57, 100, 101 Configuration Management process, 39 Connectivity Service, 16, 19, 200, 202, 207, 229, 232
327
Index constraint-based reasoning, 75 Contract Definition Language, 93 correlation algorithm, 132 correlation failure, 149 correlation failure backup, 120 correlation optimization, 149 correlation window, 70 courier, 205 critic-based adaptation, 83 Critter, 83 CSM access point, 12 CSMTroubleReport, 65 customer, 10–12 Customer Interface Management process, 47, 53, 55, 111, 120 Customer QoS/SLA Management process, 49, 54 Customer Relationship Management process, 47, 62, 101, 111 Customer Service Management, 62, 64, 69, 101, 102, 104, 124–126, 128, 136–138, 147, 153, 157, 166, 170, 175, 177–180, 188, 189, 229, 236, 239 customer service management, 10, 12, 24, 25, 27, 38, 62, 95, 96, 98, 108–110, 114, 115, 119, 122, 128, 242 customer side, 10 customer-based SLA, 92 CustomerFacing Service, 57 data mining, 61 decision tree, 68, 102, 104, 125, 128, 178, 179, 229, 230, 232, 237 deficit, 6 definition of terms, 10 denial of service, 18, 35, 242 dependency, 16, 22, 24, 29, 59, 100, 110, 178, 195, 200, 204 Dependency class, 157, 160 dependency finding, 60 dependency graph, 59, 80, 133, 134 dependency identification, 77, 186 dependency matrix, 80 dependency modeling, 59, 70, 133 dependent, 59 design pattern, 58 device-oriented management, 2 Diagnose Problem process, 115, 121, 124 diagnosis workflow, 4, 22, 27, 106, 110, 180 Digital Subscriber Line, 194 distributed denial of service, 242 distributed event correlation, 70 Distributed Management Task Force, 56 Domain Name System, 16, 17, 60, 68, 205 Domain Name System Service, 16, 19, 198, 200, 207, 214 downstream suppression, 72 drawback, 130, 185
328
E-Mail Service, 15, 18, 20, 22, 35, 67, 68, 193–195, 204, 205, 207, 208, 214, 224, 229, 232–234, 237, 238, 240 early matching, 34 effort, 99–102, 104 Empolis Orenge, 226 enhanced Telecom Operations Map, 39, 46, 50, 55, 57, 62, 69, 92, 99–102, 104, 111–113, 115, 117–122, 124, 128, 177, 180, 239 enterprise management, 2, 28 Enterprise Management process, 47 error, 12, 14 Error Control, 45 event, 12, 13 event burst, 72 event clustering, 78 event compression, 77 event correlation, 7, 71, 72, 96 event correlation architecture, 129 event correlation framework, 106, 124, 128, 183 event correlation technique, 130 event correlation workflow, 110 event correlator, 106 event counting, 77 event detection, 73 event escalation, 78 event filtering, 77 event generalization, 78 Event Integration Facility, 218 Event MIB, 56 event modeling, 133 event specialization, 78 event storm, 72 event suppression, 77 event temporality, 78 event working set, 131, 139, 143 execution step, 83 expert system, 71 eXtensible Markup Language, 59, 93 f5 networks Big IP 3400, 196 failure, 14 fault, 12, 13 fault attribute, 28 fault detection, 14 fault diagnosis, 14, 22, 24, 70 fault localization, 71 fault management, 14 fault management attribute, 100, 177 fault management framework, 106 fault management phases, 3 fault management techniques, 38 fault propagation model, 71 fault recovery, 15 FCAPS, 2, 5, 35 Firewall Service, 16, 19, 198, 200, 207 FIXIT, 83
Index frequently asked questions, 110, 194, 236 Fulfillment process, 47 functional aspect, 72 functional model, 73 generic scenario, 24 GenericEvent class, 163 genericity, 26, 99–102, 104, 108, 176 geometric matching, 82 Global System for Mobile Communications, 76, 84 GNATS, 91 granularity, 27, 31, 32 graylisting, 206, 210 Grid computing, 194 Grid management, 73 Grid service, 92, 194, 242 GTE IMPACT, 76 HA software, 205, 206 Hamming distance, 81 happy medium approach, 94 Harvest, 198 hierarchical organization, 83 HP OpenView, 217, 234, 237 HP OpenView Event Correlation Services, 76, 212, 217, 233, 235 HP OpenView NetworkNodeManager, 22, 69, 195, 217, 218, 233, 235 HP OpenView ServiceCenter, 46 HP ProCurve 2824, 196 HP ProCurve 3448, 196 hybrid approach, 85 Hypertext Markup Language, 18 Hypertext Transfer Protocol, 15 Hypertext Transfer Protocol Secure, 16 IA Editor, 68 IBM Tivoli Application Dependency Discovery Manager, 62 IBM Tivoli Enterprise Console, 76, 214, 217, 219, 220, 226, 229, 233, 235, 237, 239, 240 IBM Tivoli NetView, 218, 233 impact analysis, 5, 35, 92, 104, 109, 110, 118, 122, 145, 160, 174–176, 180, 185 impact analysis and recovery framework, 97, 106, 174 inaccurate modeling, 148 incident, 39, 40, 111, 166 incident impact, 42, 175 incident management, 6, 23 Incident Management process, 39, 40, 42, 43, 46, 111, 120, 122 incident priority, 42 incident urgency, 42 Incremental Hypothesis Updating, 85 information modeling, 4, 7, 106, 155, 176, 200 InfoVista, 22, 93, 234, 237
Integrated Services Digital Network, 194 IntegraTUM project, 243 Intelligent Assistant, 22, 33, 62, 67, 69, 101, 102, 104, 125, 126, 128, 153, 177–180, 193, 195, 229, 230, 232, 233, 236, 239, 240 inter-resource dependency, 24, 29, 113, 162, 174 inter-service dependency, 24, 29, 113, 153, 161, 174 Internet Engineering Task Force, 56 Internet Information Model, 56 Internet Management, 100, 101 Internet Protocol, 61 Internet Protocol address, 15, 194, 196, 205, 206 Internet Service Provider, 60 InterResourceDependency class, 162 InterServiceDependency class, 161 intrusion detection system, 73 Ishikawa diagram, 44 Isolate Problem and Initiate Resolution process, 111, 120 IT Infrastructure Library, 23, 35, 39, 41, 44, 46, 50, 55, 57–59, 62, 69, 92, 93, 99–102, 104, 111– 113, 115, 117–122, 166, 175–177, 180, 183, 186, 211, 239, 240, 243 IT Service Management Forum, 39 ITTroubleReport, 65, 67 Java API (active probing), 87 JBoss rules, 217 jColibri, 226 JINSI, 69 Kepner and Tregoe diagram, 44 key performance indicator, 234 key term matching, 82, 143, 171 kind of dependency, 29, 113 kind of monitoring, 112 learning, 34, 84, 102, 109, 179 Leibniz Supercomputing Center, 6, 7, 15, 16, 18, 19, 21–23, 33, 35, 67, 68, 75, 91, 102, 162, 193– 195, 197, 198, 206, 207, 210, 217, 229, 232– 237, 239, 240, 243 life cycle, 7, 31, 183, 193 Lightweight Directory Access Protocol, 20, 205 likelihood, 70 Linux, 195, 206, 210 local area network, 73 logical model, 73 Ludwig-Maximilians-Universit¨at M¨unchen, 19, 205, 206, 234 Mail Exchange Resource Record, 205 mailbox, 19 main issue, 4 maintenance effort, 26 maintenance operation, 133, 137 managed object, 28, 157
329
Index Managed Object Format, 56 ManagedServiceElement, 133, 134, 138, 145, 146, 149, 157, 159, 160, 167–169, 179, 213, 220, 222, 224, 226 ManagedServiceElement class, 157 management area, 2 Management by Business Objectives, 96, 104 management discipline, 1 management functionality, 16, 19 management information, 28 Management Information Base, 56, 98 management layer, 27 management pyramid, 1 management side, 10 manual execution, 83 mean time between failures, 107 mean time to repair, 107 meshed organization, 83 metric, 28, 106, 109, 173, 177, 237 Micromuse Netcool, 76, 88, 152 Microsoft Excel, 195, 237 Microsoft Outlook, 19 Microsoft Visio, 195 Microsoft Windows, 19 missing event, 137 MNM Realization View, 10, 11 MNM Service Model, 6, 9–11, 18, 95, 104, 155, 176 MNM Service View, 10 MNM Team, 4, 10 model traversing technique, 71 model-based reasoning, 71, 73, 76, 102, 103, 131 modeling depth, 70 modeling granularity, 186 modeling of events, 163 Monitor Resource Performance process, 113 Monitor Service Quality process, 112 monitoring schedule, 112 motivation, 107, 113, 130, 155 Mozilla Mail, 19 multi-level SLA, 92 Munich Scientific Network, 15, 206, 207, 210, 229, 234 MySQL database, 198 myTUM portal, 206, 210, 236 Nagios, 73, 234, 237 negative event, 134, 189 NETeXPERT, 74 network and systems management, 71 Network File System, 17, 60, 198 network management, 2 Netzdoku, 210, 235, 237, 239 neural network, 61, 84 Next Generation Operation Support and Software, 57, 93 non-binary state, 146 NP-hard, 72, 80, 87
330
null adaptation, 83 Office of Government Commerce, 39 Open Service Nerve Center, 75 operational level agreement, 92 operational status, 157 Operations process, 47 Oracle database, 198 organizational dependency, 32 OTRS, 91 paradigm shift, 2, 5 parallel processing, 134 parameterized adaptation, 83, 143 passive monitoring, 70, 85 Petri net, 60 PHP Hypertext Processor, 16, 18, 198 ping, 14, 74 plausibility check, 101, 110 policy-based management, 78 positive event, 134, 189 postprocessing operation, 149 prediagnosis, 68, 101 preprocessing operation, 149 Proactive Problem Management, 46, 112, 113 probabilistic approach, 84 probabilistic fault model, 84 problem, 39 Problem Control, 43, 115, 117, 119, 121 Problem Handling process, 48, 53, 111, 120, 122 problem management, 6 Problem Management process, 39, 41, 43, 46, 112, 113, 115, 117, 119, 121, 122 Problem/Error Database, 39, 41, 42 procedural adaptation, 83, 143 process management framework, 38 provider, 10–12, 15 provider hierarchy, 1 provider side, 10 ProviderTroubleReport, 65 provisioning hierarchy, 133, 136 Proxy Service, 16 pseudocode, 133, 137, 138 QoR class, 157 QoRParameter class, 163 QoSParameter class, 156, 162 Quality Management Language, 93 quality of device, 94, 157 quality of resource, 147, 157, 159, 161–163, 165, 173, 176, 200, 212, 214, 242 quality of service, 1, 4, 11, 16, 19, 21, 49, 54, 78, 79, 90, 92–96, 103, 112, 127, 128, 147, 153, 156, 157, 159, 161, 162, 165, 166, 171, 173, 175, 176, 180, 184, 189, 190, 200, 203, 212, 214, 226, 232, 234, 235 quick ticket, 22, 91, 198, 236
Index redo analysis, 219 redundancy, 31, 133, 143, 145, 162 relevance matching, 82 representativeness, 21 request for change, 41, 43 requirement, 6, 9, 15, 26, 106, 108 requirements refinement, 108 requirements summary, 35 resource, 12, 16, 20, 133 resource attribute, 29 Resource class, 159 Resource Description Framework, 59 resource event, 13, 143, 152 resource event correlation, 116, 122, 127 resource event correlator, 124, 127 resource event generation, 112 Resource Facing Service, 57 resource fault management, 12–14 resource management, 27, 127, 128, 188 Resource Management & Operations process, 47, 52 Resource Performance Management process, 53, 113, 117 Resource Trouble Management process, 52, 54, 113, 117, 121, 122 ResourceEvent class, 165 Rete algorithm, 78, 79, 171, 217 Retention and Loyalty process, 49, 54 rich event, 5, 73 RMON MIB, 56 role, 10, 19 root problem, 13 rule database, 153 rule derivation, 171 rule generation, 79 Rule Markup Language, 78 rule type, 77, 167, 220, 240 rule-based reasoner, 131, 132, 143, 193, 237, 238 rule-based reasoning, 76, 78, 79, 81, 84–88, 102– 104, 127, 128, 130–132, 134, 143, 153, 155, 174, 179, 187, 217, 226, 240, 241 S/P Problem Reporting and Management process, 53, 112 S/P Service Performance Management process, 53, 112 scalability, 26, 79, 85, 99–102, 104, 108, 176 scope of managed objects, 28, 100, 177 security management, 242 semantic disparity problem, 93 Semantic Web, 78 sequential organization, 83 server load balancer, 196, 204 service, 10, 11, 133 service access point, 11, 12, 32, 89, 95, 96, 98, 112, 125, 127, 156, 159, 165, 167, 168, 171, 189, 232, 234 service attribute, 28
Service class, 156, 159 service delivery, 39 service dependency, 114 service desk, 22, 23, 40, 41 service event, 13, 107, 143, 152 service event correlation, 113, 122, 128, 137, 139 service event correlation example, 114 service event correlator, 128 service event generation, 110, 112 service fault, 3 service fault diagnosis, 106 service fault management, 3, 5, 13, 14 service functionality, 11, 31, 156 Service Information Specification Language, 58, 73 service level agreement, 1, 3–5, 11, 12, 16, 18, 19, 21, 24, 25, 38, 42, 45, 49, 54, 55, 57, 75, 91– 93, 95, 96, 98, 102, 103, 107, 112–115, 118, 126, 145–147, 153, 157, 159, 162, 171, 173, 174, 184, 186–190, 203, 212, 237, 242 service level management, 13, 93, 104, 180, 239 service management, 2, 27, 104, 128 Service Management & Operations process, 47, 50 Service MIB, 5, 58, 73, 98, 100, 101, 104, 124, 128, 131, 153–155, 162, 175, 176, 180, 185–187, 190, 195, 237 service modeling module, 154 service monitoring, 25, 112, 114, 124, 189 Service Problem Management process, 50, 54, 115, 121, 122 service quality degradation, 3 Service Quality Management process, 51, 54, 112 service request, 40 service support, 39 service-based SLA, 92 service-orientation, 2 service-oriented event correlation, 106, 107 service-oriented management, 2 service-resource dependency, 24, 29, 113, 117, 153, 162, 174 ServiceEvent class, 165, 166 ServiceFunctionality class, 156, 159 ServiceFunctionalityEvent class, 165, 166 ServiceResourceDependency class, 162 SGI Altix 4700, 194 Shared Information/Data Model, 57–59, 100, 101, 104, 155 Simple Event Correlator, 76, 217 Simple Mail Transfer Protocol, 19 Simple Network Management Protocol, 14, 56, 73, 75, 76, 100, 112, 164, 233 simplified event correlation framework, 124 single root cause assumption, 34, 70, 102, 109, 179, 219 SingleDependency class, 160 SLA class, 157 SLA language, 93
331
Index SLA management, 91, 109 SLA management handbook, 93 SLA verificator, 98 SLAng, 93 SLM translation problem, 94 Smarts, 80 SMONA, 58, 73, 127, 163 Spam, 205, 206, 210 SpamAssassin, 205 SpectroRx, 83 speech dialogue system, 62 SSH Service, 20 state transition graph, 75 Storage Service, 16, 18, 19, 198, 200, 207 Strategy, Infrastructure, and Product process, 47 strength attribute, 160 structure matching, 82 subservice, 11, 16, 19 Sun Microsystems, 206 Sun Netra X1, 197 supercomputing, 194 supervised execution, 83, 143 Supplier/Partner Relationship Management process, 53 Survey and Analyze Resource Trouble process, 113, 117, 119, 121, 124 symptom, 14, 17 symptom report update, 119 Syntegra, 205 system brittleness (RBR), 79 systems management, 2 Technische Universit¨at M¨unchen, 205, 206, 210, 234, 243 techno-centric approach, 94 Telecommunications Management Network, 72 TeleManagement Forum, 46, 63 terms, 10 testing, 34, 109, 112, 127, 133, 137, 169, 179, 189 threshold, 147, 157 Thunderbird, 19 time aspect, 72 time consideration, 133, 138 time constraint, 138
332
timer rule, 170 Tivoli Enterprise Console, 212, 237, 238 tool support, 27, 99, 108, 187, 188 top-down correlation, 169 topology aspect, 72 Transport Control Protocol, 19 trouble ticket, 22, 68, 69, 89–91, 166, 198, 226, 235– 237 trouble ticket system, 69, 89–91, 128, 226 underpinning contract, 92 Uniform Resource Locator, 17 unsupervised execution, 83, 143 usage functionality, 15, 19 usage side, 10 user, 10–12 user-centric approach, 94 validity time, 138 Virtual Private Network Service, 16, 194, 201 virtual user, 234, 236 Virtual WWW Server, 15 virus, 206 Web Based Enterprise Management, 56 Web Hosting Service, 15, 16, 20, 21, 35, 68, 75, 162, 193–196, 198, 200, 202, 204, 205, 207, 208, 210, 214, 222–224, 233, 234, 237, 238, 240 Web service, 55, 242 Web Service Level Agreement, 93, 94 Webmail, 20, 21, 197, 208 WebMail Service, 224, 228 Weka, 226 wide area network, 73 Wissenschaftsnetz, 196 workflow granularity, 99 workflow monitoring, 28, 99 World Wide Web Consortium, 59 worst case scenario, 151 WS-Agreement, 93 Yemanja, 74 Zope, 16, 17, 198, 202, 204, 210, 214, 222, 223
Index
333