BIOINFORMATICS APPLICATIONS NOTE Systems biology
Vol. 29 no. 18 2013, pages 2369–2370 doi:10.1093/bioinformatics/btt390
Advance Access publication July 4, 2013
Automated QuantMap for rapid quantitative molecular network topology analysis Wesley Schaal1, Ulf Hammerling2, Mats G. Gustafsson2,* and Ola Spjuth1,* 1
Department of Pharmaceutical Biosciences, Uppsala University, SE-751 24 Uppsala, Sweden and 2Cancer Pharmacology and Computational Medicine, Department of Medical Sciences, Uppsala University, Academic Hospital, SE-751 85 Uppsala, Sweden
Associate Editor: Alfonso Valencia
ABSTRACT
2
Summary: The previously disclosed QuantMap method for grouping chemicals by biological activity used online services for much of the data gathering and some of the numerical analysis. The present work attempts to streamline this process by using local copies of the databases and in-house analysis. Using computational methods similar or identical to those used in the previous work, a qualitatively equivalent result was found in just a few seconds on the same dataset (collection of 18 drugs). We use the user-friendly Galaxy framework to enable users to analyze their own datasets. Hopefully, this will make the QuantMap method more practical and accessible and help achieve its goals to provide substantial assistance to drug repositioning, pharmacology evaluation and toxicology risk assessment. Availability: http://galaxy.predpharmtox.org Contact:
[email protected] or
[email protected] Supplementary information: Supplementary data are available at Bioinformatics online.
2.1
Received on April 12, 2013; revised on June 14, 2013; accepted on July 2, 2013
1 INTRODUCTION Understanding interrelationships between drugs, toxins and other chemicals is an important part of discovering new ways to make better medicines, avoid toxicity or achieve any of a variety of goals for systems chemical biology (Oprea et al., 2007). For many applications, chemicals are commonly compared structurally according to computed or measured properties (Duffy et al., 2012). Another method is to compare the associations with biological systems. One notable application of this method is the connectivity map, which relates biologically active chemicals to gene-expression data (Lamb et al., 2006). Our published QuantMap method explores the connections of chemicals to proteins through protein–protein networks (Edberg et al., 2012). In this article, we adapt the partially manual QuantMap method to a rapid automated system with an easy-to-use interface, opening up for moderately larger datasets as well as integration with other tools in batch analysis. *To whom correspondence should be addressed.
METHODS Data sources
Chemical to protein relationships were taken from STITCH 3 (Kuhn et al., 2012) through the ‘chemical.aliases.v3.1’ and ‘protein_ chemical.links.detailed.v3.1’ tables available from http://stitch.embl.de. Protein to protein relationships (PPI data) were taken from STRING 9.0 (Szklarczyk et al., 2011) through the ‘protein.links.detailed.v9.0’ table available from http://string.embl.de. In both cases, taxonomy was limited to human (designated as 9606) for the current application. MySQL 5.5 (http://www.mysql.com) was used for building the local databases. Chemical identifiers (CIDs) and names generally correspond to PubChem (http://pubchem.ncbi.nlm.nih.gov) but are strictly limited to those found in STITCH 3.
2.2
Tools developed
QuantMap automation has been implemented in the Galaxy platform (Blankenberg et al., 2010; Giardine et al., 2005; Goecks et al., 2010) as a separate tool for data preparation and main calculation. The data preparation tool (named ‘QuantMap Prep’) was written in Perl (http://perl.org) for ease of text processing. This tool checks the list of input chemicals against the local STITCH database. Common names and CIDs known to STITCH are accepted and a table of acceptable CIDs with names is returned. Chemicals that cannot be found will be omitted from the next stage. The main QuantMap tool (named ‘QuantMap Server’) was implemented in R (http://www.R-project.org/) for access to network analysis tools. QuantMap Server approximates the procedure and parameters described in Edberg et al. (2012) and outlined in the Supplementary Figure S1. For each chemical (CID) cleared in the data preparation step: (1) Retrieve a list of 10 proteins (‘seeds’) closely associated with the current chemical from the local STITCH database. STITCH’s overall score with a minimum confidence of 0.7 is used as the measure of association. (2) Retrieve a list of up to 150 proteins associated with these proteins (PPI data) from the local STRING database. STRING’s overall score with a minimum confidence of 0.7 is used as the measure of association. (3) Calculate relative importance of the proteins in the PPI network as described in Section 2.3. (4) Condense the importance calculations to a single list ranked by the median of the importance measures. The ranked lists were combined using Spearman’s foot rule (Diaconis and Graham, 1977). This array of pairwise distances was analyzed by hierarchical clustering with hclust (complete) from the STATS package of R.
ß The Author(s) 2013. Published by Oxford University Press. This is an Open Access article distributed under the terms of the Creative Commons Attribution License (http://creativecommons.org/licenses/by/3.0/), which permits unrestricted reuse, distribution, and reproduction in any medium, provided the original work is properly cited.
W.Schaal et al.
Genistein
This clustering technique did not require the multidimensional scaling used in the previous work.
Raloxifene Endosulfan
2.3
Resveratrol
Centrality measures (network topology)
ICI 182,780
In Edberg et al. (2012), the relative importance of the proteins (represented as nodes in a network) for a single chemical was modelled by the centrality measures: betweenness, node degree, edge percolation component and bottleneck betweenness. These were matched or approximated in the R package igraph (Csardi and Nepusz, 2006) by the functions degree (number of connections to a node), betweenness (number of shortest paths through a node) and subgraph.centrality (number of subgraphs with a node, weighted by size of subgraph) based on computational similarity and rank correlation for a number of test compounds (unpublished data).
Tamoxifen Coumestrol 4−nonylphenol Diethylstilbestrol Zearalenone Bisphenol A Estradiol Rosiglitazone Elimepiride
3
Diclofenac
RESULTS
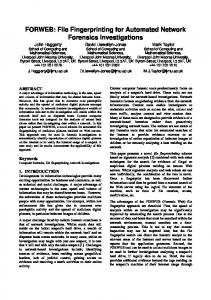
The QuantMap group of tools, encompassing QuantMap Prep and QuantMap Server, are available from the main menu of our Galaxy server (http://galaxy.predpharmtox.org). A list of chemicals identified by name or CID can be loaded into the text field of QuantMap Prep, which checks the names for applicability to the system. QuantMap Server is then run from the result of the preparation job. All chemicals with adequate PPI (according to step 2 of Section 2.2) will be used to produce a plot of the biological interrelationships. We demonstrate the automated QuantMap system using a dataset identical to the one used by Edberg et al. (2012), specifically for Estradiol, Diethylstilbestrol, Tamoxifen, Raloxifene, Fulvestrant, Genistein, Coumestrol, Resveratrol, Bisphenol A, 4-Nonylphenol, Dibutyl phthalate, Zearalenone, Endosulfan, Glimepiride, Rosiglitazone, Aspirin, Ibuprofen and Diclofenac. The dendrogram of Figure 1 shows the results of QuantMap Server applied to this dataset. Qualitatively, this figure is largely equivalent to the results by Edberg, such as the lone dibutyl phthalate and groupings of NSAIDs (Aspirin, Diclofenac and Ibuprofen) and antidiabetic drugs (Glimepiride and Rosiglitazone). The other compounds form a more complex pattern similar, but not identical, to the previous work. Differences could be due to the use of different centrality measures, as described earlier in the text. See Edberg et al. (2012) for a general discussion of the results. The execution time for this analysis was on the order of a few seconds. The speed advantage over a partially manual procedure is considerable. The possibility to create workflows in Galaxy and other types of automation compounds the benefits to help make this automated QuantMap system more practical and accessible. Funding: This work was supported by the Swedish Research Council [VR-2011-6129]; and the Swedish Strategic Research Program eSSENCE. Conflict of Interest: none declared.
2370
Aspirin Ibuprofen Dibutyl phthalate
Fig. 1. Dendrogram produced by QuantMap Server from the dataset used in this study. The compound list was run through QuantMap Prep to make a data table for QuantMap Server. Compounds separated by fewer branches are more similar to each other from a biological, rather than chemical, perspective. For cleaner display, short branches were flattened to approximate multibranching with di2multi in APE (Paradis et al., 2004)
REFERENCES Blankenberg,D. et al. (2010) Galaxy: a web-based genome analysis tool for experimentalists. Curr. Protoc. Mol. Biol, Chapter 19, Unit 19.10.1–21. Csardi,G. and Nepusz,T. (2006) The igraph software package for complex network research. InterJournal, Complex Systems, 1695. Diaconis,P. and Graham,R.L. (1977) Spearman’s footrule as a measure of disarray. J. R. Stat. Soc. Ser. B, 39, 262–268. Duffy,B.C. et al. (2012) Early phase drug discovery: cheminformatics and computational techniques in identifying lead series. Bioorg. Med. Chem., 20, 5324–5342. Edberg,A. et al. (2012) Assessing relative bioactivity of chemical substances using quantitative molecular network topology analysis. J. Chem. Inf. Model., 52, 1238–1249. Giardine,B. et al. (2005) Galaxy: a platform for interactive large-scale genome analysis. Genome Res., 15, 1451–1455. Goecks,J. et al. (2010) Galaxy: a comprehensive approach for supporting accessible, reproducible, and transparent computational research in the life sciences. Genome Biol., 11, R86. Lamb,J. et al. (2006) The connectivity map: using gene-expression signatures to connect small molecules, genes, and disease. Science, 313, 1929–1935. Kuhn,M. et al. (2012) STITCH 3: zooming in on protein–chemical interactions. Nucleic Acids Res., 40, D876–D880. Oprea,T.I. et al. (2007) Systems chemical biology. Nat. Chem. Biol., 8, 447–450. Paradis,E. et al. (2004) APE: analyses of phylogenetics and evolution in R language. Bioinformatics, 20, 289–290. Szklarczyk,D. et al. (2011) The STRING database in 2011: functional interaction networks of proteins, globally integrated and scored. Nucleic Acids Res., 39 (Suppl. 1), D561–D568.