Behavior Research Methods 2010, 42 (2), 507-516 doi:10.3758/BRM.42.2.507
Automated testing of cognitive performance in monkeys: Use of a battery of computerized test systems by a troop of semi-free-ranging baboons (Papio papio) Joël Fagot
CNRS and Université de Provence, Marseille, France and
Elodie Bonté
Université de Provence, Marseille, France and Université de la Méditerranée, Marseille, France Fagot and Paleressompoulle (2009) published an automated learning device for monkeys (ALDM) to test the cognitive functions of nonhuman primates within their social groups, but the efficiency of the ALDM procedure with large groups remains unknown. In the present study, 10 ALDM systems were provided ad lib to a troop of 26 semi-free-ranging baboons that were initially naive with computerized testing. The test program taught baboons to solve two-alternative forced choice (2AFC) and matching-to-sample (MTS) tasks. A million trials were recorded for the group during a period of 85 days (Experiment 1). Their analysis shows that 75% of the baboons participated at high frequencies and quickly learned the 2AFC and MTS tasks. In Experiment 2, we compared the baboons’ behavior when the ADLM systems were either accessible or closed. ALDM reduced frequencies of object-directed behaviors, but had no overt consequence on social conflicts. In Experiment 3, we tested the process of the global or local attributes of visual stimuli in MTS-trained baboons in order to illustrate the efficiency of ALDM for behavioral studies requiring complex experimental designs. Altogether, the results of the present study validate the use of ALDM to efficiently test monkeys in large social groups. ALDM has a strong potential for a variety of scientific disciplines, including for biomedical research. Supplemental materials for this article may be downloaded from http://brm.psychonomic-journals.org/content/supplemental.
Nonhuman primates are social animals, and their study can focus on either the social or nonsocial aspects of their cognition (Tomasello & Call, 1997). Researchers who are interested in social cognition need contexts in which the primates can express a rich repertoire of social behaviors. This social context is traditionally found in the wild or in research facilities in which the primates are maintained in groups in semifree conditions. By contrast, researchers interested in the nonsocial aspects of cognition prefer psychology protocols requiring a control of the task parameters (e.g., stimulus duration or display brightness) that is impossible in the wild or in semifree conditions. For their approach, the best experimental context is the laboratory in which the primates can be tested isolated (see, e.g., Fagot & Cook, 2006). Because neither of the two contexts promotes study on the interaction between the social and nonsocial aspects of the behaviors, the 20th century has witnessed a split between scientists who are interested in the social and nonsocial aspects of cognition. However, a growing body of evidence shows that social
factors influence the other aspects of cognition in humans (e.g., Gimmig, Huguet, Caverni, & Cury, 2006). Comprehensive theoretical accounts of cognition therefore need to articulate findings from social and nonsocial studies. Given their potential implications for (human) educational policies, there is also a growing societal demand for an understanding of the relationships between social behavior and learning abilities. These two reasons and others call for a greater interaction between the subfields of primate cognition focusing on the social and nonsocial aspects of the behavior, and the emergence of new methodologies favoring that integration. A small number of researchers have already attempted to combine the social and nonsocial comparative approaches by cognitive tests that are proposed to nonhuman primates who are maintained in their social groups. Pallaud and Lepoivre (1985) assessed reversal learning in a troop of baboons (Papio papio), using landmarks that were placed in the enclosure containing the social group. Reversal learning was demonstrated in this study, but was
J. Fagot,
[email protected]
PS
507
© 2010 The Psychonomic Society, Inc.
508 Fagot and Bonté limited to the dominant female of the group. Dréa and Wallen (1999), followed by Dréa (2006), studied discrimination learning in a large group of rhesus monkeys (Macaca mulatta). An originality of their approach is that the monkeys had to explore a battery of colored test boxes that were baited with a mixture of sand and peanuts. A large proportion of the subjects visited the boxes in this study, showing that members of a social group can voluntarily interact with the test systems. Monkeys in the Dréa and Wallen study also expressed complex social behaviors in this task, such as “playing dumb.” In another study, Andrews and Rosenblum (1994) introduced four joystick-controlled computer test systems in the living area of a small group of bonnet monkeys (Macaca radiata) and let the monkeys interact freely with the computers. Subjects were identified by radio frequency identification (RFID) tags injected in each forearm. All monkeys used the test systems and could therefore be tested on a voluntary basis. Unfortunately, the task only required subjects to respond to a target on the screen, which prevented predictions for more advanced cognitive testing. Other researchers (e.g., Evans, Beran, Chan, Klein, & Menzel, 2008) taught monkeys to voluntarily self-separate from their group to be singly tested in an experimental area adjacent to the living quarters. Beyond their scientific interests, all of these approaches also sought to promote animal welfare, by either reducing or avoiding the stress induced by separation from the group. We recently published an automated learning device for monkeys (ALDM) also using a RFID technology (Fagot & Paleressompoulle, 2009). ADLM consists of an opened test cage containing all of the necessary equipment traditionally available in laboratories using operant conditioning procedures—in particular, a touch screen for stimulus display and response recording, and a food dispenser for reward delivery, which the monkeys can voluntarily enter for self-testing. Baboons that were maintained in groups of 2 to 4 individuals interacted at a very high frequency with the computers (from 300 to 2,000 trials/day) and could learn cognitively complex tasks. Successfully learned tasks in that context were the Fitts’ task on motor control (Fagot & Paleressompoulle, 2009), a task of discrimination reversal using junk stimuli (Fagot & Paleressompoulle, 2009), a two-alternative forced choice (2AFC) task with greeble stimuli (Parron & Fagot, in press), a go/no-go picture orientation discrimination task (Fagot, Bonté, & Parron, 2009), a task requiring the subject to touch a key on the screen to control the orientation of a picture (Fagot et al., 2009), and the relational matching task, which is one of the most complex tasks for a monkey (Fagot & Parron, 2010). Although this set of studies reported excellent learning abilities, conclusions on the usefulness of ADLM in primate research remain limited for two reasons. First, the monkeys that have been used so far were kept in small-sized groups of 2 to 4 individuals, and it remains unclear whether social factors would prevent learning in larger groups maintained in a larger space. Second, the baboons involved in the previous research had a long experimental history with computer testing that may have also facilitated learning.
Ten ALDM test systems were recently introduced into a social group of 26 experimentally naive baboons that were living in a large enclosure. Three experiments will be reported below in order to describe our findings from that new use of ADLM. In Experiment 1, we first described how the group utilized the 10 test systems during a 4-month period, and we inspected the social and nonsocial factors affecting learning. In Experiment 2, we more directly studied the positive or negative consequences of the ADLM equipments on time budget. Finally, in Experiment 3, we illustrated the use of ADLM in these semifree baboons to test hypotheses requiring the sophistication of laboratory-type procedures. These three experiments will demonstrate the efficiency of ADLM to conduct cognitive tests in social groups of nonhuman primates. Experiment 1 Use of the ALDM Test Systems by a Troop of Baboons Method
Subjects and housing. The subjects belonged to a group of 26 Guinea baboons (Papio papio), consisting of 9 males (mean age 5 6.74 years, SD 5 9.86) and 17 females (mean age 5 7.31, SD 5 4.83) ranging from .3 years to 32.2 years, from the CNRS Primate Center in Rousset-sur-Arc (France). The baboons were situated inside an enclosure that is represented in Figure 1. It consisted of a large 25 3 30 m wire-meshed enclosure comprising various climbing structures and stones of different sizes for behavioral enrichment. Two tunnels connected the enclosure to a 6 3 4 m indoor housing that was used at night and during the feeding periods. The enclosure was also connected to two 8 3 4 m test rooms containing the ALDM equipment. The test rooms were accessible through holes made in the wire mesh. The baboons were completely naive to computer testing at the onset of the research. The baboons were all marked by two biocompatible 1.2 3 0.2 cm RFID microchips injected into each forearm. The monkeys were not food deprived. They received their ratio of monkey chow, vegetables, and fruit once a day in the housing area, often at 5 p.m., but at 9 a.m. during the weekend. Water was also continuously available in the enclosure and housing quarters.
Figure 1. Schematic plan of the research facility showing the test rooms (A) with their five ADLM, the enclosure (B), and the tunnels (C) connecting the housing area (D) to the enclosure.
Testing Cognitive Performance in Monkeys 509
A
B
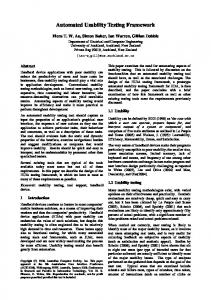
Figure 2. A baboon inside an ADLM test system, facing the view port, the two arm ports, and the receptacle receiving the rewards (Figure 2A). Entrance from the enclosure is on the right side. The touch screen is installed at eye level behind the front panel of the ADLM, and can be touched by introducing one arm through an arm port. Figure 2B shows a battery of five test systems installed in a test room.
Apparatus and computerized test systems. The experiment employed a battery of 10 identical ALDM systems, 5 in each test room, which were provided on a 24-h schedule to the troop of baboons. Each test system was similar in its general principle to the ALDM test system that was described in Fagot and Paleressompoulle (2009). Described briefly, this system allows for the automatic identification of the subject in the test system, allowing testing on a voluntary basis. Figure 2 shows a picture of the test systems (Figure 2A) and how they are installed in each test room (Figure 2B). Videos that may be downloaded as a supplement to this article provide additional views of the ALDM systems and show their use by the baboons. Each test system consisted of a freely accessible test chamber (0.7 3 0.7 3 0.8 m) of which the rear side could be either opened or closed with sliding doors. Opening the door allowed access to the test systems from the enclosure. The inner part of the ALDM test system was fitted at the innermost opaque front side
with a (7 3 7 cm) view port and two hand ports (8 3 5 cm, see Figure 2A). Looking through the view port allowed vision of a 19-in. LCD touch monitor installed at eye level, 25 cm from the view port. Introducing one hand through a hand port triggered a stimulus on the touch screen. The touch screen was surrounded by opaque panels and thus allowed stimulus display in well-controlled conditions. Two rectangular-shaped antennas were used to capture the subject identity, one antenna for each arm port. The antennas read the ID number of each participant when it introduced one of its forearms through one of the two arm ports. Numeric identification signals from the arm tags triggered the presentation of the stimulus and were used to assign behavioral measures (stimulus choices, reaction times [RTs], and movement times) to each participant. Grains of dry wheat were delivered as rewards inside the ALDM monkey area by a homemade food dispenser that was fixed atop the system, along with the computer and other electronic devices also installed there to be out of the reach of the subjects. One meter separated two adjacent test systems within the test room, with the exception of two systems that were separated by 20 cm only. Because the right side of the test system was opaque and the left side was transparent, the baboons could not see their counterpart in the adjacent test systems. The research was controlled by a test program that was developed by the first author using the Eprime language (Professional, V 2.0, Psychology Software Tools, Pittsburg, PA). This program has two main features. First, it allows an independent test regimen for each baboon. Second, the control of the test regimen is also independent of the identity of the ALDM test system(s) used by each subject. In other words, if a baboon has to be tested, say, in a series of 3,000 trials, these trials are delivered in the predetermined order via whatever test system(s) the animal chooses to use, and independently of the participation of the other members of the group in the research. This aspect of the procedure is permitted by network supervision of the test computers. Readers who are interested in the technical aspects of the ALDM test equipment (e.g., regarding the electronic components) are referred to Fagot and Paleressompoulle (2009). Training procedure. Each baboon received a training program consisting of five main training phases of progressive complexity, with intermediate steps. The goal of the training procedure was to have baboons learning to introduce their arms through the arm port for self-presentation (Phase 1), to touch a stimulus on the screen (Phases 2–3), and to solve 2AFC (Phases 4a–4e) and matchingto-sample (MTS; Phases 4a–4e) problems. The procedures used in these test phases are described below: Phase 1: Self-identification triggered a picture showing a texture on the screen and delivered a reward. Phase 2: Self-identification displayed the same picture as in Phase 1, but delivered the food after a delay of 1 sec (Phase 2a), 4 sec (Phase 2b), 15 sec (Phase 2c), and 40 sec (Phase 2d), or when the baboon touched the screen. Phase 3: Self-identification displayed a 300 3 300 pixel red square during a 15-sec maximum. Touching that stimulus delivered the reward. Phase 4: Self-identification displayed two different 300 3 300 pixel colored shapes for 3 sec maximum, with random variations of their left–right locations. One was the positive stimulus (S1); the other was the negative stimulus (S2). Touching S1 delivered the reward. Touching S2 delivered a 3-sec time-out. New pairs of stimuli were used in Phases 4b–4e. Phase 5: Self-identification displayed a sample stimulus that was selected randomly from a set of eight geometrical 300 3 300 pixel colored shapes. Touching that stimulus within a 3-sec delay displayed two stimuli, one (S1) identical to the sample and the other different from it (S2). Touching S1 delivered the reward. S2 was displayed at a very low brightness in Phase 5a, but the brightness was progressively increased to normal from Phase 5a to Phase 5d. Phase 5e assessed generalization with 16 novel stimuli. In all training phases, an intertime interval (ITI) of 3 sec minimum was imposed between two consecutive trials. The screen
510 Fagot and Bonté turned black during that ITI period, after which it turned light gray until the subject introduced an arm through the arm port for selfpresentation. The behavior of each individual was monitored several times a day in order to adjust the difficulty of training. From training Phase 1 to training Phase 2b, self-presentation sufficed to consider a trial as correct and to reward it. In the next training phases, correct responses required that the screen area corresponding to the S1 stimulus be touched. In general, the subject was assigned to the next training phase or subphase after it achieved a performance correct of 80% or more in at least 200 consecutive trials, but the baboons were occasionally overtrained in some training phases to stabilize learning. The baboons had a first access to the ALDM systems on January 24, 2009. We report below the use of the test systems from that first day to May 17, 2009. Although the ALDM test systems were mostly available for training during that period, they were occasionally closed during several consecutive days for the purpose of the test of social dominance (reported below), for the purpose of Experiment 2, or for technical maintenance. The data presented in Experiment 1 were therefore collected during a total of 85 full days, recorded from January 24th and May 17th, during which the baboons could freely interact with the test systems. Some baboons quickly reached the training criterion in all training phases, whereas others were slower. When the training program was completed, the fastest baboons received a different research program on visual attention. This experiment is reported in the present Experiment 3. Test of social dominance. A test of social dominance was proposed in order to examine potential social influences on learning. This test involved the distribution of controlled quantities of wheat grains in areas measuring 1, 3, 5, 7, 9, or 11 meters, 30 cm behind the wire-mesh enclosure. Three test sessions were given in a random order, for each condition of food delivery, and the identity of all subjects who obtained at least one piece of food within a session was recorded during the minute following the baiting process. A social index (S-I) was computed from these data. A consideration of the S-I suggested that it was more challenging to obtain the food when it was scattered within a narrower area. The reaches were assigned different weight values, considering the length of the baited area, using a weight value of 6 for the 1-meter zone, 5 for the 3-meter zone, and 4, 3, 2, and 1 for the remaining zones, respectively. The S-I was calculated as the sum of the weighted values of the food accesses that were recorded during the experiment. With this procedure, the S-I may have ranged from 0 (when a baboon was uninvolved) to 63 (when it always obtained a food item), the highest S-I characterizing the dominant subjects. All tests of social dominance were run when the ALDM test systems were inaccessible.
Results Analysis of trial frequencies at the group and individual levels. Two female baboons of the ages 8.9 (i.e., subject ROM) and 6.7 years (i.e., subject TAR) were removed from the group during the research, due to sickness. Four other baboons that were less than 1 year old were unable to touch the computer screen because of their short arm length. The data reported below were thus recorded on 20 baboons, excluding these 6 baboons. Before considering their performance in the different learning phases, we will describe the overall use of the test systems by the group. The baboons used the test systems at very high frequencies. Altogether, we recorded a total of 1,000,000 interactions with the computer during the 85 days of the study period. This number corresponds to a mean number of 11,696 trials collected by the group each day. Table 1 indicates the gender, age, and S-I index of each subject, along with its contribution to the 1,000,0000 trials. Individual
Table 1 Gender (Male, Female), Age (in Years), Social Index (S-I), Number of Recorded Trials (N ), and Corresponding Percentage of Trials for Subject Subject Gender PIP Male PET Female BRI Female MON Female LEA Female MIC Female MIL Male KAL* Female URA Female VAN* Female ATM* Female ARI* Female ANG* Female VIO* Female BAR* Male CAU* Male ART* Male VIV* Male BOB* Male CLO* Male Note—Baboons that are Experiment 3.
Age S-I N % 9.6 57 95 ,0.01 10 63 125 ,0.01 13.1 8 943 0.1 12 40 2,338 0.1 13.1 0 2,489 0.2 13.1 1 27,422 2.7 32.2 26 27,877 2.8 13.5 3 28,501 2.9 5.2 13 30,989 3.1 4.7 9 58,157 5.8 11 0 58,837 5.9 3.4 21 60,149 6.0 3.8 51 61,704 6.2 4.2 51 64,423 6.4 2.7 52 84,248 8.4 1.9 40 90,047 9.0 3.4 52 92,736 9.3 4.4 51 96,245 9.6 3.4 3 99,946 10.0 2.1 57 112,729 11.5 indicated by an asterisk participated in
total trial frequencies varied from 95 to 112,729 (M 5 50,000, SD 5 38,422). A few baboons only rarely used the ALDM systems (Subjects PIP, PET, BRI, MON, LEA), and they were either male or female adults. PIP and PET, the least active subjects, were the highest ranking. The rest of the group used the ALDM system for more than 20,000 trials during the study period. An inspection of Table 1 suggests a trend of the most active baboons being the youngest ones. That trend was confirmed by a reliable Pearson correlation coefficient (r 5 2.61, p , .01). By contrast, Table 1 converges with Pearson correlation statistics to suggest a lack of clear-cut relationships between trial frequencies and the S-I (r 5 .24, p . .05). Finally, males participated more, on average, than females (M 5 75,490, SD 5 26,771, and M 5 33,006, SD 5 39,556, respectively). This effect emerged significantly from a one-way ANOVA considering gender as the unique factor [F(1,18) 5 8.32, p , .01]. We also tried to capture how the activity of the group evolved with continuing practice. The data sets obtained during the months of January, February, March, April, and May were split, averaged across subjects, and then plotted against the time of day. Figure 3 shows that the participation increased with continuing testing. For the group, the average number of trials collected each day were equal to 1,327, 6,378, 12,128, 15,749, and 14,731, for the months of January to May, respectively. An inspection of Figure 3 also demonstrates that the test systems were almost occupied full-time and were even more so when the days lengthened during the spring season. In May, the test systems were consistently used nonstop from 5 a.m. to 7 p.m., and trials were even recorded after 9 p.m. Fagot and Paleressompoulle (2009) reported that some their baboons performed a substantial number of trials during the night. This was not observed in the present study. In
Testing Cognitive Performance in Monkeys 511 2,000
Mean Number of Trials/h
1,800 1,600 1,400
January
1,200
February
1,000
March April
800
May
600 400 200 0 5
6
7
8
9 10 11 12 13 14 15 16 17 18 19 20 21 22
Time of Day Figure 3. The number of trials recorded on average for the group (all participants confounded) during each month, as a function of time of day.
the present research, the continuous use of the test system during daytime confirmed the readiness of the baboons to interact with the ALDM test systems. Another analysis considered the length of runs. A run was defined as a series of consecutive trials of the same individual within the same test system, with no break of more than 3 min between two consecutive trials. Two dependent variables were derived from the runs. The first one was the average length of the runs obtained per baboon and month; the next concerned the length of the longest run made each month by each individual. Figure 4 demonstrates a progressive lengthening of the runs from
January to May, the initial runs being much shorter on average (M 5 7.44 trials; SD 5 3.95) than the final ones (M 5 20.9 trials; SD 5 12.24). This effect was reliable, as was calculated by a one-way ANOVA [F(4,95) 5 7.04, p , .001]. An application of the same analysis on the maximum run length confirmed that the participants exhibited runs much longer in May (M 5 229.8 trials) than in the earliest training phases (M 5 53.7) [F(4,95) 5 7.58, p , .001]. Analysis of learning performance. Table 2 reports the number of trials required by each baboon to learn the 2AFC and MTS tasks, and the duration of each training
30 250 25
150 15 100
10
Longest Run (in Trials)
Run Length (in Trials)
200 20
50
5
0
0 January
February
March
April
May
Figure 4. Mean run length (opened bars, leftmost y-axis) and mean length of the longest runs (line, rightmost y-axis) and standard errors as a function of test month.
512 Fagot and Bonté Table 2 The Number of Trials and Corresponding Number of Days (in Parentheses) to Criterion for Each Subject in Each Training or Test Phase Subject ANG ARI ART ATM BAR BOB BRI CAU CLO KAL LEA MIC MIL MON PET PIP URA VAN VIO VIV
Phases 1–2 2,958 (12) 3,562 (14) 3,720 (11) 3,781 (13) 4,072 (12) 4,827 (12) 873 (35) 3,233 (9) 3,931 (11) 2,649 (13) 2,423 (39) 3,252 (14) 3,878 (16) 2,087 (23) 125 (17) 95 (17) 3,982 (16) 5,320 (13) 2,519 (12) 4,555 (11)
Phase 3 4,162 (7) 4,397 (7) 8,878 (11) 6,298 (8) 7,178 (7) 9,563 (9) 70 (16) 7,711 (12) 7,993 (9) 3,853 (6) 66 (6) 2,055 (6) 2,677 (12) 251 (7) ------2,166 (6) 4,973 (8) 6,766 (7) 9,472 (12)
Phase 4 Training Transfer 6,456 (9) 4,072 (8) 8,058 (9) 4,719 (6) 11,339 (9) 7,858 (8) 10,300 (9) 4,651 (8) 10,608 (9) 7,808 (7) 13,171 (9) 8,870 (8) ------9,783 (9) 7,360 (8) 12,154 (9) 8,561 (8) 2,390 (13) 2,701 (8) ------5,881 (13) 5,519 (18) 3,594 (8) 3,159 (8) ------------------907 (6) 4,479 (7) 8,572 (9) 5,910 (8) 6,889 (9) 6,129 (6) 10,974 (9) 7,714 (8)
phase. Fifteen of the 20 baboons involved in Experiment 2 promptly learned the 2AFC and MTS tasks. All of the test phases combined, the training of these 15 baboons required from 40 to 67 days. The remaining 5 baboons involved in the task either never learned to touch the screen (n 5 2, Subjects PET and PIP) or did learn to touch it but showed no motivation to interact with the computer in training phase 3 (Subjects BRI, MIL, and MON). Discussion The results of Experiment 1 demonstrate an extremely high motivation of the baboons to interact with the ADLM test system in a context in which these systems were provided ad lib to a large group of freely behaving baboons. Interestingly, high trial frequencies in our tasks do not reflect a transient response to a novel test situation, since the use of the test systems progressively increased in frequencies from January to May. The results of Experiment 1 also confirmed Fagot and Paleressompoulle’s (2009) conclusions that an unconstrained access to the ADLM system allows learning. Although naive at the onset of the research, a large proportion of the subjects (i.e., 75% or the group) promptly learned to interact with the touch screen in Experiment 1 (Training Phases 1–3) and could furthermore learn the 2AFC and MTS procedure during the period dedicated to Experiment 1. Experiment 2 Effects of the ALDM Test Systems on the Activity of the Group In Experiment 2, we aimed to detect the influence of the ALDM test system on the activity budget of the troop. We recorded the frequencies of object-directed, self-directed, and socially directed behaviors of the group members, and we compared these frequencies when the access to the test systems was either permitted or prohibited.
Method
Phase 5 2,005 (9) 2,177 (9) 2,270 (7) 1,476 (7) 2,613 (8) 4,866 (13) ---2,708 (7) 3,275 (8) 2,511 (18) ---2,403 (16) 3,566 (13) ---------1,326 (6) 1,674 (9) 1,614 (6) 2,465 (7)
Sum 19,653 (45) 22,913 (45) 34,065 (46) 26,506 (45) 32,279 (43) 41,297 (51) 943 (51) 30,795 (45) 35,914 (45) 14,104 (58) 2,489 (45) 19,110 (67) 16,874 (57) 2,338 (40) 125 (17) 95 (17) 12,860 (41) 26,449 (47) 23,917 (40) 35,180 (47)
Subjects and housing. These were identical to those in Experiment 1, except that subject ROM was reintroduced in the group after she had recovered from sickness. Test procedure. The baboons were video-recorded inside their enclosure when the test systems were either closed or opened. The procedure followed an ABBA–BAAB design, beginning by a closed period. Each A and B period in the design was 2 days long, resulting in a total of 16 days of video recording. A focal-animal sampling procedure (Altmann, 1974) was adopted, using a Sony DCR-HC51E camera recorder (Sony Corp, Japan). Seven sessions were run each day, with one session every hour from 10:30 a.m. to 4:30 p.m., before baboons received their daily food at 5:30 p.m. Each session lasted 30 min. Using a new random sequence in each session, a new member of the group was video-recorded every minute within a session. The behavior expressed by this animal 30 sec after the onset of its focal recording was coded, first online (by vocal recording), and then offline from the videotapes. If a baboon was not visible during its time period, there was one (but only one) new attempt to film it again at the end of the session. The sessions were postponed to the next favorable day in case of rain or cold weather (temperature below 7ºC). A total of 113 behaviors were analyzed per baboon in Experiment 2; these behaviors were coded considering the five main categories defined below. Object-oriented behaviors: Any behavior directed toward the floor, stones, food items, wood sticks, wire-mesh, climbing structure, or accessible grass at the vicinity of the enclosure. Socially oriented behavior: All behaviors involving at least two individuals. We distinguished socially positive behaviors—such as playing, grooming, and sexual behaviors—from socially negative ones, such as aggression. Self-oriented behaviors: Actions toward one’s own body, such as auto-grooming. Locomotion: The animal moves inside the enclosure, either by running or walking, in absence of overt interactions with other social partner(s). Rest: No action is observed (e.g., is sleeping). Others: Any action that cannot be included in the above four categories. Each category was exclusive from the others, resulting in one data point per animal/session. The behavioral sequences were all coded by the second author. A second independent person also coded a
Testing Cognitive Performance in Monkeys 513 20 18
*
16
*
No ADLM ADLM
Frequency
14 12 10 8 6 4 2 0 Locomotion
Self
Object
Rest
Social
Figure 5. Frequencies of category of social and nonsocial behavior recorded in Experiment 2, depending on whether the battery of ADLM systems was opened or closed. *p , .05.
series of 220 actions. The agreement was high (81%) and reliable (Cohen’s k 5 .77, p , .05).
Results and Discussion Figure 5 reports behavioral frequencies, depending on the availability of the test systems. The behavioral category “others” was dropped from all analyses because it is ill-defined. A gender (male, female) 3 test condition (ALDM systems opened or closed) ANOVA was computed on the frequencies obtained for the object-oriented, socially oriented, self-oriented, locomotion, and rest categories. Findings first revealed reliable effects of test condition for the object and rest behaviors. Use of the ADLM test systems reduced significantly the frequency of objectoriented behaviors [mean opened 5 13.29, mean closed 5 16.7; F(1,19) 5 9.35, p , .01] and the frequency of rest [mean opened 5 17.95; mean closed 5 15.48; F(1,19) 5 4.71, p , .05]. These effects are illustrated in Figure 5. The ANOVAs also revealed a reliable gender 3 test condition interaction when the locomotion was considered [F(1,19) 5 9.41, p , .01]. Males had a higher frequency of locomotion behaviors when the ADLM systems were closed (M 5 8.13) than when they were opened (M 5 6.12). The females showed the opposite trend (mean opened 5 6.23; mean closed 5 7.46). ADLM had, by contrast, no clear-cut effect on the other behavioral categories and noticeably did not increase or reduce the frequencies of social-directed behaviors. The fact that ALDM increases the frequencies of object-directed behaviors observed within the enclosure suggests that this systems satisfies the need of the monkeys to interact with objects. Because the opening of the test systems provided an additional source of food, we also verified whether the availability of that resource triggered social conflicts. A gender (male, female) 3 test condition (opened, closed) 3 social behavior (positive, negative) ANOVA was calculated for that purpose. The main effect of social behavior was reliable, but it interacted with gender [F(1,38) 5 11.12, p , .002]. Both genders expressed much more positive social behaviors than negative ones, although the differ-
ence between these two conditions was smaller for males (mean positive 5 7.56, SD 5 4.5; mean negative 5 1.19, SD 5 0.4) than for females (mean positive 5 13.04; SD 5 5.25; mean negative 5 0.27, SD 5 0.45) [F(1,38) 5 11.12, p , .01]. Since the test condition had no reliable effect on the frequency of positive (overall mean 5 0.24, SD 5 0.43) and negative social behaviors (mean 5 10.95; SD 5 5.61), and did not interact significantly with the other factors, it can be concluded that the ADLM test systems did not change the nature of the social interactions between group members, and it did not promote social conflicts. Experiment 3 Use of the ADLM in a Complex Test Design Some baboons completed the five training phases faster than others. In April, 12 baboons who had completed Training Phases 1–5 were tested using a more advanced experimental program. Fagot and Deruelle (1997) demonstrated that baboons perceiving hierarchical visual stimuli, such as a large square made of smaller squares, prioritize the processing of the local features of these stimuli, in sharp contrast with humans (Navon, 1977). Global and local processing was studied in Experiment 3 using the MTS procedure. The presentation of Experiment 3 in the present article mostly aims to demonstrate that efficient, well-controlled experiments are possible with ADLM in our research context. Method
Subject, Apparatus, and Living Conditions. Twelve baboons participated in Experiment 3. They are indicated by a star in Table 1. All of the baboons had already acquired the MTS task at the onset of Experiment 3 and had successfully transferred to novel stimuli in training phase 5 (see Experiment 1). Procedure. The procedure involved a first training phase, followed by a test phase. In the trials of the training phase, the baboon saw a fixation point (FP) after the self-identification procedure. Touching the FP displayed the initial sample stimulus in the center of the screen that had to be touched to trigger the display of the S1 and S2 stimuli—the two comparison stimuli. S1 was always identical to the sample, and S2 was different from it. Touching S1
514 Fagot and Bonté Table 3 Agenda of the Training and Test Phases for the Baboons in Experiment 3 Subject Day 1 Day 2 Day 3 Day 4 Day 5 Day 6 ANG Train 1 Test Test ARI Train 1 Test Test Test ART Train 1 Test Test ATM Train Train Train 1 Test Test BAR Train 1 Test Test BOB Train 1 Test Test CAU Train 1 Test Test CLO Train 1 Test Test KAL Train Train Train 1 Test Test Test Test VAN Train 1 Test Test VIO Train Train 1 Test Test VIV Train 1 Test Test Note—“Train 1 Test” indicates that the baboons reached the training criterion the considered day, after which the test started. “Train” and “Test” indicate that only training or test trials, respectively, were proposed during that day.
after its display provided a food item. An incorrect selection of S2 produced a time-out of 3 sec during which the screen turned green. The training consisted of sessions of 100 trials, using a random selection of stimuli selected from a set of 50 previous unseen yellow visual stimuli of 100 3 100 pixels maximum, with the left–right location of S1 counterbalanced. These sessions were automatically repeated until the baboon made three consecutive sessions with a performance equal to or greater than 80% correct in each session. Achieving this criterion automatically triggered the test phase. The test phase involved 15 consecutive test sessions of 112 trials/ baboon (total 5 1,680 trials/baboon). One-hundred of these trials were baseline trials that were identical to training. Baseline trials were all reinforced when the baboons responded correctly. The remaining trials of each session (n 5 12) were probe trials using a similarity matching procedure, and they were randomly reinforced on 80% of the trials. The sample stimulus in each probe trial was a first hierarchical stimulus that could be either a circle made of squares, or a square made of circles. The comparison stimuli matched the sample at one stimulus level, either the global or local level. Assuming the sample was a circle made of squares, one comparison (the global match) was a circle made of circles; the other comparison (the local match) was a square made of squares. From that design, selecting either stimulus expressed a preference for the global or local match. The location of the global and local matches was counterbalanced, as were the size and density of the stimuli. Four probe trials per session used large, dense stimuli (90 3 90 pixels wide, made of 16 local elements). Four others used large, sparse stimuli (90 pixels wide but only eight local elements), and the remaining 4 used small, dense stimuli (50 3 50 pixels, eight local elements). When a baboon had completed its 15 test sessions, the test stopped and it received 2AFC “standby” trials using colored squares as stimuli. 2AFC trials were run until the 12 subjects had completed the test program.
Results and Discussion The participants required from 3 to fifteen 100-trial sessions to reach the training criterion (M 5 5.33 sessions, SD 5 3.37). The average overall performance in the training sessions ranged from 76.6% correct to 91.3% correct (M 5 83.2%, SD 5 5.6%). That performance confirmed that the baboons had mastered the matching task and further demonstrated their ability to maintain attention to the task during the experiment. We initially verified that the baboons continued to be correct when the probe trials were introduced in the test sessions: Average performance was 89.9% correct in these trials (SD 5 2.69%). The next analysis focused
on probe trials to check potential local or global bias in the processing. On average, 56.63% of the responses favored the local match. In agreement with our previous research (Deruelle & Fagot, 1998), the computation of a gender (male, female) 3 stimulus (large-sparse, largedense, small-sparse) ANOVA revealed that local choices were more prevalent with the large-sparse stimuli (66.1%, SD 5 21%) than with the small-dense (54.2%, SD 5 14.8%) and large-dense (54.1%, SD 5 16.2%) stimuli. The difference between these three conditions was reliable [F(2,20) 5 7.7, p , .01]. Overall, the results of Experiment 3 confirm the trend for the processing of the stimulus level favoring the local elemental features, and suggest that baboons differ from humans (Navon, 1977) in global/local processing (for a discussion on the significance of the local bias in nonhuman primates, see Fagot & Barbet, 2006). More importantly, for the purpose of the present article, Table 3 indicates the duration of the training and test phases for each subject. The full experiment required a total of 6 days to be completed. Nine baboons reached the training criterion in a single day, 3 required 2 days of training, and the remaining required 2–3 days. The testing phase was as quick as the training phase. Eleven baboons needed 2 days to achieve testing, and the slowest baboon (Subject KAL) needed 4 days of testing. The results of Experiment 3 therefore confirm the baboons’ motivation to interact with the ALDM systems. In this research, we could train and test a reasonably large number of baboons (n 5 12) with an experimental design of the same level of sophistication as that in more traditional laboratories. This could be achieved with ADLM, although the other members of the group continued to receive the training procedure of Experiments 1, 2, with semifree unconstrained individuals. General Discussion We have previously shown that ALDM promotes high rates of participation and complex learning in a smallsized group of 2–4 monkeys (Fagot & Paleressompoulle, 2009). The present research confirms these findings and also extends them to monkeys that are maintained in a
Testing Cognitive Performance in Monkeys 515 socially enriched (larger group) and physically enriched (bigger enclosure) environment. A confirmation of the results of Fagot and Paleressompoulle derives from the million of trials collected on the group during this study, and also from the fact that a substantial proportion of the baboons that were old enough to be tested (i.e., 15 out of 20) promptly learned the 2AFC and RMTS task with that protocol (Experiment 1). Because ADLM adapts training to learning speed, the fact that some baboons declined testing during Experiment 1 is in no way definitive. Although not reported in detail here, ADLM training continued after the completion of Experiments 1–3. One month after the completion of Experiment 1, we successfully recruited 6 additional subjects from a group of now 22 baboons (including Subjects TAR and ROM) that are old enough to interact with the computers. These newly recruited baboons daily perform from several hundreds of trials (Subjects PIP, BRI, ROM, TAR) to more than 1,000 trials (Subjects LEA, MON) each day. Subjects LEA, MON, and ROM have also successfully learned the 2AFC and MTS tasks since the completion of Experiment 1. Only PET, the alpha female (see Table 1), continues to decline testing. Two main problems might occur during the cognitive testing of animals in their social group. The first one is that the dominant subject may prevent the other members of the group from using the test systems, as dominant monkeys often do when they compete for a rare (food) resource (see, e.g., Itani, 1958). The other potential problem is that group testing might induce low attention to the task (Toxopeus, 2004). Neither of these two complications emerged in our laboratory. Thus, there were no more social conflicts during ADLM testing than there were when access to the test systems was prohibited (Experiment 2). In addition, the excellent learning performance in Experiments 1 and 3 demonstrates sustained attention to the task. In our view, the efficiency of our procedure is warranted by a balanced ratio between the number of subjects and the number of ADLM (approximately 1:2 here and 1:3 in Fagot & Paleressompoulle, 2009), which induces a slight social pressure to interact with the test systems while avoiding major social conflicts. In addition, the design of the ADLM test cages reduces distraction because (1) the baboon is spatially separated from its group when it enters the test room, and (2) it has no vision of the other members of the group inside the ADLM systems. The active control of the tasks by the subject (who triggers the trials) and its voluntary participation might have also promoted attention and learning. In conclusion, we would like to stress the major interests of ADLM for primate studies. In our view, that new approach of primate cognition offers at least seven main advantages, in comparison with previously used procedures. First, ADLM allows researchers to efficiently collect a large volume of data, both in complex tasks and in a substantially larger number of subjects than with more traditional tests. Second, because the monkeys are maintained within their social group, ADLM favors integration of the social and nonsocial aspects of cognition. Third, the use of ADLM is not restricted to baboons (Fagot & Paleressompoulle, 2009, and the present study) or macaques
(Fagot & Paleressompoulle, 2009). After modifications to adapt the procedure to the desired species, ALDM can potentially be employed with a variety of nonhuman primate species, and some nonprimate animals as well. Fourth, also after procedural adaptations, ADLM may be used for testing in sensory modalities other than vision (e.g., auditory or haptic perception). Fifth, ALDM may constitute an interesting tool for biomedical research—for instance, in studies on the motor, attentional, motivational, cognitive, or social consequences of pharmacological treatments or brain lesions. Sixth, new technologies will emerge in the near future to record body (e.g., ECG) or brain (EEG, electrophysiology) signals using wireless technologies (e.g., Jürgens & Hage, 2006). ALDM opens avenues for recording these signals in unconstrained animals. Finally, and maybe more importantly, ADLM testing favors a humane treatment of nonhuman primates in experimental research. For all of these reasons and others, ADLM has the potential to trigger a procedural shift in primate research, for the benefit of both science and animal well-being. Author Note J.F. contributed the development of the ADLM test systems, data collection, data analysis, and writing. E.B. contributed data collection and data analysis. This project was supported by the CNRS life science department and a grant (Project Ethique, Volet Recherches Exploratoires, 2008) from the Conseil Régional Provence-Alpes-Côtes d’Azur. Guy Dubreuil, Georges Di-Grandi, Sebastien Guiol, Jean-Christophe Marin, and Dany Paleressompoulle are acknowledged for technical supports. E.B. was supported by a PHD grant from the Conseil Régional Provence-Alpes-Côtes d’Azur. This research was approved by the Comité d’Éthique de Marseille Pour l’Expérimentation Animale. Correspondence concerning this article should be addressed to J. Fagot, LPC/ CNRS/UMR 6146, Pôle 3C, 3 place Victor Hugo, Bat 9, Case D, 13331 Marseille Cedex 1, France (e-mail:
[email protected]). References Altmann, J. (1974). Observational study of behavior: Sampling methods. Behaviour, 49, 227-267. doi:10.1163/156853974X00534 Andrews, M. W., & Rosenblum, L. A. (1994). Automated recording of individual performance and hand preference during joystick-task acquisition in group living bonnet macaques (Macaca radiata). Journal of Comparative Psychology, 108, 358-362. doi:10.1037/0735 -7036.108.4.358 Deruelle, C., & Fagot, J. (1998). Visual search for global/local stimulus features in humans and baboons. Psychonomic Bulletin & Review, 5, 476-481. Dréa, C. M. (2006). Studying primate learning in group contexts: Tests of social foraging, response to novelty, and cooperative problem solving. Methods, 38, 162-177. doi:10.1016/j.ymeth.2005.12.001 Dréa, C. M., & Wallen, K. (1999). Low-status monkeys “play dumb” when learning in mixed social groups. Proceedings of the National Academy of Sciences, 96, 12965-12969. Evans, T. A., Beran, M. J., Chan, B., Klein, E. D., & Menzel, C. R. (2008). An efficient computerized testing method for the capuchin monkey (Cebus apella): Adaptation of the LRC–CTS to a socially housed nonhuman primate species. Behavior Research Methods, 40, 590-596. doi:10.3758/BRM.40.2.590 Fagot, J., & Barbet, I. (2006). Grouping and segmentation of visual objects in baboons (Papio Papio) and humans (Homo sapiens). In E. Wasserman & T. R. Zentall, (Eds.), Comparative cognition: Experimental explorations of animal intelligence (pp. 15-28). New York: Oxford University Press. Fagot, J., Bonté, E., & Parron, C. (2009). Concept of uprightness in baboons: Assessment with pictures of realistic scenes. Animal Cognition, 12, 369-379. doi:10.1007/s10071-008-0196-6
516 Fagot and Bonté Fagot, J., & Cook, R. (2006). Evidence for large long-term memory capacities in baboons and pigeons and its implications for learning and the evolution of cognition. Proceedings of the National Academy of Sciences, 103, 17564-17567. doi:10.1073/pnas.0605184103 Fagot, J., & Deruelle, C. (1997). Processing of global and local visual information and hemispheric specialization in humans (Homo sapiens) and baboons (Papio papio). Journal of Experimental Psychology: Human Perception & Performance, 23, 429-442. doi:10.1037/0096 -1523.23.2.429 Fagot, J., & Paleressompoulle, D. (2009). Automatic testing of cognitive performance in baboons maintained in social groups. Behavior Research Methods, 41, 396-404. doi:10.3758/BRM.41.2.396 Fagot, J., & Parron, C. (2010). Relational matching in baboons (Papio papio) with reduced grouping requirements. Journal of Experimental Psychology: Animal Behavior Processes, 36, 184-193. Gimmig, D., Huguet, P., Caverni, J.-P., & Cury, F. (2006). Choking under pressure and working memory capacity: When performance pressure reduces fluid intelligence. Psychonomic Bulletin & Review, 13, 1005-1010. Itani, J. (1958). On the acquisition and propagation of a new food habit in the natural group of the Japanese monkeys at Takasakiyama. Primates, 1, 84-98. doi:10.1007/BF01813697 Jürgens, U., & Hage, S. R. (2006). Telemetric recording of neuronal activity. Methods, 38, 195-2001. doi:10.1016/j.ymeth.2005.08.005
Navon, D. (1977). Forest before trees: The precedence of global features in visual perception. Cognitive Psychology, 9, 353-383. doi:10.1016/0010-0285(77)90012-3 Pallaud, B., & Lepoivre, H. (1985). Apprentissage d’inversion dans une situation de discrimination spatiale par un groupe de babouins: Interactions entre facteurs cognitifs et sociaux. Cahiers de Psychologie Cognitive, 5, 527-551. Parron, C., & Fagot, J. (in press). First- and second-order configural sensitivity for greeble stimuli in baboons. Learning & Behavior. Tomasello, M., & Call, J. (1997). Primate cognition. New York: Oxford University Press. Toxopeus, I. B. (2004). Testing cognitive performance of socially housed monkeys: Possibilities and limitations of the study of social influences on age-related cognitive decline. Unpublished doctoral dissertation, Utrecht University. Available at http://igiturarchive.library.uu.nl/ dissertations/2004-1118-121020/index.htm. Supplemental Materials Video files of the experimental apparatus may be downloaded from http://brm.psychonomic-journals.org/content/supplemental. (Manuscript received July 1, 2009; revision accepted for publication October 20, 2009.)