being included in the final summary. In these techniques, instead of employing natural language understanding ... Easter Island. 0. 500. 1000. 1500. 2000. 2500.
Automated Video Summarization Using Speech Transcripts Cuneyt M. Taskiran† , Arnon Amir‡ , Dulce Ponceleon‡ , and Edward J. Delp† †
Video and Image Processing Laboratory (VIPER) School of Electrical and Computer Engineering Purdue University West Lafayette, IN 47907-1285 {taskiran, ace}@ecn.purdue.edu ‡ IBM Almaden Research Center K57/B2, 650 Harry Road San Jose, CA 95120 {arnon,dulce}@almaden.ibm.com ABSTRACT
Compact representations of video data can enable efficient video browsing. Such representations provide the user with information about the content of the particular sequence being examined while preserving the essential message. We propose a method to automatically generate video summaries for long videos. Our video summarization approach involves mainly two tasks: first, segmenting the video into small, coherent segments and second, ranking the resulting segments. Our proposed algorithm scores segments based on word frequency analysis of speech transcripts. Then a summary is generated by selecting the segments with the highest score to duration ratios and these are concatenating them. We have designed and performed a user study to evaluate the quality of summaries generated. Comparisons are made using our proposed algorithm and a random segment selection scheme based on statistical analysis of the user study results. Finally we discuss various issues that arise in summary evaluation with user studies. Keywords: video summarization, speech analysis, video databases, content-based video analysis, video skimming, segmentation of speech transcripts, summary evaluation
1. INTRODUCTION Due to advances in video streaming and expansion of low-cost storage media, digital video has become an important factor in education, entertainment, and commerce. Consequently, there has been a great interest in designing and building systems that organize and search video data based on its content. In addition to search capabilities, such systems should be able to derive intuitive and compact data representations so that users may easily and quickly browse through the whole database or through the results of a query. Such representations rapidly provide the user with information about the contents of the particular sequence being examined while preserving the essential message. Developing efficient representations for video browsing presents some unique algorithmic challenges,1,2 as well as new technical challenges.3 Video is a sequential and information-rich medium. It includes audio and motion, and it carries long temporal contextual relationships between shots and scenes. In contrast to images in an image database, manipulation of video is inherently more complex. For example, images can be represented as thumbnails and users can easily judge relevance of these images at a glance. The same task is very time consuming for video sequences, where one hour is composed of more than 100,000 frames, divided into hundreds of shots. Additionally, the audio, which often conveys much of the information (e.g., a video of a talking head accompanied by slides), is even harder to browse in an efficient manner. There are numerous systems providing query by image content.4 Image similarity, however, is still limited to low-level features such as color histograms, color layout, texture, and shape. Content-based image applications are still a long way from providing semantic access expected by potential users. In image retrieval, however, the relevant matches of a query can be displayed on one page. Similar conclusions cannot be drawn for video data. Approaches to video similarity will vary depending on the combinations and emphasis of the different modes used for detection. Displaying concisely the results of video similarity to enable at-a-glance evaluation is still a challenging task. Several methods have been proposed for analyzing video and deriving compact representations for users to browse. One class of these methods is video summarization. The summarization process generally contains two main steps.
� �
�� �
Shot boundary detection
@ @ R @ �
Video � sequence � Audio pause to be detection @ A @ summarized A @ R A � A A Speech recognition AU using ViaVoice
User input Video segment combination
Detection of dominant word pairs
@ @ R @ �
? Generation of summary visualization
- Video skim
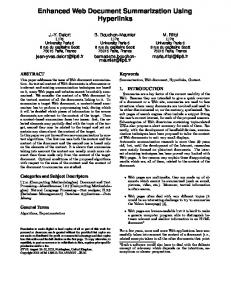
Figure 1. Block digram of our video skim generation system. In the first step, the source video is analyzed and divided into coherent video segments. This is often done by performing shot boundary detection on the video track. These segments are then assigned importance scores by using various combinations of visual, audio, textual, and other features extracted from the video stream. The work reported in1 is a good example of a multi-modal segments evaluation. In the second step of the summarization process the relevant segments are collected, the summary is generated, and the visualization of the representative information is created based on the summary. Visualization schemes can be divided into two classes: static (frame-based), or dynamic (video-based). In static visualization methods a number of representative key-frames are selected from the source video sequence and are presented to the user, sometimes accompanied by additional information such as time stamps and closed captions.5–11 We call the output of such methods video abstractions. In contrast to static visualization methods, dynamic methods generate a new video sequence from the source video, often a much shorter one.12,13,1,14,15 We denote dynamic visualizations as video skims. There are different types of video skims, depending on the domain and the purpose of the summary. For example, movie trailers are an example of video skims that are carefully handcrafted using large budgets. They aim at intriguing the viewer to watch the full video. Hence, they cover highlights from the movie, introduce the main actors and the different sceneries, but do not reveal the punchline, or the end of the movie. On the other end of the spectrum are executive summaries of long presentations that intend to replace watching the entire presentation. As such, they aim at capturing the most important parts of the talk, and especially the punchline, if it exists. Different considerations are taken into account for the summarization of home videos – capturing all the different locations, all the family shots, but not segments of unknown people. These three examples illustrate the wide range of different types of video summaries one would like to generate. Naturally there is no single approach, neither manual nor automatic, that will apply to all types of summaries. In this paper we propose an automated method to generate video skims for documentaries, educational videos, and presentations. We use video and audio analysis, automatic speech recognition, speech analysis, and shot boundaries of the video. A block digram for our system is shown in Figure 1. In Section 2 we review previous related work in video summarization. In Section 4 we provide an overview of the indexing component of the CueVideo system. The CueVideo system is used here to index the video and to extract the raw data necessary for the summarization. Our proposed summarization algorithm is described in detail in Sections 6 and 7. We describe the design of our user study in Section 8.2 and discuss results in Section 9.
2. RELATED WORK 2.1. Static Visualization of Video Summaries The simplest static visualization method is to present one frame from each video segment, which may or may not correspond to an actual shot, in a storyboard fashion. The problems with this method are that all shots appear equally important to the user and the representation becomes unpractically large for long videos. One way to alleviate this problem is to rank the video segments and to display only the representative key-frames belonging to the segments with highest scores. To reflect the relative importance of segments to the user, keyframes
were sized according to the score of the segment. This approach have been used in several systems.5,10,6 Yeung and Yeo5 use time-constrained clustering to cluster shots. Representative frames from segments are arranged in a “video poster” using a frame packing algorithm. The Video Manga system by Uchihashi et al.10 clusters individual video frames using YUV color histograms. The representative frames from the highest scored segments are arranged using a frame-packing algorithm. Ratakonda et al.16 extract keyframes from videos based on an action measure. They then cluster these keyframes into a hierarchical structure to generate a summary of the program. Iacob et al.17 perform a similar clustering technique to that used in Video Manga where video frames are first divided into rectangles, whose sizes depend on the local structure, and then clustered using YUV histograms derived from these rectangles. DeMenthon et al.9 represent video sequences as trajectories in a high dimensional feature space. They apply curve splitting algorithms to this trajectory to obtain keyframes which are shown to the user sequentially. Agnihotri et al.18 process the closed-caption text for cues to generate a program summary. Although static summaries are compact, by not preserving the time-evolving element of a video program, they present fundamental drawbacks. They are somewhat unnatural and hard to grasp for nonexperts, especially if the video is complex. More importantly, static summaries are not suitable for training, education and presentation videos. In these types of videos most shots contain mainly a talking head, and most of the relevant information is found in the audio and speech. These deficiencies are addressed by dynamic visualization methods.
2.2. Dynamic Visualization of Video Summaries In these methods the segments with the highest scores are selected from the source video and concatenated to generate a video skim. The MoCA project,13 one of the earliest systems for video summarization, uses color and action content of shots, among other heuristics, to obtain trailers for feature films. The Informedia project constitutes a pioneer and one of the largest efforts in creating a large video database with search and browse capabilities. It uses integrated speech recognition, image processing, and natural language processing techniques for the analysis of video data.19,1,20 Score are higher for those segments with significant camera motion, and those showing people or a text caption. Audio analysis includes detection of names in the speech transcript. Selected segments are merged while trying to maintain audio/video synchronicity. He et al.15 concentrate on summarization of seminar videos. They compare algorithms based on heuristics abour slide transitions, pitch information, and user access patterns. Stefanidis et al.11 propose a similar system to that of DeMenthon et al.9 ; however, they split the 3-dimensional trajectories of video objects instead of feature trajectories. The system proposed by Lienhart14 is designed to summarize home video using clustering based on time stamps. The segments to be included in the video skim are randomly chosen. Saarela and Merialdo21 propose a content model for audio video sequences based on descriptors which indicate various properties and relations of audio and video segments.
2.3. Other Approaches There are also some video browsing approaches which may be used to visualize video content compactly and hence may be considered video summarization techniques. Taskiran et al.8 cluster keyframes extracted from shots using color, edge, and texture features and present them in a hierarchical fashion using a similarity pyramid. In their BMoViES system Vasconcelos and Lippman7 derive four semantic attributes from each shot and present these in a time line for the user to examine. In the CueVideo system, Srinivasan et al.3 provide a video browser with multiple synchronized views. It allows switching between different views, such as storyboards, salient animations, slide shows with fast or slow audio, and full video while preserving the corresponding point within the video between all different views. Ponceleon and Dieberger22 propose a grid, which they call the movieDNA, whose cells indicate the presence or absence of a feature of interest in a particular video segment. When the user moves the mouse over a cell, a window shows a representative frame and other metadata about that particular cluster. A system to build a hierarchical representation of video content is discussed in Huang et al.23 where audio, video, and text content are fused to obtain an index table for broadcast news.
3. TEXT SUMMARIZATION TECHNIQUES As can be seen from Section 2, most methods for video summarization do not make use of one of the most important sources of information in a video sequence, the spoken text or the natural-language content. Informedia, CueVideo and the system proposed in23 are some exceptions. Content text is readily available for most cable TV programs in
the form of closed captions. For sequences like seminars and instructional programs where this information is not available speech recognition may be performed on audio to obtain the transcript. Once the text corresponding to a video sequence is available, one can use methods of text summarization to obtain a text summary. The portions of the video corresponding to the selected text may then be concatenated to generate the video skim. The techniques used in text summarization may be roughly divided into two groups: • Statistical analysis based on information-retrieval techniques. In this approach, the problem of summarization is reduced to the problem of ranking sentences or paragraphs in the given text according to their likelihood of being included in the final summary. In these techniques, instead of employing natural language understanding methods, various features are extracted from the text which were shown to be correlated with the “abstractworthiness” of a sentence, and the ranking is done using a combination of these features. • Natural Language Processing (NLP) analysis based on information-extraction techniques. This paradigm, making use of techniques from artificial intelligence, entails performing a detailed semantic analysis of the source text to build a source representation designed for a particular application. Then a summary representation is formed using this source representation and the output summary text is synthesized.24 Methods using statistical processing to extract sentences for the summary often generate summaries that lack coherence. These methods also suffer from the dangling anaphor problem. Anaphors are pronouns, demonstratives, and comparatives like “he”, “this”, and “more”, which can only be understood by referring to an antecedent clause appearing before the sentence in which the these words occur. If the antecedent clause has not been selected for the summary, anaphors may be confusing for the user. Although techniques based on NLP generate better summaries, the knowledge base required for such systems is generally large and complex. Furthermore such systems are specific to a narrow domain of application and are hard to generalize to other domains.
4. VIDEO AND SPEECH INDEXING We use the shot boundary detection and speech recognition and indexing of the CueVideo Toolkit V2.1. The CueVideo system consists of an automatic multimedia indexing system and a client-server video retrieval and browsing system. The indexing is performed on the digitized video. The video processing automatically detects shot boundaries, generates a shots table, and extracts representative frames as JPEG files from each of the shots. The audio processing starts with speech recognition, using the large vocabulary IBM ViaVoice speech recognition system,25 followed by text analysis and information retrieval tools. Several searchable speech indexes are created, including an inverted word index, a phonetic index and a phrase glossary index. The latter are derived from the decoded transcript using n-grams, tf×idf techniques, and domain specific knowledge, when available. Another part of the audio processing generates the time-scale modified audio in desired speedup rates for the fast and slow moving story boards.26 Here we use the decoded transcript and the phrases extracted from it.
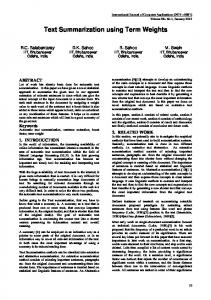
5. AUDIO AND SPEECH SEGMENTATION In user studies of summarization algorithms it has been found that users find it very annoying when audio segments in the summary begin in the middle of a phrase.15 Therefore, instead of using shot boundaries to segment video into segments, we have decided to use audio pause boundaries. In other words, the segments of video frames that the video is divided into are not determined using visual features, as was done in most of the previous studies, but are determined by detecting large interword pauses of the speaker in the audio. An advantage of this method is that it avoids having very long shots in the summary which commonly occur in videos of presentations and meetings where the camera is fixed on the speaker for a long time. The interword pause distributions of two video sequences, a wildlife documentary and a seminar, are shown in Figure 2. The pauses in the documentary are larger since this is an educational program with a well-defined script and the speaker speaks at a relaxed pace for all audience to easily follow. On the other hand, the pauses in the seminar video are generally quite short, corresponding to free-flowing natural speech, with “vocalized pauses” when the speaker is thinking about how to phrase a thought. These plots indicate that the interword pause durations show large variations from speaker to speaker and between video genres. Hence using a global threshold to detect segment boundaries does not work in practice.
Seminar 10
9
9
8
8
7
7
pause duration in seconds
pause duration in seconds
Easter Island 10
6
5
4
6
5
4
3
3
2
2
1
1
0
0
500
1000
1500 word number
2000
2500
3000
0
0
500
1000
1500 word number
2000
2500
3000
Figure 2. Pause durations between words for a documentary and a seminar video. There are many techniques available to detect pauses in speech. However, we detect pauses with a simple heuristic using the time stamped speech transcript file generated by ViaVoice at the completion of the speech recognition step of the CueVideo indexing process, as described in Section 4. This file contains the time stamp for each word recognized by the speech recognition program together with its length. We use a sliding window scheme to detect pauses between segments which is similar to the shot detection method proposed in.27 First, using the time stamps and word lengths from the speech transcript file, the durations of the pauses between all the words in the video are computed. Then, a symmetric window of size 2m + 1 is placed around the ith pause and a segment boundary is declared between words i and i + 1 whenever 1. the length of the ith pause is the maximum within the window, and 2. it is also n times the value of the second maximum in the window. The parameter n controls detection sensitivity, increasing it will decrease the detection rate but also decrease the false alarm rate. The value of m controls the granularity of the resulting segments by setting a lower limit on the number of words a segment can have. A small value of m causes the video to be divided into a large number of small segments which makes the resulting video skim seem “choppy” and hard to follow. On the other hand, using too large a value for m will cause segments to be too long. We have used the values n = 2 and m = 21 in our experiments.
6. COMPUTATION OF SEGMENT WEIGHTS 6.1. Segment Scoring Using Speech Recognition Text After the video is segmented using pause boundaries, as described in Section 5, we compute a score for each segment. These scores are determined using information about term frequencies within segments, as is usually done to rank documents for text retrieval. For each word w in segment i we compute a score which measures the statistical importance of w using the following formula formula derived in28 si,w =
(k + 1) ni,w N log Li nw k[(1 − b) + b AL ] + ni,w
where ni,w - number of occurrences of word w in segment i nw - total number of occurrences of word w in the video sequence Li - number of words in segment i AL - average number of words per segment in the video sequence N - total number of segments in the video sequence k, b - tuning parameters
(1)
The first term in the above expression for si,w reflects the effect of term frequency, ni,w . The constant k determines the sensitivity of the first term to changes in the value of ni,w . If k = 0 this term reduces to a function which is 1 if word w occurs in segment i and 0 otherwise; if k is large, the term becomes nearly linear in ni,w . Since not all segments have the same number of words, the segment score has to be normalized by the number of words in the segment. A simple normalization would be to divide ni,w by Li , which corresponds to the case of b = 1 in the above formula. This normalization is based on the assumption that if two segments are about the same topic but of different lengths, this is just because the longer is more wordy. Extensive experiments reported in28 suggest the values k = 2 and b = 0.75. We have used these values in our experiments. In19 the following version of the word score function was used s0i,w =
ni,w nc,w
(2)
where nc,w is the number of occurrences of word w in a standard corpus. The main drawback of this score function is that it is linear in ni,w . Therefore, if a term occurs a high number of times in a segment, the score of that segment would be unfairly high compared to others. This is contrary to experimental results28 which indicate that after 3 or 4 occurrences of a word in a segment the impact of additional occurrences is minimal. Furthermore, this score is not normalized to reflect the fact that segments will contain different number of words After the scores for individual words are computed using Equation 1, the score for segment i is computed as the average of the scores for the words it contains as Si =
1 Li
X
si,w
(3)
w∈ segment i
6.2. Detection of Dominant Word Pairs One problem with using the words from speech recognition is that, although the large vocabulary speech recognition engine is used in CueVideo can achieve high recognition accuracy, it can run into difficulty for videos containing rare words and phrases. The difficulty is that speech recognition programs are generally trained using a large, wellbalanced collection of content in which words and phrases like “ant”, “ostrich”, “handheld”, and “Moore’s Law” are relatively rare. However, such terms are commonly used in presentations and documentary programs. To alleviate this problem, in addition to the word scoring described in section 6.1, we perform a second order analysis of word frequencies in the video where the distribution of pairs of words are considered. The output of this analysis is a list of dominant word pairs for the video which are then used to increase the scores of segments containing them. We have used an adaptation of the method introduced in.29 Instead of detecting bigrams, as was the goal in that work, our goal is to detect if two words appear more often in the same segment than would be expected by chance alone. To perform this task, the following log-likelihood ratio value is computed for all possible word pairs (w1 , w2 ) included in the video. λ(w1 , w2 )
= a log a + b log b + c log c − (a + b) log(a + b) − (a + c) log(a + c) − (b + d) log(b + d) − (c + d) log(c + d) + (a + b + c + d) log(a + b + c + d)
(4)
where a = nw1 ,w2 is the number of segments where w1 and w2 both appear, b = nw1 ,¬w2 = nw1 − a is the number of segments where w1 appears but not w2 , c = n¬w1 ,w2 = nw2 − a is the number of segments where w2 appears but not w1 , and d = n¬w1 ,¬w2 = N − b − c + a is the number of segments where neither w1 nor w2 appear. In Table 1 we list the first 20 dominant word pairs, sorted according to the value of log-likelihood computed using Equation 4 for two documentary programs we have used in our experiments. Documentary 1 includes information
documentary 1 chinese–medicine horses–sea hong–kong know–year gets–pregnant looking–market camouflage–protection botero–nestor shallows–shore camouflage–difficult nestor–philippines difficult–protection botero–philippines females–males animal–kingdom people–work breeding–season arrested–think arrested–need setting–term
λ(w1 , w2 ) 27.19 24.98 22.69 21.31 20.46 19.77 19.77 19.77 19.77 19.77 19.77 19.70 19.77 17.63 16.60 15.95 15.95 15.95 15.95 15.95
documentary 2 hard–part rarely–scavenging calls–rarely calls–scavenging rarely–seen mean–special calls–seen scavenging–seen inhabitants–underground baby–bush brown–hyena call–hari adult–body season–warmer predators–train advantage–take bush–curiosity predators–smaller brown–hyenas baby–curiosity
λ(w1 , w2 ) 31.33 19.61 19.61 19.61 15.79 15.79 15.79 15.79 15.79 15.76 15.76 14.73 14.06 14.06 14.06 14.06 14.06 14.06 13.57 12.88
Table 1. First 20 word pairs sorted using the log-likelihood values computed with Equation 4 for two documentary programs we have used in our experiments. Documentary 1 is about the life of seahorses, Documentary 2 is about various nocturnal creatures living in the Kalahari desert. about the life and mating habits of sea horses, and how they are hunted by fishermen in the Philippines to be used in Chinese medicine. Documentary 2 is about various nocturnal creatures living in the Kalahari desert and includes information about animals like the bush baby and brown hyena. We observe that the word pairs give valuable information about the contents of the programs. Once the dominant word pairs are identified, the scores of the segments containing the first 30 of these pairs are increased by 20%. This is based on the assumption that the segments including these dominant word pairs are more important.
7. GENERATING THE VIDEO SKIM The duration of the summary is specified by the user in terms of the abstraction ratio which is defined as the ratio of the duration of the video skim to the duration of the source video. Once the scores for all the segments in the source video are determined the video skim is generated by selecting those segments that maximize the cumulative score for the resulting summary while not exceeding the given summary length. This may be viewed as an instance of the 0 − 1 knapsack problem which we can define mathematically as follows30 PN maximize (5) i=1 Si xi PN subject to (6) i=1 Ti xi ≤ T where Ti is the time duration of the ith segment, T is the desired duration of the video skim, as specified by the user, and xi is a binary variable, equaling 1 if the ith segment is selected for the video skim and 0 otherwise. In order to solve this problem we first sort the segments according to their efficiencies, ei , which are defined as ei = Si /Ti. Then we use a greedy selection algorithm which starts by selecting the segment with the highest efficiency and keeps on selecting the segment with the next largest efficiency as long as its duration is less than the remaining time in the video skim. When a segment with duration larger than the remaining time in the video skim is encountered the algorithm stops. Note that this greedy solution for the knapsack problem is suboptimal. 30 Since
the above algorithm tends to leave unused time in the summary, we have modified it so that once it encounters a segment whose duration is larger than the remaining time, the efficiency list is searched until a segment that fits the remaining time is found before terminating the algorithm. The selected segments are then concatenated.
8. EVALUATION OF VIDEO SUMMARIES Evaluation of the quality of automatically generated summaries, for either text or video, is a complicated task because it is difficult to derive objective quantitative measures for summary quality. The evaluation of summaries can be either intrinsic or extrinsic.31 In intrinsic evaluation the quality of the generated summaries is judged with respect to properties such as conciseness, coverage, and fluency by direct human judgment or they are compared to an “ideal” summary created by an expert. On the other hand, in extrinsic methods the results of the summarization are evaluated with respect to impact on the performance for a specific information retireval task. Although a very important component of the design process, evaluation of summaries are generally not included in studies on video summarization. A notable exception is the study performed by He et al.2 where users were presented with automatically generated video skims of seminars together with skims prepared by the authors of the seminars. The quality of the video skims were judged by the increase in scores obtained from quizzes the subjects took before and after watching the video skims. In order to be able to measure the effectiveness of a video summarization algorithm one first needs to define features that characterize a good summary given the specific application domain being studied. As discussed in Section 1, summaries for different applications will have different sets of desirable attributes. Hence the criteria to judge summary quality will be different for different application domains. In this paper our main goal is to generate summaries which retain as much information as possible contained in the original program. We chose documentary programs, educational videos, and presentations to be our target application domain. We assume the information contained in such programs to be evenly distributed across the video sequences.
8.1. Sequences Used in the Experiment We have chosen two documentary programs to use in our study which are both approximately 35 minutes long. The first sequence, denoted S, details the life and mating rituals of seahorses. The second sequence, denoted K, gives information about various nocturnal creatures living in the Kalahari region of Africa. We specifically chose this content in order to minimize the chance that the subjects participating in the study have prior knowledge about the contents presented in the programs. We have processed both sequences using the CueVideo system to obtain shot boundaries and speech transcripts. Two types of video skims were generated for each sequence. One skim is generated using the algorithm described in Section 6 which uses segment weights based on word frequencies and video segment score boosting using dominant word pairs. For comparison purposes we have also implemented another algorithm where the segments to be included in the video skim are chosen randomly. We shall denote our word frequency-based algorithm and the random segment selection algorithm by F and R, respectively. At the end of this step we had four different video skims, SF , SR, KF , and KR, where the first letter denotes the sequence and the second letter denotes the algorithm used to obtain the skim. A factor that can influence evaluation results is the value of the abstraction ratio used to obtain the video skims. The evaluation results of the same summarization system can be significantly different when it is used to generate summaries of different lengths.32 In our experiments we have kept the abstraction ratio constant at 10%, that is, the skims generated are of approximately one-tenth the duration of the original programs. This value was also used in other video summarization studies and represents a reasonable amount of compaction for practical applications.
8.2. Design of the Experiment We used a method similar to the one used by He et al.2 to measure the quality of generated summaries. The twelve people participating in the experiment were randomly divided into two groups of six. Each participant watched two video skims. The subjects in Group 1 watched the skims SF and KR while those in Group 2 watched SR and KF . Therefore, each subject watched skims generated from both sequences by different algorithms. We have chosen this cross design to minimize the carry over effects from the first summary viewing to the second one. After watching each video skim, the subjects were presented with 11 multiple choice questions about the content presented in the
Group 1 SF 9 8 5 9 9 6
KR 6 6 4 7 5 9
Subject Subject Subject Subject Subject Subject
X
7.67
6.17
σ ˆ2
3.07
2.97
Subject Subject Subject Subject Subject Subject
1 2 3 4 5 6
RC 5 5 5 4 3 5
Group 2 SR 6 6 7 9 7 6
KF 6 4 7 5 7 3
X
6.83
5.33
σ ˆ2
1.37
2.67
7 8 9 10 11 12
RC 4 3 4 5 5 3
Table 2. Scores of the participants from the quizzes about video content and the reading comprehension test (RC). The maximum score was 11 in the content quizzes and 5 in the reading comprehension test. skim. Each question offered four answer choices. While watching the summaries the users were not able to pause the video, jump to a specific point in the video, or take notes. No time limit was imposed for completing these quizzes. The questions that were presented to the participants were determined as follows: By watching the original programs we identified a number of informational facts that we thought were important about the content of the programs. We then checked that these facts were covered for a reasonable amount of time in the programs. The questions were distributed as uniformly as possible over the entire duration of the programs. One consequence of this procedure was that the answers to some questions were not included in the summaries. The subjects were told to guess the correct answer if they felt they had no clue about the question. A factor that is often overlooked in literature dealing with the assessment of summaries is the linguistic skill of the subjects. For example, the study reported in2 neither stated the linguistic proficiency of the subjects nor indicated which percentage were nonnative speakers. Clearly, to be able to complete a task as complex as understanding a summarized program and being able to answer questions based on its content, the subjects should possess a certain level of linguistic competency. In order to have a measure of the language proficiency of subjects we gave them a reading comprehension test which consisted of a short paragraph and five multiple choice questions based on the paragraph. Participants were given seven minutes to complete this test.
9. RESULTS AND ANALYSIS The scores that the subjects obtained from quizzes about video programs are shown in Table 2. Based on these scores we tested two different hypotheses. As our first test we compared separately the performance of each algorithm across the two programs to determine if program context affects algorithm performance. For convenience we have rearranged the relevant data from Table 2 in Table 3(a). Our null hypothesis is that program context does not affect the performance of the summarizing algorithms, i.e., for a given algorithm the population means for the score distributions for different programs are the same. We used the two-sample t test using independent samples as our test statistic. Two-tailed tests were used for all our tests. We find that for the random selection algorithm the difference is not statistically significant (tR = 0.7845, p < 0.40) while for our algorithm the difference is significant (tF = 2.3870, p < 0.05). The insensitivity of random selection algorithm to context was to be expected. The sensitivity of our algorithm to program content is for the most part caused by the properties of sequence K. Note that the scores are generally much lower for sequence K than they are for sequence S. This is mostly due to the dangling anaphor problem discussed in Section 3. In summaries for sequence K users sometimes saw an animal but since the segment where the name of the animal is given was not included in the summary they were not able to answer questions about it correctly. Most users complained about this effect after watching the skims generated by both algorithms for sequence K. This dangling anaphor effect was much weaker in sequence S where the whole program was about one animal. Since the random selection algorithm performs poorly for both sequences this difference is not very important. However, this creates a big difference for our algorithm which performs better for sequence S.
S1 S2 S3 S4 S5 S6
SR 6 6 7 9 7 6
S7 S8 S9 S10 S11 S12
KR 6 6 4 7 5 9
S1 S2 S3 S4 S5 S6
SF 9 8 5 9 9 6
S7 S8 S9 S10 S11 S12
tR = 0.7845 tF = 2.3870 (a) comparison of context
KF 6 4 7 5 7 3
S1 S2 S3 S4 S5 S6
SF 9 8 5 9 9 6
S7 S8 S9 S10 S11 S12
SR 6 6 7 9 7 6
S1 S2 S3 S4 S5 S6
KF 6 4 7 5 7 3
S7 S8 S9 S10 S11 S12
KR 6 6 4 7 5 9
tS = 0.9695 tK = −0.8600 (b) comparison of algorithms
Table 3. The data given in Table 2 rearranged to compare (a) the same summarization algorithm across different sequences, and (b) the two summarization algorithms on the same sequence. The values for two-sample t test using independent samples for the four different cases are also given. Our second test was to compare the performances of the subjects who watched different summaries generated by the two algorithms we used. The data is shown in Table 3(b) together with the corresponding t values. From the given t values we find that the difference between algorithms is not statistically significant for both sequence S (tS = 0.9695, p < 0.30), and for sequence K (tK = −0.8600, p < 0.40). Small sample size effects probably played a role in these results. We believe that with more subjects the difference between algorithms in sequence S would have been statistically significant. Although the differences are not statistically significant, our algorithm did slightly worse than the random algorithm for sequence K. For sequence S our algorithm did better than the random algorithm and the difference is larger than the difference for sequence K. Therefore, the data seems to suggest that our algorithm is better than randomized guessing for “smooth” program content where the given facts are concentrated around a few important points, like sequence S which contained information about one topic, namely seahorses, only. Our results also suggest that the linguistic proficiency of the subjects may make a difference in their performance for the summary evaluation task. Note that the subjects who got the lowest scores, Subjects 5, 8, and 12, also tended to do poorly on the content quizzes, especially for sequence K. This is caused by the fact that for this sequence, because of the informational overload and the dangling anaphor problem, linguistic comprehension capabilities become very important in scoring correct answers in the quizzes. We conclude that a reading or listening comprehension test should be given to the candidates before they participate in a summary evaluation experiment and the candidates with very low scores should either be screened out or should be placed in a seperate group. This procedure would also reduce the within-group variance of the quiz scores. The fact that the random segment selection algorithm performs as good as our algorithm may seem surprising at first. One reason why this result is obtained can be attributed to our summary evaluation strategy. When preparing the questions to test how much information the subjects gain by watching the skim, we distributed the questions as uniformly as possible over the total duration of the original program. However, this selection scheme biases the evaluation procedure towards the random selection algorithm. We would expect this effect to be stronger for sequence K, where in 35 minutes of the original program the narrator introduces and gives information about more than ten different animals. For such informationally loaded program content, of which presentations are another example, where information is presented in “chunks” about relatively independent topics, any summarization algorithm that uses segment weights to generate summaries will be penalized by our evaluation scheme. Our results suggest that the quiz method as presented here may not be a good method to judge quality of video skims. This conclusion is backed by the results of2 where the authors were not able to find any statistically significant difference between four automatic video summarization algorithms using an evaluation scheme similar to ours. Although the quiz method may not be a good summary evaluation technique, a better approach is not immediately obvious. One may propose to use questions based on higher level semantic information about program content than the ones we have used. However, it is not clear how these questions may be prepared in an objective manner, except, perhaps, by authors of presentations who are not usually available. Additionally, the evaluation of quiz answers in this higher level semantics case would be harder since, as the semantic level of questions increases, so does the ambiguity associated with them. In evaluating text summaries generally summaries created by experts are used. 32 A similar approach is much more costly and time consuming for video. Another scheme for evaluation may be to
present the segments from the original program to many people and let them select the segments they think should be included in the summary. This seems to be a promising approach although ggreement among human subjects becomes an issue for this scheme. Currently we are designing a larger user experiment to compare different summary algorithms and methods of summary evaluation.
10. CONCLUSIONS In this paper we propose an algorithm to automatically summarize educational video programs. We use concepts from text summarization, applied to transcripts derived using automatic speech recognition. We also use temporal analysis of pauses between words to detect sentence boundaries. We used the IBM CueVideo system to perform the media processing. We have shown that the dominant word pair selection algorithm works well in identifying main topics in video speech transcripts. We have also developed an experimental design for a user study to judge the quality of the generated summaries using quizzes based on questions about original program content that the subjects answered after watching summaries generated from the programs. We discussed various shortcomings of the quiz method of evaluating summaries. The problem of deriving good evaluation schemes for automatically generated video summaries is still a complex and open problem.
ACKNOWLEDGMENTS We would like to thank Prof. Zygmunt Pizlo of the Department of Psychological Sciences of Purdue University for fruitful discussions and advice with regard to the user study.
REFERENCES 1. M. G. Christel, M. A. Smith, R. Taylor, and D. B. Winker, “Evolving video skims into useful multimedia abstractions,” Proceedings of the ACM Computer-Human Interface Conference (CHI’98), April 18-23 1998, Los Angeles, CA, pp. 171–178. 2. L. He, E. Sanocki, A. Gupta, and J. Grudin, “Comparing presentation summaries: Slides vs. reading vs. listening,” Conference on Human Factors in Computing Systems (CHI 2000), April 1-6 2000, The Hague, Netherlands, pp. 177–184. 3. S. Srinivasan, D. Ponceleon, A. Amir, B. Blanchard, and D. Petkovic, “Engineering the web for multimedia,” Proceeding of the Web Engineering Workshop (WEBE), WWW-9, May 15-19 2000, Amsterdam, Netherlands. 4. A. W. M. Smeulders, M. Worring, S. Santini, A. Gupta, and R. Jain, “Content-based image retrieval at the end of the early years,” IEEE Transactions on Pattern Analysis and Machine Intelligence, vol. 22, no. 12, pp. 1349–1380, December 2000. 5. M. M. Yeung and B.-L. Yeo, “Video visualization for compact presentation and fast browsing of pictorial content,” IEEE Transactions on Circuits and Systems for Video Technology, vol. 7, no. 5, pp. 771–785, October 1997. 6. Y. Taniguchi, A. Akutsu, and Y. Tonomura, “Panorama excerpts: Extracting and packing panoramas for video browsing,” Proceedings of the ACM Multimedia, November 9-13 1997, Seattle, WA, pp. 427–436. 7. N. Vasconcelos and A. Lippman, “Bayesian modeling of video editing and structure: Semantic features for video summarization and browsing,” Proceedings of IEEE International Conference on Image Processing, October 4-7 1998, Chicago, IL. 8. C. Taskiran, J. Chen, C. A. Bouman, and E. J. Delp, “A compressed video database structured for active browsing and search,” Proceedings of the IEEE International Conference on Image Processing, October 4-7 1998, Chicago, IL. 9. D. DeMenthon, V. Kobla, and D. Doerman, “Video summarization by curve simplification,” Proceedings of the ACM Multimedia Conference, September 12-16 1998, Bristol, England, pp. 211–218. 10. S. Uchihashi, J. Foote, A. Girgenson, and J. Boreczky, “Video manga: Generating semantically meaningful video summaries,” Proceedings of ACM Multimedia’99, October 30 - November 5 1999, Orlando, FL, pp. 383–392. 11. A. Stefanidis, P. Partsinevelos, P. Agouris, and P. Doucette, “Summarizing video datasets in the spatiotemporal domain,” Proceedings of the International Workshop on Advanced Spatial Data Management (ASDM’2000), September 6-7 2000, Greenwich, England. 12. J. Oh and K. A. Hua, “An efficient technique for summarizing videos using visual contents,” Proceedings of the IEEE International Conference on Multimedia and Expo (ICME’2000), July 30-August 2 2000, New York, NY.
13. S. Pfeiffer, R. Lienhart, S. Fischer, and W. Effelsberg, “Abstracting digital movies automatically,” Journal of Visual Communication and Image Processing, vol. 7, no. 4, pp. 345–353, December 1996. 14. R. Lienhart, “Dynamic video summarization of home video,” Proceedings of SPIE Conference on Storage and Retrieval for Media Databases 2000, vol. 3972, January 2000, San Jose, CA, pp. 378–389. 15. L. He, E. Sanocki, A. Gupta, and J. Grudin, “Auto-summarization of audio-video presentations,” Proceedings of the 7th ACM International Multimedia Conference, 30 October - 5 November 1999, Orlando, FL, pp. 489–498. 16. K. Ratakonda, I. M. Sezan, and R. J. Crinon, “Hierarchical video summarization,” Proceedings of SPIE Conference Visual Communications and Image Processing, vol. 3653, January 1999, San Jose, CA, pp. 1531–1541. 17. S. M. Iacob, R. L. Lagendijk, and M. E. Iacob, “Video abstraction based on asymmetric similarity values,” Proceedings of SPIE Conference on Multimedia Storage and Archiving Systems IV, vol. 3846, September 1999, Boston, MA, pp. 181–191. 18. L. Agnihotri, K. V. Devera, T. McGee, and N. Dimitrova, “Summarization of video programs based on closed captions,” Proceedings of SPIE Conference on Storage and Retrieval for Media Databases 2001, vol. 4315, January 2001, San Jose, CA, pp. 599–607. 19. M. A. Smith and T. Kanade, “Video skimming and characterization through the combination of image and language understanding techniques,” Proceedings of the IEEE Conference on Computer Vision and Pattren Recognition, June 1997, San Juan, PR. 20. M. Christel, A. G. Hauptman, A. S. Warmack, and S. A. Crosby, “Adjustable filmstrips and skims as abstractions for a digital video library,” Proceedings of the IEEE Conference on Advances in Digital Libraries, May 19-21 1999, Baltimore, MD. 21. J. Saarela and B. Merialdo, “Using content models to build audio-video summaries,” Proceedings of SPIE Conference on Storage and Retrieval for Image and Video Databases VII, vol. 3656, January 1999, San Jose, CA, pp. 338–347. 22. D. Ponceleon and A. Dieberger, “Hierachical brushing in a collection of video data,” Proceedings of the 34th Hawaii International Conference on System Sciences (HICSS’34), January 3-6 2001, Maui, Hawaii. 23. Q. Huang, Z. Liu, A. Rosenberg, D. Gibbon, and B. Shahraray, “Automated generation of news content hierarchy by integrating audio, video, and text information,” Proceedings of IEEE International Conference on Acoustic, Speech and Signal Processing, March 15-19 1999, Phoenix, AR, pp. 3025–3028. 24. K. S. Jones, “What might be in a summary?,” Information Retrieval, pp. 9–26, September 1993. 25. L. R. Bahl, S. Balakrishnan-Aiyer, J. R. Bellegarda, M. Franz, P. S. Gopalakrisnan, D. Nahamoo, M. Novak, M. Padmanabhan, M. A. Picheny, and S. Roukos, “Performance of the IBM large vocabulary continuous speech recognition system on the ARPA Wall Street Journal task,” Proceedings of IEEE International Conference on Acoustic, Speech and Signal Processing, May 8-12 1995, Detroit, MI, pp. 41–44. 26. A. Amir, D. Ponceleon, B. Blanchard, S. Srinivasan, and G. Cohen, “Using audio time scale modification for video browsing,” Proceedings of the 33rd Hawaii International Conference on System Sciences (HICSS-2000), January 2000, Maui, Hawaii. 27. B.-L. Yeo and B. Liu, “Rapid scene analysis on compressed video,” IEEE Transactions on Circuits and Systems for Video Technology, vol. 5, no. 6, pp. 533–544, December 1995. 28. K. S. Jones, S. Walker, and S. E. Robertson, “A probabilistic model of information retrieval: Development and status,” Information Processing and Management, vol. 36, no. 6, pp. 779–840, 2000. 29. T. E. Dunning, “Accurate methods for the statistics of surprise and coincidence,” Computational Linguistics, vol. 19, no. 1, pp. 61–74, 1993. 30. S. Martello and P. Toth, Knapsack Problems: Algorithms and Computer Implementations. Chichester, NY: J. Wiley and Sons, 1990. 31. K. S. Jones and J. R. Galliers, Evaluating Natural Language Processing Systems: An Analysis and Review. New York, NY: Springer, 1996. 32. H. Jing, R. Barzilay, K. McKeown, and M. Elhadad, “Summarization evaluation methods: Experiments and analysis,” Proceedings of the AAAI Symposium on Intelligent Summarization, March 23 - 25 1998, Palo Alto, CA.