Automatic 3D Facet Orientations Estimation from LIDAR Imaging. Ye Duan, Xiaoling Li. University of Missouri at Columbia. Norbert Maerz, James Otoo. Missouri ...
NSF GRANT # 0856206 NSF PROGRAM NAME: GEOMECHANICS
Automatic 3D Facet Orientations Estimation from LIDAR Imaging Ye Duan, Xiaoling Li University of Missouri at Columbia Norbert Maerz, James Otoo Missouri University of Science and Technology Abstract: This paper presents our current research progress on automatic 3D facet orientations estimation from LIDAR imaging during the first year of the project period. During this project period, we have integrated robust Principal Component Analysis (PCA) based 3D surface normal estimation with the K-means clustering techniques to generate the main fracture surfaces orientations from LIDAR data. Our algorithm/software has been tested on the datasets obtained from several testing sites and the results are consistent with the manual measurements obtained by our collaborators.
between the discontinuity and the rock cut (most commonly observed in smooth planar rock cuts). Unfortunately LIDAR scanning cannot measure traces nor can optical imaging measure facets. This is complicated by the fact that both facets and traces are often present in the same rock cut, so selecting the measuring tool to fit the type of exposure is not possible. This paper presents our current research progress on automatic 3D facet orientations estimation from LIDAR Imaging, which is an essential first step into combining the optical and LIDAR imaging techniques.
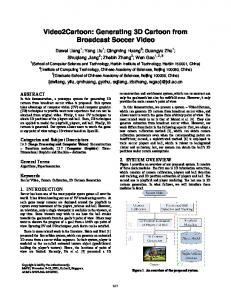
1. Introduction: In the United States, a constant danger to the motoring public is for large blocks of rock to fall or slide down into highways that traverse through rocky terrains (which often require that artificial vertical slopes be cut by blasting techniques to facilitate the highway construction), at worst killing and injuring members of the motoring public, and at best blocking the highway and impeding traffic flow. Many of these failures result because of release along planar cracks or discontinuities in rock mass. Whether or not failure occurs will depend on the orientation of the cracks, individually or in combinations (Figure 1). Obtaining measurements of fracture orientations is critical for analysis of discontinuous rock masses. The time honored method of manual measurements with Brunton compasses is both time consuming and often inconvenient given issues such as restricted access to measurement areas. Great strides have been made towards automated measurements using both optical imaging methods and LIDAR scanning methods. The difficulty is that discontinuities manifest themselves in rock cuts in two different ways; as facets that can be measured by LIDAR or fracture traces that could be measured, at least in 2-D, by optical imaging methods. Facets are defined as the actual discontinuity surfaces that are exposed in the rock cut (most commonly observed in rough irregular rock cuts); while fracture traces are the linear features that are the intersection
Figure 1: (left) Example of wedge, (middle) planar, and (right) toppling failures along road cuts. 2. Background: The cracks or discontinuities tend to cluster in terms of their orientations, into typically three or more sets, which tend to be mutually orthogonal, or roughly at 90 degree to each other (Figure 2). Knowing the orientations of the discontinuities can lead to stability prediction based on well established analytical tools as described by Hoek and Bray [1] such as the time honored stereonet projection method [2] where each data point, consisting of a normal vector to an individual discontinuity plane, is assigned to a discontinuity set by using cluster analysis.
Proceedings of 2011 NSF Engineering Research and Innovation Conference, Atlanta, Georgia
Grant #0856206
(a)
Figure 2: Orthogonal nature of joint sets. The orientations can be and have been traditionally measured using manual compass and clinometer methods. These methods are however slow, tedious and cumbersome, and in some cases dangerous because of potential falling rock, and are often limited to easily accessible locations like the base of the slope. The discontinuities or cracks in the rock mass, when exposed in an outcrop or cut manifest themselves in one of two ways, often in both ways on the same exposure: 1.
On flat planar rock cuts, the intersection of the plane of the discontinuity and the planar rock cut results in a visible line (fracture trace) that lies on both planes (Figure 3).
2.
On rock cuts that are irregular, the actual faces of the discontinuities are exposed. These fracture surfaces can be considered to be like “facets” on a cut precious stone (Figure 3).
In the last few years, the LiDAR (Light Detection and Ranging) 3-D technology is becoming increasingly useful in geology and engineering. LiDAR was used by Mikos et al to study rock slope stability [12]. Lim et al used photogrammetry and laser scanning to monitor processes active in hard rock coastal cliffs [13]. High resolution LiDAR data was used by Sagy et al to quantitatively study fault surface geometry [14]. Enge et al. illustrated the use of LiDAR to study petroleum reservoir analogues [15]. Using a combination of LiDAR and aerial photographs, Labourdette and Jones studied elements of fluid depositional sequences using LiDAR [16].
(b) Figure 3: (a) A rock cut. (b) The same rock cut showing both fracture traces (red line) and facets (cyan polygon). The assemblage of facets in a rock mass can be detected using LiDAR techniques. Missouri S&T has recent acquired a LIDAR unit (Figure 8). LiDAR data can be used to generate 3-D orientations on Stereonets [17, 18, 19, 20]. The point cloud produced by the laser scanner is searched for a region of co-planar points, and using any three non-linear points from this region one can determine the orientation solving the classic 3 point problem. Not all published methods give comparisons to manual measurements, and those that do show that the techniques could clearly be improved.
Proceedings of 2011 NSF Engineering Research and Innovation Conference, Atlanta, Georgia
Grant #0856206
3.
Automatic 3D Facet Orientations Estimation:
Given the 3D point clouds obtained from LIDAR scan, we will first compute the normal vectors at each point based on the principle component analysis algorithm (PCA). PCA is a robust statistical algorithm that can compute local surface properties based on local neighborhoods of sample points. The k-nearest neighbors of a sample point p, denoted by the index set Np, The local surface properties of the point clouds can be efficiently estimated by the eigenanalysis of the covariance matrix C of a local neighborhood at sample point p:
Calculate normal for each point
Define number of cluster K and random assign each point into some cluster
Calculate centroid normal for each cluster
Re-grouping based on minimum distance yes Any point moved group?
no
where p is the centroid of the neighbors of p. Consider the eigenvector problem
Output mean normal for each converged cluster
Figure 4: Calculate discontinuity facet algorithms.
Since C is symmetric and positive semi-definite, all its three eigenvalues 0 1 2 are real-valued and the eigenvectors vl form an orthogonal frame, corresponding to the principal components of the point set. Thus v0 approximates the surface normal at p, or in other words, v1 and v2 span the tangent plane at p. Note that n is the size of the neighborhood, which serves as the scale-control parameter, and is dependent on the laser scanner resolution, i.e. how dense the point clouds data will be. Next, we cluster the points with similar normal vectors into the same cluster based on the K-means algorithm [23]. Figure 4 illustrates the whole process of automatic 3D facet orientations estimation from LIDAR points.
5. Experimental Results: A site located in Southwest Missouri was selected as a study site. This site consists of an ignimbrite rock cut along Highway 72. For this site a single LIDAR scan was conducted using a Leica ScanStation II. An optical image was also obtained from the ScanStation II, as it has optical imaging built in. To test the system, manual measurements of discontinuity orientations were taken and a discontinuity map was created (Figure 5), containing orientation measurements on discontinuities of both linear traces and planar facets. Table 1 lists the manually measured orientations. Figure 6 shows the process of automatic facet orientation estimation from LIDAR data. Table 2 lists the main orientations estimated from the LIDAR data. Comparing Table 1 and 2, we can see the two results are quite consistent.
Figure 5: Discontinuity map.
Proceedings of 2011 NSF Engineering Research and Innovation Conference, Atlanta, Georgia
Grant #0856206
Table 1: Manual measured orientations of the main facets in Figure 5.
Table 2: Clustered joint set mean orientations from the point clouds.
Facet #
Theta Angle
Phi Angle
Cluster
Theta Angle
Phi Angle
(degree)
(degree)
(color)
(degree)
(degree)
91
186
88
189.80
87.58
90
277
89
Green (corresponding to facet #91 in Fig 5) Blue (corresponding to facet #90 in Fig 5)
288.17
87.90
(a)
6. Conclusions: This paper presents our current research progress on automatic 3D facet orientations estimation from LIDAR imaging. We have integrated robust Principal Component Analysis (PCA) based 3D surface normal estimation with the K-means clustering techniques to generate the main fracture surfaces orientations from LIDAR data. Our algorithm/software has been tested on the datasets obtained from several testing sites and the results are consistent with the manual measurements obtained by our collaborators. We are currently working on the next phase of the project which is to integrate the results from the 2D optical images with the 3D LIDAR datasets, which will allow us to measure the fracture orientations from both the fracture traces and the facets. 7. Acknowledgements: This project is supported in part by the NSF award #0856206 and NSF award #0856420. The PI is also supported in part by NGA NURI program.
(b)
(c) Figure 6: Discontinuity Facet Measurements from the LIDAR point clouds. (a) point clouds data obtained from the LIDAR; (b) the point clouds is divided into four main clusters (shown as green, blue, yellow and red color) based on the orientation; (c) the mean orientations of the four clusters.
8. References: 1. Hoek, E. V., and Bray, J., 1981. Rock Slope Engineering. Institution of Mining and Metallurgy, London, 358 pp. 2. Priest, S. D., 1985. Hemispherical Projection Methods in Rock Mechanics. George Alleu & Unwin, London, 124 pp. 3. Maerz, N. H., and Zhou, W., 1999. Multivariate analysis of bore hole discontinuity data. Rock Mechanics for Industry, Proceedings of the 37th US Rock Mechanics Symposium, Vail Colorado, June 6-9, 1999., v. 1, pp. 431-438. 4. Maerz, N. H., and Zhou, W., 2000. Discontinuity data analysis from oriented boreholes. Pacific Rocks; Proceedings of the Fourth North American Rock Mechanics Symposium, Seattle, Washington, July 31- Aug.1, 2000, pp. 667-674. 5. Zhou, W., and Maerz, N. H., 2001. Multivariate clustering analysis of discontinuity data: implementation and applications. Rock Mechanics in the National Interest; Proceedings of the 38th U.S. Rock Mechanics Symposium, Washington, D.C., July 7-10, 2001, pp 861-868.
Proceedings of 2011 NSF Engineering Research and Innovation Conference, Atlanta, Georgia
Grant #0856206
6.
7.
8.
9.
10.
11.
12.
13.
Zhou, W., and Maerz, N. H., 2002. Implementation of multivariate clustering methods for characterizing discontinuites from oriented boreholes. Computers & Geosciences, v. 28, no. 7, pp. 827-839. Maerz, H. H., and Zhou, W., 2005. Multivariate clustering analysis of the ECRB cross drift discontinuities, Yucca Mountain Project. Alaska Rocks, Proceedings of the 40th US Rock Mechanics Symposium, Anchorage Alaska, June 25-29, 2005, 10 pp. Maerz, N. H., 2000. Highway rock cut stability assessment in rock masses not conducive to stability calculations. Proceedings of the 51st Annual Highway Geology Symposium, Aug. 29Sept. 1, Seattle, Washington, pp. 249-259. Kemeny, J. and R. Post. 2003. Estimating ThreeDimensional Rock Discontinuity Orientation from Digital Images of Fracture Traces, Computers and Geosciences, 29/1, pp. 65-77, 2003. Post, R. M., Kemeny, J. M., and Murphy, R., 2001. Image Processing for automatic extraction of rock joint orientation data from digital images. Proceedings of the 38th U.S. Rock Mechanics Symposium, Washington, D.C., July 7-10, 2001, pp 877-884. Handy, J., Kemeny, J., Donovan, J., Thiam, S., 2004. Automatic discontinuity characterization ot rock faces using 3D laser scanners and digital imaging. Proc. Gulf Rocks 2004, June 5-10, Houston TX, 11 pp. Mikos, M., Vidmar, A., and Brilly, M., 2005. Using a laser measurement system for monitoring morphological changes on the Strug rock fall, Slovenia, Nat. Hazards Earth Syst. Sci., 5, 143– 153. Lim, M., Petley, D.N., Rosser, N.J., Allison, R.J., Long, A.J. and Pybus, D. 2005. Combined digital photogrametry and time-of-flight laser scanning for monitoring cliff evolution. Photogrammetry record, 20, 109-129.
14. Sagy, A., Brodsky, E.E. and Axen, G.J. 2007. Evolution of fault-surface roughness with slip. Geology, 35, 283-286. 15. Enge, H.D., buckley, S.J., Rotevatn, A. and Howell, J.A. 2007. From outcrop to reservoir simulation model: workflow and procedures. Geosphere, 3, 469-490. 16. Labourdette, R. and Jones, R.R. 2007. Characterization of fluvial architectural element using a three-dimensional outcrop data set: Escanilla braided system, South–Central Pyrenees, Spain. Geosphere, 3, 422-434. 17. Siefko, S., Hack, R., van Knapen, B., Turner, K, and Kemeny, J., 2005. Method for automated discontinuity analysis of rock slopes with threedimensional laser scanning. Transportation Research Record, No. 1913, pp. 187-194. 18. Kemeny, J., Norton, B., Turner, K., 2006. Rock slope stability analysis utilizing ground-based LIDAR and digital image processing. Felsbau v. 24, No. 3, pp 8-15. Split Engineering, 2008. SplitFX Software. 19. Kemeny, J., Turner, K., and Norton, B., 2006. LIDAR for Rock Mass Characterization: hardware, software, accuracy, and best practices. Laser and Photogrammetric Methods for Rock Face Characterization workshop, Golden Colorado, June 17-18, 2006, pp. 49-62. 20. Strouth, A, and Eberhard, E., 2006. The use of LIDAR to overcome rock slope hazard data collection challenges at Afternoon Creek, Washington. Methods for Rock Face Characterization workshop, Golden Colorado, June 17-18, 2006, pp. 49-62. 21. Split Engineering home Page. 2010. Split-FX. http://www.spliteng.com/downloads/SplitFXBroch ure2007.pdf 22. Hugues Hoppe, Tony DeRose, Tom Duchamp, John Alan McDonald, Werner Stuetzle: Surface reconstruction from unorganized points. SIGGRAPH 1992: 71-78.
Proceedings of 2011 NSF Engineering Research and Innovation Conference, Atlanta, Georgia
Grant #0856206