Automatic arteriovenous crossing phenomenon detection on retinal fundus images Yuji Hatanaka*a, Chisako Muramatsub, Takeshi Harab, Hiroshi Fujitab a Dept. of Electronic Systems Engineering, School of Engineering, The University of Shiga Prefecture, 2500 Hassaka-cho, Hikone-shi, Shiga Japan 522-8533; b Depr. of Intelligent Image Information, Div. of Regeneration and Advanced Medical Sciences, Graduate School of Medicine, Gifu University, 1194 Yanagido, Gifu-shi, Gifu Japan 501-1194 ABSTRACT Arteriolosclerosis is one cause of acquired blindness. Retinal fundus image examination is useful for early detection of arteriolosclerosis. In order to diagnose the presence of arteriolosclerosis, the physicians find the silver-wire arteries, the copper-wire arteries and arteriovenous crossing phenomenon on retinal fundus images. The focus of this study was to develop the automated detection method of the arteriovenous crossing phenomenon on the retinal images. The blood vessel regions were detected by using a double ring filter, and the crossing sections of artery and vein were detected by using a ring filter. The center of that ring was an interest point, and that point was determined as a crossing section when there were over four blood vessel segments on that ring. And two blood vessels gone through on the ring were classified into artery and vein by using the pixel values on red and blue component image. Finally, V2-to-V1 ratio was measured for recognition of abnormalities. V1 was the venous diameter far from the blood vessel crossing section, and V2 was the venous diameter near from the blood vessel crossing section. The crossing section with V2-to-V1 ratio over 0.8 was experimentally determined as abnormality. Twenty four images, including 27 abnormalities and 54 normal crossing sections, were used for preliminary evaluation of the proposed method. The proposed method was detected 73% of crossing sections when the 2.8 sections per image were mis-detected. And, 59% of abnormalities were detected by measurement of V1-to-V2 ratio when the 1.7 sections per image were mis-detected. Keywords: Arteriolosclerosis, Hypertensive retinopathy, Retinal Fundus image, Arteriovenous crossing phenomenon, Blood vessel width measurement, Computer-aided diagnosis
1. INTRODUCTION The retina is a region that can be direct observed by physicians. The physicians use such reading results for diagnosis of hypertension and diabetes. In Japan, the retina is examined selectively in the diagnosis performed by physicians as part of a specific health checkup scheme initiated in April 2008. Thus, the numbers of retinal examinations have been increased. Computer-aided diagnosis (CAD) systems, developed for analyzing retinal fundus images, can assist in reducing the workload of ophthalmologists and improving the screening accuracy. Recently, many studies on a CAD system for analyzing retinal fundus images have been reported1-24. Many groups have been investigating automated retinal blood vessels (BVs) detection methods, which include, but not limited to, the methods using fuzzy algorithm1, Hough transformation2, 12 kinds of different templates3, differential filters4-6, matched filters7-9, line detection operators10-12, Gabor wavelets13, 14, active contour methods15, 16, and clustering method17. We also reported two methods by using a double ring filter18, and black-top-hat transformation19. In Japan, ophthalmologists usually evaluate hypertensive retinopathy and arteriolosclerosis based on Scheie's classification; Grades I to IV denote the severity of these conditions. In most cases, ophthalmologists diagnose these diseases by observing the condition of BVs. Using Scheie classification, hypertensive retinopathy is divided into two main categories, hypertensive change and arteriolosclerosis. Hypertensive change was graded by diameter ratio of arteries and veins (A/V ratio), hemorrhages and exudates. However, this method does not permit quantitative determination. Thus, many researches have been conducted on automated/semi-automated measurement of A/V ratio20-23. We also developed an automated A/V ratio measurement method19, 24 . *
[email protected]; phone +81-749-28-9556; fax +81-749-28-9576; www.e.usp.ac.jp Medical Imaging 2011: Computer-Aided Diagnosis, edited by Ronald M. Summers, Bram van Ginneken, Proc. of SPIE Vol. 7963, 79633V · © 2011 SPIE · CCC code: 0277-786X/11/$18 · doi: 10.1117/12.877232
Proc. of SPIE Vol. 7963 79633V-1
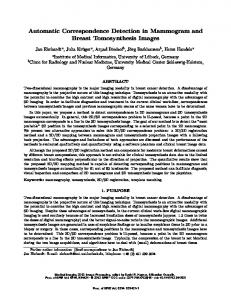
But, no report has been conducted on automated arteriolosclerosis detection. Arteriolosclerosis was graded by silver-wire artery, copper-wire artery and arteriovenous crossing phenomenon (AVCP). If the venous diameter V2 near the crossing section of the artery and the vein was narrow than the venous diameter V1 far from the crossing section, the section was determined as AVCP (as shown in Figure 1). But, to detect AVCP automatically was very difficult, and automatic AVCP detection was no reported. Thus, this study was designed to develop an automated method for detecting AVCP on retinal fundus images. Artery
Vein
V1
Normal V2 / V1 = 1
V2
V2
V2
Slight V2 / V1 > 0.5
V1
V1
V1
Medium V2 / V1 < 0.5
V2
Serious V2 / V1 = 0
Figure 1. Grades for diagnosis of arteriovenous crossing point.
2. METHODS 2.1 Image data set The data set consists of 24 retinal fundus images, which are used for developing our automated scheme. The images were obtained from patients who visited the ophthalmology at a Hospital, Japan and volunteers using retinal fundus camera (kowa nonmyd 7, Kowa Company, Ltd., Tokyo, Japan). The images were saved in JPEG format with a 3008 x 2000 pixel matrix and 24 bit color. They were captured with an optic angle of 45 degree and a majority of them included an optic nerve head and a fovea. All images were read by an ophthalmologist. He detected 81 BVs crossing sections in 24 cases, moreover he detected 27 AVCPs in 12 cases. 2.2 Detection of blood vessels First, BVs were extracted on the basis of the contrast in the green channel of the RGB images. The BV regions were then detected by using a square double ring filter18 as shown in Figure 2. The double ring filter is structured as a square, which width corresponds to that of the thickest vessel, with the outer square. The widths of outer and inside squares were set 39 and 3pixels. The pixel values of a filtered image correspond to the differences in average pixel values in the square and the rim regions. The example of BVs detected was shown in Figure 3. In this study, the optic disc regions were determined manually; however, it can be replaced by the automated method25 in the future. The major BVs used for the AVCP detection usually run from the optic disc to the upper and lower temporal regions. In order to select such BVs, a vessel-range mask was superimposed to the images for including vessels that were inside this mask. The vessel-range mask was created based on the BVs in the 24 cases by centering the optic discs as shown in Figure 4. 2.3 Detection of blood vessels crossing sections To detect the crossing sections of the artery and the vein, a ring filter as shown in Figure 5 was determined. If over 4 BV candidates were existed on the ring, the interest point was determined as the crossing section. The radius of this ring filter was set 40 pixels experimentally. Then, two positions crossing the BV and the filter ring were connected by using a straight line as shown in Figure 5 (b). The pair of their two positions was determined as the parts of same BV if over 50% of the straight line existed on the BV regions. In Figure 5 (c), the straight line from position 'A' had few 50 % of pixels on the BV regions, thus such position was not determined as a part of BVs crossing section. On the other hand, the straight line from position ‘B’ and ‘D’ existed over 50% pixels on the BV regions, thus such pair of positions was
Proc. of SPIE Vol. 7963 79633V-2
determined as a part of BVs crossing sections. The pair of position ‘C’ and ‘E’ was alike determined as a part of BVs crossing sections. 2.4 Reduction of false crossing sections This ring filter mis-detected many false positives. In Figure 6(b), the contrasts were low on the positions which were crossing the BV and the filter-ring, thus such cases were determined as false crossing sections. The contrasts were calculated using the pixel values on green and blue components of color image. Moreover, proposed method misdetected the case like Figure 6(c). The pixel values on positions ‘C’ and ‘D’ were darker than them on positions ‘A’ and ‘B’ in this case, thus this candidate was determined as BV without crossing section by comparison of pixel values of ‘A’ and ‘C’ or ‘B’ and ‘D’. 2.5 Recognition of artery and vein The artery and the vein were classified by using pixel values on the ring (as shown in Figure 7). The four pixel values of 4 BV points on the ring were ranked on the red and green components. The ranking values were summed, and that sum and that opposite sum of the ring were summed. The vein was darker than the artery in the color image, thus the BV with smaller sum was classified as the vein. 2.6 Measurement of V2 / V1 ratio V1 and V2 were then determined for detection of the AVCP. The vein on the ring was determined as the position P1, and the position with the half radius from the center of the ring on the vein was determined as the position P2 (as shown in Figure 8). V1 was the average venous diameter between P1 and P2, and V2 was the minimum venous diameter between P2 and the interest point. The BV width was determined using a method proposed by Nakagawa et al.19. The BV width on the interest pixel was determined by the minimum length of the straight line with the interest pixel between the BV wall to the opposite wall (as shown in Figure 9). Finally, the interesting point was experimentally determined as AVCP when the V2-to-V1 (V2 / V1) ratio was under 0.8. B
B
B
B
B
B
B
B
B
B
B
B
B
B
B
B
B
B
B
B
B
B
B
B
B
B
B
B
B
B
A
A
A
B
B
B
B
B
B
A x,y A
B
B
B
B
B
B
A
A
A
B
B
B
B
B
B
B
B
B
B
B
B
B
B
B
B
B
B
B
B
B
B
B
B
B
B
B
B
B
B
Figure 2. Structure of a double ring filter for detection of BVs.
(a)
(b)
Figure 3. Detection of BVs. (a) Original retinal fundus image. (b) Result of the BVs detected by using a double ring filter.
Proc. of SPIE Vol. 7963 79633V-3
(a)
(b)
Figure 4. Determination of searching areas for detection of crossing sections. (a) The range of the arteriovenous crossing phenomenon locations determined by superimposing the optic disc centers of the 24 cases. (b) The searching area was determined by superimposing the range.
A B
E
C D
(a)
(b)
(c)
(d)
Figure 5. Using a ring filter, the crossing-sections was detected. (a) Result of BVs detection. (b) BVs on the ring were searched. Green line shows a ring filter, and red points show the positions crossing the BV and a ring. (c) False BVs were removed. The BVs without the opposite BV candidates of the ring were removed. Top and left BV was removed in this case. (d) This crossing section was detected by recognition of the pair by two BVs.
A
C
A
A
C
C D B
(a)
D
B (b)
D
B (c)
Figure 6. False BVs crossing section were removed by using a contrast and difference of pixel values on two positions. (a) True crossing section. (b) This case was determined as false BVs crossing section because the contrasts of position A, B, C, D were low. (c) This case was determined as false BVs crossing section. The difference pixel value of diagonal positions was high, thus position A and B were recognized as backgrounds.
Proc. of SPIE Vol. 7963 79633V-4
Rank 4 R:175
Rank 3 G: 67 Rank 2 R: 160
Artery; point:14 Rank 2 G: 58
Rank 1 R: 154
Rank 1 G: 54 Rank 3 R: 171
Vein; point:6 Rank 4 G: 68
(a)
(b)
(c)
Figure 7. Classification of artery and vein. (a) The pixel values of the red component of color image on the ring filter were shown. And ranks of red values on 4 positions were shown. (b) The pixel values of the green component of color image on the ring filter were shown. And ranks of green values on 4 positions were shown. (c) The distinction points were determined by the sum of the ranks on red and green components.
Interest point r/2 P2
r/2
V2 V1
P1
(a)
(b)
Figure 8. Determination of venous width V1 and V2. (a) The vein on the ring was determined as the position P1. The venous position on the ring with half radius of the ring filter was determined as the position P2. “r” is a radius of the ring. (b) V1 was the average venous width between P1 and P2. V2 was the minimum venous width between P2 and the interest point.
Figure 9. Measurement of BV width. White boxes show background. Gray boxes show BV regions. Dashed lines show BV’s width candidates. Bold line shows the minimum length in dashed lines. BV width was determined by the minimum length of dashed lines.
Proc. of SPIE Vol. 7963 79633V-5
3. RESULTS AND DISCUSSION Twenty four retinal fundus images, including 27 AVCP and 54 normal crossing sections, were used to preliminary evaluate the proposed method for detection of AVCP. The proposed method based on ring filter was detected 75% (61/81) of BV crossing sections when the 6.3 sections per image were mis-detected. The number of false section candidates was too many, thus we added false section reduction method. As a result, the proposed method was detected 73% (59 / 81) of BV crossing sections including when the 2.8 (66/24) sections per image were mis-detected. And, the proposed method by measurement of V2 / V1 ratio was 59% (16/27) of AVCPs when the 1.7 (41/24) sections per image were mis-detected. In Figure 10 (b), the capillary vessel crossing the vein was mis-detected as BV. Thus, such pattern was mis-detected as a crossing section. Moreover, V2 / V1 ratio measured was under 0.8, thus this case was mis-recognized as AVCP. Moreover, we compared V2 / V1 ratio measured by an ophthalmologist and proposed method by using the case as shown in Figure 11. V2 / V1 ratio by an ophthalmologist was 0.73, but that by proposed method was 1.05. In this case, the BV walls near the crossing section were faded, thus proposed method segmented the vein thicker than real vein. However, the proposed method detected 16 AVCPs as shown in Figure 12. Although the vein near crossing section was broken, the proposed method could detect this case by ring filter. Capillary vessel
V2 V1
(a)
(b)
Figure 10. Examples of cases were mis-recognized by proposed method. (a) This case was not detected by proposed method, because the contrast of the artery was very low. (b) This case was mis-detected as AVCP, because the capillary vessel was existed and V2/V1 ratio was under 0.8.
V2 V1
V1
V2
(a)
(b)
Figure 11. Comparison of V2/V1 ratios by ophthalmologist and proposed method. (a) This case was AVCP diagnosed by ophthalmologist. V2/V1 ratio was measured 0.73. (b) The Proposed method segmented BVs and measured V2/V1 ratio. This ratio was 1.05.
Proc. of SPIE Vol. 7963 79633V-6
(a)
(b)
Figure 12. The example case was detected by proposed method. (a) Original AVCP. (b) BVs were segmented, and BVs crossing section was detected by using ring filter.
4. CONCLUSION We proposed the automated AVCPs detection method based on ring filter. The proposed method detected 59% of AVCPs when the number of false candidates was 1.7 (41/24). Although the proposed method could not detected the AVCPs including BVs with low contrasts, that method detected many typical AVCPs.
ACKNOWLEDGEMENT This study is founded by the Grant-in-Aid for Young Scientists (B) from the Ministry of Education, Culture, Sports, Science and Technology (MEXT), a grant for the Knowledge Cluster Gifu-Ogaki (KCGO), referred to as the “Robotics Advanced Medical Cluster,” from the MEXT, Japan, and a grant from Tateishi Science and Technology Foundation, in Japan. The authors are grateful to A. Mizutani, A. Aoyama, R. Takahashi and the co-workers from the hospitals, the companies, and Gifu University.
REFERENCES [1] Tolias, Y.A., and Panas, S.M., “A fuzzy vessel tracking algorithm for retinal images Based on Fuzzy Clustering,” IEEE Trans. Med. Imaging 17(2), 263-273 (1998). [2] Zana, F., and Klein, J.C., “A multimodal Registration Algorithm of Eye Fundus Images Using Vessels Detection and Hough Transform,” IEEE Trans. Med. Imaging 18(5), 419-428 (1999). [3] Chaudhuri, S., Chatterjee, S., Katz, N., Nelson, M., and Goldbaum, M., “Detection of Blood Vessels in Retinal Images Using Two-dimentional Matched Filters,” IEEE Trans. Med. Imaging 8(3), 263-269 (1989). [4] Staal, J. J., Abramoff, M. D., Niemeijer, M., Viergever, M. A., and van Ginneken, B., “Ridge based vessel segmentation in color images of the retina,” IEEE Trans. Med. Imaging 23(4), 501-509 (2004). [5] Cai, W., and Chung, A. C., “Multi-resolution vessel segmentation using normalized cuts in retinal images,” Med. Image Comput. Assist. Interv. 9(2), 928-936 (2006). [6] Mendonca, A. M., and Campilho, A., “Segmentation of retinal blood vessels by combining the detection of centerlines and morphological reconstruction,” IEEE Trans. Med. Imaging 25(9), 1200-1213 (2006). [7] Sofka, M., and Stewart, C. V., “Retinal vessel centerline extraction using multiscale matched filters, confidence and edge measures,” IEEE Trans. Med. Imaging 25(12), 1531-1546 (2006).
Proc. of SPIE Vol. 7963 79633V-7
[8] Al-Rawi, M., Qutaishat, M., and Arrar, M., “An improved matched filter for blood vessel detection of digital retinal images,” Comput. Biol. Med. 37(2), 262-267 (2007). [9] Youssif, A. R., Ghalwash, A. Z., and Ghoneim, A. R., “Optic disc detection from normalized digital fundus images by means of a vessels’ detection matched filter,” IEEE Trans. Med. Imaging 27(1), 11-18 (2008). [10] Zana, F., and Klein, J. C., “A multimodal registration algorithm of eye fundus images using vessels detection and hough transform,” IEEE Trans. Med. Imaging 18(5), 419-428 (1999). [11] Ricci, E., and Perfetti, R., “Retinal blood vessel segmentation using line operators and support vector classification,” IEEE Trans. Med. Imaging 26(10), 1357-1365 (2007). [12] Vlachos, M., and Dermatas, E., “Multi-scale retinal vessel segmentation using line tracking,” Comput. Med. Imaging Graph. 34(3), 213-227 (2009). [13] Soares, J. V. B., Leandro, J. J. G., Cesar Jr., R. M., Jelinek, H. F., and Cree, M. J., “Retinal vessel segmentation using the 2-D Gabor wavelet and supervised classification,” IEEE Trans. Med. Imaging 25(9), 1214-1222 (2006). [14] Oloumi, F., Rangayyan, R. M., Eshghzadeh-Zanjani, P., and Ayres, F. J., “Detection of blood vessels in fundus images of the retina using Gabor wavelets,” Proc. IEEE Eng. Med. Biol. 29(1), 6451-6454 (2007). [15] Yu, G., Li, P., Miao, Y. L., and Bian, Z. Z., “Multiscale active contour model for vessel segmentation,” J. Med. Eng. Technol. 32(1), 1-9 (2008). [16] Al-Diri, B., Hunter, A., and Steel, D., “An active contour model for segmenting and measuring retinal vessels,” IEEE Trans. Med. Imaging 28(9), 1488-1497 (2009). [17] Salem, S. A., Salem, N. M., and Nandi, A. K., “Segmentatino of retinal blood vessels using a novel clustering algorithm (RACAL) with a partial supervision strategy,” Med. Biol. Eng. Comput. 45(3), 261-273 (2007). [18] Hatanaka, Y., Nakagawa, T., Hatashi, Y., Aoyama, A., Zhou, X., Hara, T., and Fujita, H., “Automated detection algorithm for arteriolar narrowing on fundus images,” Conf. Proc. IEEE Eng. Med. Biol. Soc. 291, 286-289 (2005). [19] Nakagawa, T., Hayashi, Y., Hatanaka, Y., Aoyama, A., Mizukusa, Y., Fujita, A., Kakogawa, M., Hara, T., Fujita, H. and Yamamoto, T., “Recognition of optic nerve head using blood-vessel-erased image and its application to production of simulated stereogram in computer-aided diagnosis system for retinal images,” IEICE Trans. Info. Sys. J89-D(11), 2491–2501 (2006). [20] Pakter, H. M., Ferlin, E., Fuchs, S. C., Maestri, M. K., Moraes, R. S., Nunes, G., Moreira, L. B., Gus, M., and Fuchs, F. D., “Measuring arteriolar-to-venous ratio in retinal photography of patients with hypertension: development and application of a new semi-automated method,” Am. J. Hypertens. 18(3), 417-421 (2005). [21] Tramontan, and L., Ruggeri, A., “Computer estimation of the AVR parameter in diabetic retinopathy,” IFMBE Proc. 25, 141-144 (2009). [22] Nam, H. S., Hwang, J. M., Chung, H., and Seo, J. M., “Automated measurement of retinal vessel diameters on digital fundus photographs,” IFMBE Proc. 25, 277-280 (2009). [23] Niemeijer, M., van Ginneken, B., and Abramoff, M. D., “Automatic classification of retinal vessels into arteries and veins,” Proc. SPIE 7260, 72601F-1-8 (2009). [24] Muramatsu C., Hatanaka Y. Iwase T., Hara T., and Fujita H., “Automated detection and classification of major retinal vessels for determination of diameter ratio of arteries and veins,” Proc. SPIE 7624, 76240J-1-8 (2010). [25] Muramatsu, C., Nakagawa, T., Sawada, A., Hatanaka, Y., Hara, T., Yamamoto, T., and Fujita, H., “Automated segmentation of optic disc region on retinal fundus photographs: Comparison of contour modeling and pixel classification methods,” Comput. Methods Prog. Biomed., 101, 23-32 (2011).
Proc. of SPIE Vol. 7963 79633V-8