tures of fingerprint images stored in the fingerprint database. The result of matching is ... also ~r0DOSed context free orammars and used 10 classes of fing&rhts.
MVA'SO
IAPR Workshop on Machine Vision Applications Nov. 28-30,1990, Tokyo
AUTOMATIC CLASSFICATION OF FINGERPRINT IMAGES Babu M. Mehtre CMC Ltd, 115, Sarojini Devi Road, SECUNDERABAD - 500 003 (INDIA) Anil K. Jaln Computer Science Dept, Michigan State University, East Lansing MI 48824 ( USA)
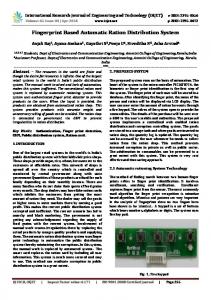
Abstract Classification of fingerprints into disjoint categories can result in more accurate and faster matching. Fingerprint experts classify fingerprints into the following broad categories: whorls, leff loops, right loops, arches and composites. Traditionally, syntactic approaches have been employed for fingerprint classification. But the resuslts of classificationusing this approach have not been encouraging due to factors such as large variations within patterns of the same class and the sensitivityof syntactic methods to noise. In this paper, we pose i~ngerpnntclass~hcat~on as a stat~stcalpattern class~f~cahon problem We employ features from the d~rectionaltransform of the fingerprint image msteadof the frngerpnnt Image rtself. We construct the h~stoqramof e~qht d~rectronsandcompute the texture features from the co-occurence matrix of the direction image. We seiect the best feature subsets using the Whitney method and exhaustive search. The resulting recognition accuracy is promising, but additional experiments on a larger dataset are needed to establish the robustnessof theproposed classification scheme. Introduction Fingerprint ldentification entails establishing that the given two prints (or impressions)have been made by the same finger. State-of-the-art commercial systems are available for automatic fingerprint identification. These systems use the "minutiae" features for identification.The block schematic of an Automatic Fingerprint ldentification System (AFIS) is given in Figure 1. It consists of several modules: image acquisition. preprocessing, feature extraction matching and fingerprint database. The input unit consists of a video scanner and digitizer which takes a fingerprint impression as the input and qenerates adigital image. Figure 2 showsone such image. The dark lines in the image are referred to as the ridge lines. The preprocessingunit improvesthe quality of input image.Thefeature extraction unit extracts the minutiae features, the ridge endings and ridge bifurcation points. A set of these points constitute the characteristic features of a fingerprint image. These features are used by matching unit to match similar fea-
FINGER PRINT
INPUT
Fingerprint Classification In general, fingerprint databases are of large size, typically several million prints. A fingerprint has about 100 minutiae features. ldentification of a fingerprint can potentially require matching against all the prints in the database. This involves a substantial amount of computation and can take a long time even with a fast computer. The classification of fingerprints helps to reduce drastically the number of database prints that need to be matched for identification. A maximum of only 35% of fingerprint database is searched, if the fingerprint class is known and if it is of a whorl pattern[6]. Another important advantage of fingerprint classification is that it increases the accuracy of recognition by avoiding matching with dissimilar fingerprints (from different classes) which could be potentially false matches. There are different schemes of classification of fingerprint patterns. We consider the following set of classes: whorls, left loops, right loops, twin loops, arches, and composites. The whorl patterns are by far the most common patterns. They are estimated to occur about 35OA of the time. The percentage occurences of other patterns [6] are: left loops 25'10, right loops 25%, twin loops 5%, arches 5% and composites 5%. There are two levels of features in fingerprint patterns: low level or local features, and high level or global features. The minutiae (ridge endings and bifurcations)form the low level features. The high level features are the core and the delta(s). Figure 2 shows the ridges, a few minutiae, core and delta in a whorl image. The details of different te~rnsrelated to fingerprints may be found in 12-51, The following defintions will suffice our purpose.The core (point) is the logical centre of a fingeprint pattern. The delta is a region where ridges are flowing out in three different directions. The number of core and delta points varies according to the type of pattern. For example, a whorl pattern has one core and
-
- d
tures of fingerprint images stored in the fingerprint database. The result of matching is, generally, a short list of possible candidates. The decision about the correctness of a match is made by trained human experts . So, AFIS helps fingerprint experts to carry out a fast search of the database.
PREPROCESSING
FEATURE * EXTRACTION
-
MATCHER
-)
RESULT
b FINGERPRINT DATABASE
Figure 1: The Block Schematic of a n Automatic Fingerprint Identification System
two deltas, and the left and the ridht loops each have one core and one delta. This information about core and delta can be used for classification. Grasselli[5] was the first to advocatefingerprint classification using the syntactic approach. Moayer and Fu [2] proposed a multi-levelclassificationforfingerprints. Their emphasis was on classifying fingerprints into a large number of classes. They used context free languages at the first level and stochastic context free grammars for subclassification. Rao and Balk [3] also ~r0DOSedcontext free orammars and used 10 classes of fing&rhts. The results of syntactic approaches have had only a limited success, and are not useful for practical applications. The limited success of the syntactic approaches is due to many reasons includino the laroe variation within finqerprint patterns of the same class, noisy h a g e s , and the sensitivity of syntactic methods to noise. Kawagoe and Tojo [4] proposed a two level classification of fingerprints. The first level classification was based on the number of core and delta points, and the second level used the ridge flow tracing for fine classification. They claimed an accuracy of about 92% for a sample size of 94 fingerprints ( 92 patterns from 3 classes: whorls, left loops, right loops, 1 each from arch and composite). Classlflcation Scheme Afingerprint classification scheme based strictly on the core and delta information is fraught with difficulties, as the core and/or delta may be missing (or may be noisy, even if present), and as result may lead to misclassification.Also, it is not possible to distinguish some of the patterns based solely on the number of core and delta features (for e.g., left loop and and right loop each have a core and a delta). So, what is more imDortant is the overall nature of the flow of ridae lines, which should be taken into account for the classificatkn. In our classification al~orithm,we have used this information.To illustrate this nature of ridge line flow, consider the following example. In the caseof whorls (see Figure 2), the generalflow of ridge lines is approximately circular (it could be spiral or elliptical). In the right loop pattern, the ridges will flow from right to left and turn back to the right from the middle ot the image (see Figure 3). The converse is true for the left loop. In the case of arches (Figure 4), the ridge flow is from left to right, with an upward bump in the middle, and so on. We generate a direction image from a given fingerprint image. In this image, each pixel value indicates the direction at each pixel, and hence is referred to as pixel-wise direction image. A block direction image is generated using the pixelwise direction image. This image has reduced noise and retains all the required information for classification. We use the histogram frequencies along with the diagonal elements of co-occurence matrix features computed from the block direction image to classify the fingerprint patterns. These features are used in classificationwith the k-nearest neighbor decision rule. We classify a fingerprint into one of the following classes: whorl, left loop, right loop, twin loop, arch and unknown (or reject). The unknown category has been included to take care of patterns which can not be assigned to any of the first five classes. It may be noted that the first three classes (whorl, left loop and right loop) constitute about 8S0' of the fingerprint patterns. D:rectlon Image Computation
The direction image is a transformed version of the original fingerprint image. It represents the local orientations of the ridges. The direction D(i,j) at point (i,j) in an image is computed [a] as follows. First, we compute Sd, the sum of differences in gray values in a local region along the direction d.
In the above expression, f(i,j) and e(ik,jk) are the gray values at pixels (i,j) and (ik,jk) respectively, where (ik.jk) is the kth pixel in direction d from (i,j), n is the number of pixels chosen forthis computation, N is the number of directions used. The direction D(i,j) at a point (i,j) is the direction d for which Sd is minimum. We have used N=16, and n=8. We do not distinguish between the head and tail of ridge directions. The total variation of the gray values described by the summation of equation (1) above is expected to be the smallest in the direction of ridges, and to be the largest along the orthogonal to the ridge direction. Thus, the direction D(i,j) at a point (i.j) indicates the direction of maximum gray level uniformity in the image. The direction image can be thought of as an image transform, since it reflects the directionof local gray level uniformity and can also be used for data compression. However, this transform is not invertible: given the direction image, it may not be possible to obtain the original image. The direction image D(i,j) represents the direction at a pixel. Generally, this is a very noisy image and needs smoothing. We compute a relatively noise free block direction image, from the D(i,j) image by choosing the prominent ridge direction in a local region (block) as the direction of the block. This image is used as the input for fingerprint classification. Figure 5 shows a 32x32 block- wise direction image for a whorl pattern. It was extarcted from a 512x512 fingerprint image using a block size of 16x16. figure^ 6 show the block direction images for left loop Feature Selection-The selection of features is an important step in classifier design. The classification of patterns performed by humans is based on a few salient features. By analogy, we have attempted to design an automatic fingerprintclassification system, on the basis of only a few significant features characterizingthe class memebership of the patterns. A large number of features does not ensure higher rate of recognition accuracy. In practiceoften the perfo'rmance of the classifier based on estimated densities improves up to a point, then starts deterioratingas further features are added, thus, indicating the existence of an optimal meausrement complexitywhen the number of training sample is finite [ l l ] . This behaviour has been termed the "Curse of dimensiona1ty"in the literature [I]. We have used the histogram and textural features 1101cornputed from the block direction image. The diagonal elements of the co-occurence matrix have been used as the textural features. The co-occurencematrix C = [C(i,j)] is computed as follows: ~ ( i , j ) = & k , l ) # ( ~ b ( k , ~ ) = i , ~ b ( k,I+l)=j)+ -1 &,l)#(~b(k-l ,l+l)=j,Db(k,l)=i)) where Db(k,l) and Db(k-1,l+l) are the direction values in the block direction image Db at the neighboring locations (k,l) and (k-l,1+1) respectively. Therfunction increments by one whenever the direction value at locations (k,l) and (k-l,l+l) is the same. Since we have used 8 directions in computingthe direc-
tion image, C(l,j) is an 8x8 symmetric matrix. The diagonal elements of this matrix indicate the joint occurence of directions 1,2,..,8 respectively in the block direction image. Note that the histogram features correspond to the first-order statistics and the co-occurence features correspond to the second-order statistics of the direction image. We have used two featre selection methods to choose best feature subsets from the 16 input features, 8from the histogram frequency counts, 8 from the diaqonal elements of the co-occurence .matrix. The exhaustive feature selection method chooses the best subset for a specified size. The Whitney method [9] is a forward sequential feature selection method which results in a suboptimal subset of features, since all possible feature subsets of a given size are not examined. Both these feature selection methods use k-nearest neighbor decision rule with leave-one-out method to evaluate feature subsets. --
--
-
Classlficatlon Rule We used the k-nearest neighbor (k-NN) decision rule for fingerprint classification. The k-nearest neighbor rule exchanges the need to know the underlying class-conditionaldistributions lor that of knowing a large number of correctly classified patterns[l]. This non-parametric nature of k-NN rule makes it suitable for our classification problem. The basic idea behind the k-NN rules is that samples which fall close together in feature space are likely to belong to the same class or to have aboutthe same aposferioridistributionsoftheirrespectiveclasses. ...(Xn,~n)),where XI is the feaSuppose Sn is the set {(X~,CI), ture vector for the ith pattern, and the label G designates the true class of Xi. When we want to classify a test pattern X (independent of Sn ), we first determine the nearest neighbor Xk to X from Sn. Let
We extracted feature subsets with different (subset) sizes from the combined set consistingof the histogramfeatures and the texture features. The results of feature selection and the corresponding error rate using exhaustive search and Whitney method are summarised in Table 1. It shows the results run on sample size of 61 fingerprintsdrawnfrom 3classes: whorls, left loops, and right loops. It may be observed that, using a subset of features comprising (10 11 12 13 15 16) gives minimumerror rate of approximately 13%. It is evident from Table 1 that exhaustive search gives better feature subsets as compared to Whitney method. We have tested the classification scheme using the best feature subsets indicated in Table 1 for the the above sample size and the results are indicated in Table 2. Conclusion We have proposed a statisticalapproach for classificationof fingerprint patterns, which has hitherto been approached with syntacticmethodsonly. This has beendoneusing featuresfrom the directional transform domain instead of the original spatial domain. We have shown the effect of using different subsets of these feature on the recognition accuracy. Now that the problem has been posed as a statistical pattern recognition problem, a host of available techniques can be aplied. We have tested this scheme with 61 patterns (from 3classes:whorls, left loops and right loops) using the k-NN decision rule. The results of classification are promising. Further testing with a larger dataset is required to establish the robustness of the classificatiion scheme. Further work related to the proposed classification scheme includes use of decision treesfor classificationand introduction of reject option. The reiect option is neededto prevent misclassification which is required in practical applications Acknowledgements The authors are grateful to CMC Ltd and Michigan State University for supporting this work.
where 6 is some distance metric for the feature space. The test sample X is then assigned to class ck associated with the nearest neighbor Xk. Clearly, by using only one NN to X, we are not making very efficient use of informationcontainedin the data set Sn. So, a natural extension of the 1-NN rule to k-NN rule consists of finding the k-neearest neighbors to X from Sn, and assigning X to the class which is most heavily represented in the labels of the k-nearest neighbors. Classlflet Performance and Error Estimation The Leave-One-Out (LOO) method of error estimation has been found to be approximately unbiased, irrespective of the classifier andthe underlyingdistributions[l]. The Looestimate is formed as follows: Remove one sample (XI.G) from the design set Sn. Design the classifier using the (n- 1) training samples and test it with a single sample XI,^,). Return (Xi,Ci) to the design set and repeat these operations for i = l ,...n. Clearly, with this method, virtually all samples are used in each classifier design, and all samples are ultimately used for testing, though each design and test set may be regarded as independent. Experimental Results
References 1. P.A. Devijver and J. Kittler, Pattern Recognition: A Statistical Approach, Prentice hall, 1982. 2. B. Moayer and K.S. Fu, "Fingerprint Classification", in Syntactic Pattern Recognition, ed. K.S. Fu , Springer- Verlag, 1977. 3. Kameshwar Rao and K. Balk: "Type classification of fingerprints, a syntactic approach". IEEE Trans. on Pattern Analysis and Machine Intelltgence, vol. PAMI-2, no. 3. pp. . . 223231,-May 1980. 4. M. Kawagoe and A. Tojo, "Fingerprint Pattern Classification". Pattern Recognition,vol. 17, no. 3. pp. 295-303. 1984. 5. A. Grasselli, "On the Automatic Classification of Fingerprints", in Methodologies in Pattern Recognition, ed. S. Watanabe, Academic Press, 1969. 6. Technical Report on Fingerprint Image Processing and Feature Extraction. CMC Ltd, R&D Centre, Secunderabad, 1988. 7. Edward Henry, Classification of Fingerprints, His Majesty's Publishing House, London, 193.0. 8. B.M.Mehtre, N.N.Murlhy. S. Kapoor and B. Chatterjee, "Segmentation of Fingerprint images using the Directional Image".Pattern Recognition,Vol. 20, no. 4, pp. 429-435,1987.
9. A.W.Whitney, 'A Direct method of Nonparametric Measurements Selection", IEEE Trans. on Computers, pp. 1100- 1103, Sept. 1971. 10. R.M.Haralick et al. "Textural Features for lmage Classification", IEEE Trans. on Systems, Man, and Cybernatics,pp. 610-621, NOV.1973. 11. A.K.Jain and B. Chandrasekaran. "Dimensionality and Sample Size Considerations in Pattern Recognition in Practice", in Handbook of Statistics, eds. P.R.Krishniah and L.N.Kanal, Vol. 2, North Holland Publishing Co., pp. 835- 855, 1982.
Subst Sizc
kNN
Exhaustive Search
Core
Delta
Whimcy Mehod
Ermr rate
F e a m set
E m rate
Fcams t
2 2 2
1 3 5
0.29508 0.26230 0.22951
10 16 2 16 2 16
0.29508 0.29508 0.29508
10 16 10 16 10 8
3 3 3
1 3 5
0.22951 0.21311 0.1%72
258 248 258
0.26230 0.24590 0.21311
10 16 I5 101613 108 1
4 4 4
1 3 5
0.18033 0.19672 0.16393
2589 2 589 23812
0.27869 0.24590 0.24590
10 16 IS 8 10 16 13 9 l08l13
5
1
0.18033 0.18033
125916 234716
0.29508 0.21311
Figure 3: A Right Loop Fingeprint lmage
14
279101316
Figure 4: An Arch Fingeprint Image
6 Table I : F e a m selection results with 61 patterns from 3 clasvs .The features 12,.....8 are histogram features, and the features 9.10....16 are the dioenal clcmenu of the co-occurence mamx. '*' indicates that theother feanueGn hi subset are the same as indicated in the earlier rows.
Patterns
Whorls
Whorls
9
1
4
Left loops
1
16
1
Right loops
0
1
28
Left loops
Right loops
Table 2. Confusion matrix for the classification of fin e rint patterns from 3 classes using 6 best features ?nearest neighborn with 61 patterns.
wi8
Fig. 5. Block direction image for a whorl fingerprint.
Bifurcation point
Fig. 6. Block direction image for a left loop fingerprint. Figuw 2: A Whorl F ~ n g e p r ~ nImage t