as the ray is searched inward; when the derivative changes sign in this direction ... These aligned borders are then stored in a protected disk file for archival and ...
AutomaticComputerProcessingof Digital 2-DimensionalEchocardiograms ANDREW
J. BUDA,
JANICE M. JENKINS,
MD, EDWARD PhD, DAVID
J. DELP, PhD, CHARLES N. SMITH,
and BERTRAM
R. MEYER,
BSE, FRED L. BOOKSTEIN,
PhD, PhD,
PITT, MD
Quantitative studies of left ventricular function using P-dimensional echocardiography have been limited because of a lack of computerized methods to automatically analyze the echocardiographic images. Previous computer efforts have been directed at digitizing the video output of the 2-D echocardiogram, but this digitizing method has significant limitations. A direct digitization method that produces improvement in signal-to-noise ratio and, subsequently, improved automatic detection of
endocardial and epicardial borders, was developed. With definition of these edges, lefl ventricular global and regional analysis is possible frame by frame so that dynamic changes in cardiac function may be assessed throughout the cardiac cycle, Further technologic advances in 2-D echocardiographic acquisition and image processing should allow computer processing of 2-D echocardiographic data in real time.
Two-dimensional echocardiography (2-Decho) is particularly well suited to left ventricular (LV)functional
information, which eliminates any real-time capability, and the significant deterioration of the image as it is
analysis, in view of the many unique tomographic views that are available for study. However, assessment of LV function by 2-D echo remains largely qualitative because of intrinsic limitations of the ultrasound data, poor border definition in the stop frame video image, and the tedium of manual tracing of appropriate images.’ Despite these limitations, operator-defined 2-D echo video images of tomographic LV sections have yielded important quantitative information concerning LV volume,2*3mass,4 and function4-6 with acceptable error. Automatic computer processing of 2-D echo images would avoid the excessive time, labor, and subjectivity of manual tracing and would ultimately improve the reliability and validity of quantitative measures. Various techniques ’- lo for digitizing single frames of 2-D echo information are unsatisfactory because of the lengthy time required for digitizing a single frame of
transferred through several optical systems into the computer memory. Recently, Garcia et al” described an interface to a standard medical imaging computer from the video output of the 2-D echo unit or its videotape recorder. After space-time smoothing, they could automatically detect endocardial interfaces by standard threshold and second derivative methods. This report summarizes our recent work in computer acquisition and processing of 2-D echo images to quantify LV global and regional function, Our efforts initially involved acquisition and processing of 2-D echo video data,12 but more recently we developed a method of direct-line data acquisition for 2-D echo.ls Using the directly acquired data, we have used a number of edge detection algorithms to determine most anatomically appropriate borders. In parallel with this, we have developed a program for LV functional analysis for quantitative studies.
From the Division of Cardiology, Department of Internal Medicine, Division of Radiologic Physics, Department of Radiology, and the Department of Electrical and Computer Engineering, University of Michigan, Ann Arbor, Michigan. Manuscript received February 2, 1983; revised manuscript received May 2, 1983, accepted May 4, 1983. Address for reprints: Andrew J. Buda, MD, Division of Cardiology, 1405 East Ann Street, Ann Arbor, Michigan 48109.
Methods Digitization and processing of 2-D echo video data: Our initial attempts at computer processing of 2-D echo images were performed using a medical imaging system coupled to the video output of our 2-D echo unit.12The parasternal LV short axis at the midpapillary muscle level wasdigitized into 384
August 1983
THE AMERICAN JOURNAL OF CARDIOLOGY
Volume 52
385
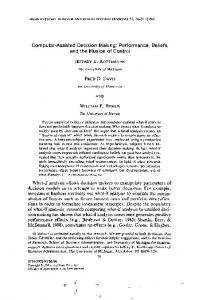
FIGURE 1. A parasternal,
loft ventricular, short-axis, video output-acquired P-dimensional echocardlographic image after processing with superimposition of endocardial and epicardial edges.
A. n discrete rays
t= time for echo return
COMPENSATlOhl
I
CONDITIONINGr AMPLIFIER
f-1
AIDCONVERTER
I EACH POfNT IS DEFINED BY ITS ANGLE AND ITS DISTANCE FROM CENTER
‘t
s.
Rn-1.
MAIN FRAME
NUMERICAL AND GRAPHIC OUTPUT (VENTRICULAR
DIMENSIONS ek
)
FIGURE 3. The mapping of the sector B-mode fan format (A) into a rectangular
FIGURE 2. The processing steps in a commercial sector scanner and our method of direct digitization of the envelopedetected signal. Several steps of noise introduction ,sre avoided by the direct digitization.
a 64 X 64 array at 30 fra:mes/sec and stored on magnetic tape for further processing. A total of 20 cardiac cycles were collected, electrocardiogram gated on the R wave. These digitized data were transferred by way of magnetic tape to the University of Michigan Computer and Image Processing Research Network.
matrix (B).
Our processing began with the spatial averaging of timealigned frames to produce a composite cardiac cycle of 29 images. Spatial smoothing further eliminated noise. An axially applied gradient method using 12 radial chords spaced 30” apart and originating at the center of the LV cavity was used to identify endocardial and epicardial boundaries. This approach produced short-axis LV images that were anatomically appropriate (Fig. 1). Real-time line-mode data acquisition: Wells and Woodcock14 distinguished between 2 approaches to echo
338
DIGITAL TWO-DIMENSIONAL ECHOCARDIOGRAMS
FIGURE 4. Lefl panel, a parasternal left ventricular end-systolic P-dimensional echocardiographic image taken directly from the video display. Right, the same image acquired using direct-line mode digitization. The shape of the left ventricle is somewhat distorted because of the rectangular matrix format, but endocardial and epicardial definition is improved.
signal digitization. They termed methods which digitized the usual visual output of the echo unit “digitization of analog recordings” and termed methods in which the-radio frequency (RF) signal or the envelope-detected signal was directly fed to an A/D converter “direct digitization.” The term “linemode data” has been applied to data digitized along the ultrasonic line of sight with positional information.15 To further improve the data at its source, we implemented direct-line digitization of our Z-D echo data (Fig. 2). We modified our computer’s video A/D converter for horizontal and vertical synchronization by external digital signals. The analog section was rebuilt to adapt to the post-time-gain compensation envelope-detected RF signal from the echo machine. The pixel clock that determines the sampling rate along a line was set to 2 MHz. From the digital-beam steering logic in the phased-array echo machine, 2 synchronization signals were derived: 1 for the firing of the center transducer element and 1 at the beginning of the first fan beam. The envelope-detected signal was amplified and transmitted directly to the A/D converter through a coaxial cable. Synchronization signals were sent through line drivers and coaxial cable to the synchronization input of the A/D converter. The process was controlled by an assembly language program with the same features as the television image digitization control programs, except that the image size was flexible to 128 X 256 pixels. R-wave triggering was used to synchronize the digitization, The B-mode signal fan rays were thus mapped into a rectangular matrix (Fig. 3). Since 128 fan lines were produced by the echo machine and all of them were digitized, there was no data loss within a single fan frame (Fig. 4). However, the digital transfer rate of the whole frame to magnetic disk was too slow to begin acquisition of the next fan frame. Thus, only every other fan frame was digitized. The row index of a matrix element was the ray number in which a specific resolution
element was sampled; the column index is the time of sampling measured from the center element transmit pulse. Only straight lines through the center of the source data coordinate system map into straight lines in the rectangular data matrix. An M-mode reconstruction from the columns of the rectangular matrix represents M-mode lines along the fan lines; an M-mode reconstruction along any other line is possible using the mapping function. Frame-to-frame and cycle-to-cycle averaging techniques for noise reduction are implemented easily in the software of this system using the programming language. Digital processing of line-mode data: In our initial work, the images at the same location in the cardiac cycle were temporally averaged to produce a representative cardiac cycle. The images were then spatially smoothed and a l-dimensional axial-gradient operation was performed. Regional wall measurements were digitally computed from the sequence of composite images to assess dynamic changes in wall thickness and chamber size throughout the entire cardiac cycle. Each frame was analyzed as a separate image and the adjacent frame redundancy was not exploited after the average cycle images were spatially registered. We have extended our previous work of boundary detection and estimation of LV wall thickness and volume by treating the images as a problem in time-varying image analysis.16 As the heart contracts, it is rotating, translating, and deforming. The problem of locating the endocardial boundary is treated as a problem of tracking a boundary of an object as it moves through a scene.” The edge detector we use is a modified version of the axial gradient method previously described.12 The algorithm begins by finding the center coordinates of the heart chamber in each frame. The images in our initial studies are interpolated to sector format from the line-mode format. The center is found by starting at any point within the chamber and locally
August 1983
THE AMERICAN JOURNAL OF CARDIOLOGY
LhlUaSl Regional Echo “k+;P;‘. O\obal EJectron
Systols
88
+1ee
88
+ 88
60
+ 68
40
+ 48
20
+ ae
0
+
8
&?0
-
a0
40
-
48
60
-
60
88
-
88
09
-100 F)rea
EJection
searching with a thresholding algorithm to find the endocardial boundaries. The localtions are then averaged to obtain the center of the chamber. If the thresholding algorithm cannot find the endocardium in a region due to each dropout, that local region is not used to estimate the center of the chamber. This method is a fast and accurate technique for finding the center of the chamber, lbecause the endocardial borders are as easily found by local thresholding. Once the center coordinates of each frame are found, the algorithm starts from the center point and moves along rays separated by 30°, computing the first derivative of the gray levels along the ray. The endocardium is assumed to be located where the derivative changes sign. The endocardium is found by starting at a location at the edge of thle image. The derivative is computed as the ray is searched inward; when the derivative changes sign in this direction, the epicardial border is located. The edge points are then connected to form closed contours using linear interpolation. To minimize artifacts in the boundaries using this algorithm, we are investigating the use of a connectivity test to determine if the boundary has sharp changes. This is manifested by a small radius of curvature in the boundary. If the connectivity test fails in that a small radius of curvature is found in a boundary,. we use this as a constraint in the algorithm to force the detector to find edges that do not have sharp boundaries. Our :results using the connectivity test are only preliminary but are very promising.18 The edge detector described above is a static edge detector in that it operates on single frames in the cardiac cycle. We are exploiting the temporal redundancy inherent in the data. While there are various approaches to this problem, we are considering a simple method: difference pictures. Difference pictures are created by obtaining the frame difference between the current frame in the cardiac cycle and the previous frame. After thresholding, this difference picture then indicates regions in the image where the heart has moved. The edge detector algorithm described above is modified so that only re-
387
:6EfD4;E
Diastcls
FIGURE 5. Regional analysis program used for quantitative 2-D echo studies. See text for details.
Volume 52
Fraction
Wat 1 Thickness
Change
gions in which the heart wall has moved are used in searching for the edges in that frame. This aids in finding the edges because the difference pictures indicate where along the rays the edges in the current frame are located. Thii technique can also be used to limit how much the edges are allowed to change from frame to frame. Using this approach, we found that cycle averaging and spatial smoothing may not he necessary with the directly digitized line-mode data. In fact, the edges found for each image in a cycle have fewer artifacts and tend to preserve edge connectivity throughout the cycle. Quantitative analysis of the left ventricular image: In parallel with our efforts at Z-D echo direct line-mode digital acquisition, image processing, and edge detection, we have developed a program to analyze regional LV function. This analysis may be applied to any LV short-axis projection and the derived data in combination with long-axis data may be used to estimate global LV function and mass using welldescribed algorithms such as Simpson’s rule. In this analysis, the endocardial and epicardial borders of the LV at end-diastole and end-systole are manually entered into the computer using a Tektronix digitizing tablet. A menu displayed on the image device guides and prompts the operator for data input. The data input consists of epicardial and endocardial borders, external alignment points for the systolic and diastolic images, and 5 cm magnification calibration points. Once all the data have been entered, the program calculates the center of mass of the diastolic endocardial border, the rotation angle, and translation coordinates for alignment of the systolic borders over the diastolic borders. These aligned borders are then stored in a protected disk file for archival and research use. Calculations are performed using the center of mass of the end-diastolic endocardial border as the reference point. The continuous borders are separated into 24 segments, each of 15’, for calculation of regional ejection fraction, regional wall area, and regional wall
300
DIGITAL TWO-DIMENSIONAL
ECHOCARDIOGRAMS
thickness (Fig. 5). There is a graphic display of proportional change, diastole to systole, along with the segmented systolic and diastolic borders.
Discussion The interpretation of LV function by Z-D echo largely remains a descriptive technique requiring expert observers. Quantitative analysis has involved manual delineation of endocardial and epicardial boundaries of end-diastolic and end-systolic frames by trained operators. Other frames of the cardiac cycle are generally not analyzed because of the time and labor involved. The ability to further automatically process these 2-D echo images should improve our ability to quantitate 2-D echo data, provide a more objective approach to interpretation, and improve interobserver variability. The major limiting factor to the development of computer processing of 2-D echo has been the long acquisition times required to digitize a single frame of data. However, digital interfaces specific to ultrasound make it possible to acquire digital 2-D echo data in real time. Owing to the inherent complex interaction of ultrasound in tissues and the several steps of processing that occur within the commercial 2-D echo unit, these digitized data are noisy. In our initial approach to acquisition of 2-D echo data, the video output of the unit12 was digitized. This method has several flaws. First, the resampling process required to form a video image from the line-mode data tends to produce undersampling of data in the near field and oversampling in the far field. Second, the ultrasound frame generation may not match the video frame rate. Third, the scan converter within the echo unit maps the information into a range of gray values with a dynamic range matched to the human visual system; however, the usable dynamic range of the data is significantly greater. Fourth, the averaging technique for speckle reduction is usually not under user control. Fifth, the video image data depends on the processing performed by the echo technician, who varies the control settings on the echo unit to achieve an image that looks best to the human observer; however, this image may not necessarily be optimal for computer processing. For these reasons, we approach the digital acquisition of 2-D echo data through direct line-mode digitization.13 With this approach, RF envelope-detected data are digitized before data transfer to the digital scan converter. This avoids the introduction of noise at several levels of data conversion and provides improved signal-to-noise ratios. Robinson and Williams15 indicated that this method is superior to other methods of digitization for 2-D echo processing. In addition, this line-mode digitization method has several advantages over conventional video image digitization. First, the ultrasound frame generation rate is equal to the A/D frame conversion rate; this condition is not necessarily fulfilled by video image digitization. Second, the envelope-detected signal is independent of all control settings on the echo unit except for gain control. Third, the dynamic range of the a-bit line-mode data significantly exceeds that of the typical 4- to 6-bit output of the digital scan converter used for video data acquisition. For these reasons, we believe
that line-mode data digitization is presently the preferred method of ultrasound data acquisition for computer processing. Image processing and algorithm development have been undertaken on our computer system. After applying Laplacian, Sobel, trapezoidal, and high-pass filtering edge detection routines, our approach of axial gradient edge detection appears to be the simplest and most accurate for providing anatomically appropriate endocardial and epicardial definition. With the linemode digitization, temporal or spatial smoothing or both may produce artifacts in our automatically derived edges.16 These smoothing techniques may be better suited to 2-D echo video data, for which they provide some improvement in signal-to-noise ratios. Further algorithm development, testing, and validation are required before clinical application of these techniques is attempted. Although our axial gradient technique is used, we believe that edge detection would be improved by using a time-varying image analysis approachi7Js in which edge redundancy in frame-by-frame analysis would be used to provide further improvement in edge tracking. This form of dynamic scene analysis has been used in other imaging problems with success.ig,Zo Assuming that appropriate edges can be found and validated, a quantitative approach to global and regional analysis would then be necessary. Several attempts at LV function quantitation have been undertaken with manually defined edges, with variable success.2-6 Although good correlations with standard measurements have been achieved, there remains 10 to 20% variability in the measurement of LV volumes and mass. This variability derives from tomographic trajectory, poor endocardial definition, observer error, and, of course, additional variability of the gold standard method.21 For instance, in contrast LV angiography, the contrast material produces volume loading and a negative inotropic effect,22 contributing to discrepancies with other imaging techniques. Automatic methods of edge detection and quantitation for 2-D echo should reduce interobserver variability but will not influence these other factors, which require different solutions. A major impact of automatic quantitated processing will be the time saved in analysis and the ability to measure dynamic information contained within the entire cardiac cycle. The quantitative analysis of regional function that we have developed is similar to approaches previously described.“Jl However, controversy continues regarding the use of coordinate systems and correction of 3-D movement.2s This problem is best illustrated by the variability of regional analysis, which depends on whether a fixed or floating center of mass is used.” Although axial coordinates have been traditionally used with most cardiac imaging modalities, the unique tomographic information provided by 2-D echocardiography permits an approach to shape descriptors using Fourier shape analysis or mean tensor analysis.24 These forms of analysis may circumvent the problem introduced with a coordinate, axial approach to quantitative regional LV function. We anticipate further improvements in digital data acquisition, image processing, development of edge
August 1983
detection algorithms, and methods of quantitation of 2-D echo images. These improvements should then provide a basis for meaningful 3-D reconstruction25 of 2-D echo images. References 1. Gelser EA, Skorton DJ, Conetla DA. Quantification of left ventricular function by twodimensional echocardiography: consideration of factors restricting image quality. Am Heart J 1982;103:905-910. 2. Wyatt HL, Heng MK, Meerbaum S, Hedenes JD, Dula E, Corday E. Cross-sectional echocardiography. II. Analysis of mathematical models for quantifying volume of ihe formalin-fixed left ventricle. Circulation 1980;81:119-1125. 3. Schiller NB, Acquatella H, Ports TA, Drew D, Goerke J, Ringertz H, SIIverman NH, Brundage B, Botvinick EH, Boswell R, Carlsson E, Parmley WW. Left ventricular volurne from a paired biplane two-dimensional echocardiogram. Circulation 1979;60:547-555. 4. Wyatt HL, Heng MK, Meerbaum S, Hestenes JD, Cobo JM, Davison RY, Corday E. Cross-sectional echocardiography. I. Analysis of mathematic models for quantifying mass of the left ventricle in dogs, Circulation 1979;60:1104-1113. 5. Folland ED, Parlsi AF, Moynihan PF, Jones RJ, Feldman CL, Tow DE. Assessment of lefl ventricular ejection fraction and volumes by realtime two-dimensional echocardiography. A comparison of cineangiogiaphic and radionuclide technique. Circulation 1979;60:780-766. 8. Paris1 AF, Moynihan PF, Folland ED, Feldman CL. Quantitative detection of regional left ventricular contraction abnormalities by twodimensional echocardiography. II. Accuracy in coronary artery disease. Circulation 1981;83:781-767. 7. Skorton DJ, McNary CA, C:hlld JS, Shah PM. Computerized image pro;“,?/: 6in cross-sectional echocardrography. Am J Cardiol 1980;45: 8 8. Matsumoto M, Matsuo H, Kltabatake A, Moue M, Hamanka Y, Tamura S, Tanaka K, tflroshl A. Three-dimensional echocardiograms and twodimensional echocardicgraphic images at desired planes by a computerized system. Ultrasound Med Biol 1977;3:163-179. 9. Garrison JB, Wels JL, Malnghan WL, Tuck ON, Guler WN, Fortuln NJ. Quantifying regional wall motion and thickening in two-dimensional echocardiography with a computer-aided contouring system. In: Computers in Cardiology. Bethesda, Maryland: IEEE Computer Society, 1977:25-35. 10. Skolnkk ML. A new approach to ultrasound image recording using a video disk recorder. Radiology 1979;133:530.
THE AMERICAN JOURNAL OF CARDIOLOGY
Volume 52
388
11. Garcia E, Gueret P, Bennett M, Corday E, Zwehl W, Meerbaum S, Corday S, Swan HJC, Berman D. Real time computerization of two-dimensional echocardiography. Am Heart J 1981;101:783-792. 12. Jenkins JMr Qlan G, Besozrl M, Delp EJ, Buda AJ. Computer processing of echocardrographic images for automated edge detection of left ventricular boundaries. In: Ripley KL, Ostrow HG, eds. Computers in Cardiology. Be thesda. Maryland: IEEE Corn uter Society, 1981;391-394. 13. Spllttgerber FH, Bach CG, g mith DN, Buda AJ, Pitt B. Digital line mode data acquisition for a phased array cardiac ultrasound scanner (abstr). UItrasonic Imaging 1982;4:198-199. 14. Wells PNT, Woodcock JP. Comouters in ultrasonic diaanostics. Forest Grove, 0R:Research Studies P&s. 1977. 15. Roblnson DE, Wllllams BG. Computer acquisition and processing of ultrasonic data. In: Kazher E, de Vlieger M, Miller HR. McCready VRO. eds. Ultrasonics in Medicine. Amsterdam: Excerpta Medica, 1975:96-102. 18. Delp EJ, Buda AJ, Swastek M, Smith DN, Jenkins JY, Meyer CR, Pitt B. The analysis of two-dimensional echocardiograms using a time-varying image approach. In: Ripley KL, Ostrow HG, eds. Computers in Cardiology. Bethesda, Maryland: IEEE Computer Society, in press. 17. y!;;y,TS. Image Sequence Analysis. New York: Springer-Verlag, 1981; 18. Delp EJ, Chu H. Edge detection using contour tracing. Proceedings of the 20th Annual Allerton Conference on Communications, Control, and Computing. 1982;116-125. 19. Marttn WN, Aggarwal JK. Survey: dynamic scene analysis. Comput Graphics Image Processing 1981;14:12-18. 20. Yachida M, lkeda M, Tsujl S. A plan-guided analysis of cineangiograms for measurement of dynamic behavior of heart wall. IEEE Trans Pattern Analysis Machine Intelligence, PAMI-2, 1980;537-543. 21. Schntttger I, Fitzgerald PJ, Daughters GT, lngels NB, Kantrowltz N, Schwartzkopf A, Mead CW, Popp RL. Limitations of comparing left ventricular volumes by two dimensional echocardiography, myocardial markers and cineangiography. Am J Cardiol 1982;50:512-519, 22. Vine DL, Hegg TD, Dodge HT, Steward DK, Frimer M. Immediate effect of contrast medium injection of left ventricular volumes and ejection fraction. Circulation 1977;56:379-384. 23. Clayton PD, Jeppson GM, Klausner SC. Should a fixed external reference system be used to analyze left ventricular wall motion? Circulation 1982; 85:1518-1521. 24. Booksteln FL. The measurement, of biological shape and shape change. T;$cture Notes in Bromathemabcs. Vol. 24. New York: Springer-Verlag. 25. Geiser EA, Arlet M, Conetta DA, Lupklewlcz SM, Christie LO, Jr, Conti RC. Dynamic three-dimensional echocardiographic reconstruction of the intact human lefl ventricle: technique and initial observations in patients. Am Heart J 1982;103:1056-1065.