image, detects and removes the specular reflection of the incident light, as well as the foam ... error between automatic and manual counts from multiple ..... Tl. 5. 3.1%. 6.1%. 5.0%. 1.1%. Tm. 5. 0.5%. 4.8%. 2.6%. 1.7%. Tn. 4. 1.7%. 8.1%. 4.1%.
2011 4th International Congress on Image and Signal Processing
Automatic counting the number of Collembola in digital images C.M.R. Caridade∗ ‡ , A.R.S. Marcal†‡ , T. Mendonca† , and T. Natal-da-Luz§ , and J.P. Sousa§ ∗ Instituto
Superior de Engenharia de Coimbra Coimbra, Portugal † Faculdade de Ciˆencias, Universidade do Porto, Portugal ‡ Centro de Investigac¸a˜ o de Ciˆencias Geo-Espaciais (CICGE) Porto, Portugal § IMAR-CMA Departamento de Ciˆencias da Vida Universidade de Coimbra, Portugal Abstract—Counting the number of Collembola in digital images is a routine task in laboratories of soil ecotoxicology. This process is based on a direct visual identification of Collembola, and is consequently a time consuming task. This paper present a fully automatic system for counting the number of Collembola in digital images. The system selects the interest area of the image, detects and removes the specular reflection of the incident light, as well as the foam developed during laboratory experiment and finally identifies and counts the number of Collembola. The system performance was tested using 5 treatments with 9 or 10 replicates and 13 treatments with 4 or 5 replicates. A total of 111 images were tested and the results were compared with those obtained by manual identification. The average relative error between automatic and manual counts from multiple observations of the same treatment was 2.1%, which can be considered a good result, given that this value is below the standard deviation between multiple replicate counts.
I. I NTRODUCTION The ability of soil organisms to respond to contaminants may be used to indicate the potential hazardousness of a particular soil [1]. One of the organisms widely used to evaluate soil contamination is the collembolan species Folsomia candida [1], [2]. Collembola are small invertebrates [3] that belong to the Apterygota group. Collembola are commonly used in laboratory toxicity tests since they are relatively easy to be maintained in laboratory cultures and they have a short life cycle [1], [2]. Reproduction tests with Collembola are based on the exposure of 10 adult organisms during 28 days at a gradient of soil contamination (including a soil without contamination that is used as control). After this period, the soil together with the Collembolan are transferred to cilindrical plastic boxes, submerged in water with some drops of blue ink (to increase the contrast) and photographed to determine the number of juvenile and adult survivors in each replicate. The amount of juveniles in the contaminated soils compared with that of control treatments is the indicator of soil contamination [2]. Counting the number of juveniles of Collembola in photography is therefore a routine task laboratories of soil ecotoxicology. The counting process used in IMAR-CMA, Department of Life Sciences, University of Coimbra, Portugal,
978-1-4244-9305-0/11/$26.00 ©2011 IEEE
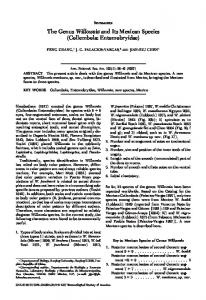
is based on direct visual counting in photography, and is consequently a time consuming task [4]. The images are acquired using a digital camera attached to a binocular system producing RGB colour images (24 bits) with 1024 by 768 pixels. Direct lighting, using a combination of natural and artificial resources light is used. Despite the efforts made to minimize reflections, it is normal to have specular reflections areas at the edges of the circular treatment. Figure 1 shows two images acquired by this process. These images have a bright background and a darker circular area, that correspond to a sample of the plastic box, which define the region of interest. The bright areas near the edge of the circular area corresponds to the specular reflection of the incident light. Other bright areas within the sample disk (the foam) are developed during the laboratory experiment. The presence of foam and specular reflection in an image can disturb considerably the task of counting the Collembola, both by an automatic system or by an human operator. Furthermore, Collembola are living organisms, so they are in constant motion. The purpose of this study was to develop a fully automatic application for counting the number of Collembola in digital images, trying to overcome several aspects that generally difficult the counting of these organisms. II. M ETHODOLOGY The application for automatic counting the number of Collembola in digital images was developed in MATLAB [9]. This application is divided in 3 parts:(i) selection of the interest area, (ii) detection of noise, (iii) identification and counting the Collembolans [10]. A. Selection of interest area Let F be the grayscale image obtained from the original color image by averaging the RGB components. In F , there are two well-defined groups: the background and the sample of plastic box. Thus, it is possible to define a binary image B, obtained from F by binarization, using a global threshold by Otsu’s method [10]. After this, the image is reversed resulting in its negative, with the ON pixels of the binary
1868
the pixels from the boundary of the specular reflection and the center of mass are calculated. The circles inside and outside the replicate are respectively defined by the distance between minimum and maximum values calculated previously. These limits are presented in Figure 2(b) for the image T d3. However, some images do not have specular reflection, and in these cases the inside and outside circles of the interested area are coincident (Fin = Fout ). The annular region Fring is defined as the subtraction between Fout and Fin regions. Figure 2(c) and 2(d) represent the Fin and Fring region for the image T d3.
(a) Td3
B. Foam detection The algorithm developed to segment the inside region (Fin ) is based on an iterative threshold decrease. The threshold is adapted to the image, having the lowest value that does not allow the passage of foam. The iterative process for calculating the adaptive threshold is described by the following 6 steps:
(b) Tj4 Fig. 1. Examples of digital images produced by (a) S´onia Chelinho and (b) Tiago Natal-da-Luz.
image corresponding to the foreground. From the negative binarized image, the noise is eliminated using the morphological operator closing with a circular structuring element of 5 pixels radius [10]. In this operation all objects less than 79 (= π52 ) pixels (including the Collembola) are eliminated. The boundary between the disk and the image background becomes smoother and easier to identify. After determining the boundary of the sample, the geometric center of the disk (xc ,yc ) is calculated by the center of mass of the region [9], [10]. To identify the interest area, an algorithm to separated the image into 2 regions (F out, F in) was developed. Initially, two circles centered at (xc ,yc ) with radius r0 , and r1 are defined (equation 1), where dx and dy represent the image size and dtop , dbotton , dlef t , dright the perpendicular Euclidean distances between the center and the margins of the image. r0 = 13 min(dx , dy ), r1 = min(dtop , dbotton , dlef t , dright )
(1)
Starting from the circular areas defined by r0 (inside circle) and r1 (outside circle), it is possible to establish the region Fin and Fout , respectively. The specular reflection is located in the Fout region. Figure 2(a) shows these two regions for the image T d3. To detect the specular reflection a threshold with an high value is used, so that only the bright objects are detected. Then, all objects are eliminated, including Collembola under 30 pixels in size (Collembola adults ≈ 30 pixels, juveniles ≈ 10 pixels). The remaining objects detected in this region are considered as specular reflections. The distance between
1) Apply a high threshold Li to Fin region, resulting in a i binary image Bin with only bright objects. 2) Apply a lower threshold Li+1 = Li − 10 to Fin , thus i+1 obtaining another binary image Bin . 0 3) Define the binary image Bin by subtracting the image i+1 i Bin to Bin . 0 4) Calculate for all pixels of Bin the number of objects n that are in a neighborhood (11 × 11) of the central pixel. 5) In the case of n >= 60% (value obtained by observation of a number of test images, which corresponds to about 76 pixels in the neighborhood), the binary image possess foam and the algorithm continues to step 6. Otherwise goes back to step 2 for a new iteration (i + 1). 6) The final threshold, adapted to the image Fin , is defined and the image is segmented, obtaining a binary image (Bin ). C. Identifying and counting The number of Collembola in the inside region (nin ) is calculated by identifying the number of objects in Bin . In this context, an object is defined as a connected component in the binary image, for an 8-adjacency neighborhood. The result for image Fin (T d3) is presented in Figure 3(a). To estimate the number of Collembola inside the ring (nring ), if it exist, the specular reflection is subtracted to the Fring image. The image of the ring is initially segmented with a pre-defined (low) threshold value, so that all objects are identified. The threshold value is defined taking into account that part of the ring area consists of high intensity pixels (reflection) and therefore the objects of interest will be characterized by much lower intensities. The objects detected in the Fring (T d3), are presented in Figure 3(b). The total number of Collembola in the image is the sum of the Collembola detected inside the region of interest nin and in the ring region nring . The location of all Collembolans detected in image FT d3 is presented in Figure 4, overlaid in the original grayscale image.
1869
(a) Fin (T d3)
(a) initial Fin and Fout
(b) Fring (T d3)
(b) final Fin and Fout
Fig. 3. Collembola detected in the inside area (a) and in the outside ring (b) of the image Fin (T d3).
(c) Fin Fig. 4.
Collembolans detected in F (T d3) image.
III. E XPERIMENTAL PROCEDURE
(d) Fring = Fout − Fin Fig. 2. T d3).
Various stages of the detection of inside and outside regions (image
An experiment was devised in order to evaluate the ability of the proposed method to count Collembola in digital images of cilindrical plastic boxes. The methodology adopted for the experimental procedure in the laboratory is in accordance with the International Standards Organization (ISO) guideline of 1999 for collembola reproduction tests. The images obtained were processed and Collembolans counted automatically with the system proposed. The results were compared with the values obtained by manual counting. IV. R ESULTS A total of 18 different treatments were available for testing, 5 with 9 or 10 replicates and 13 with 4 or 5 replicates.
1870
The total number of images tested was 111. The images have different quality levels, according to the amount of foam present. The automatic counting system was applied to each of these images, and the results compared with those obtained by manual identification. Table I shows the results for the 9 replicates of treatment T a. The number of Collembola in
TABLE II R ESULTS FOR RELATIVE ERRORS OF INDIVIDUAL IMAGE ( ALL 111 IMAGES ).
Image
Ta Tb Tc Td Te Tf Tg Th Ti Tj Tl Tm Tn To Tp Tq Tr Ts
TABLE I R ESULTS FROM AUTOMATIC SYSTEM FOR A SAMPLE T a. (W HERE STD MEANS STANDART DESVIATION ) Image
T a1 T a2 T a3 T a4 T a5 T a6 T a7 T a8 T a9 Average std
Manual 656 843 696 789 847 853 730 649 1050 790.3 126.4
Automatic 683 880 688 827 805 815 688 609 1047 782.4 132.7
Difference 27 37 −8 38 −42 −38 −42 −40 −3 −7.9 34.7
Error 4.1% 4.4% 1.1% 4.8% 5.0% 4.5% 5.8% 6.2% 0.3% 4.0% 2.0%
(1.0%)
different replicates of the same treatment T a ranges from 649 ↔ 1050 (manual detection) and 609 ↔ 1047 (automatic detection). The variation in the number of Collembola between different replicates of the same treatment is high, in fact much higher than the difference between manual and automatic counting results. This happens because the Collembola are living organisms that move. Therefore, at different image acquisition moments it is possible to get very different Collembola numbers for images of the same treatment. In this case, the relative error of a replicate vary between 0.3% and 6.2%. The average number of Collembola detected was 790.3 (manual) and 782.4 (automatic). The average relative error of individual replicates is 4.0% with a standard deviation of 2.0%. However, when averaging the counting values from the 9 replicates available for this treatment, the average relative error is only ∼ 1.0%. The results for all 111 images are shown in Tables II and III. The maximum relative error of individual replicates, ranges from 4.8%(Tm ) to 14.6%(Tr ) and the minimum relative error ranges from 0.0%(Tq ) to 7.3%(Ts ). The average relative error ranges from 2.0%(Tq ) to 11.5%(Ts ) with a standard deviation (Std) from 1.1%(Tl ) to 6.2%(Tr ). The average number of Collembola detected ranges from 113.2(Tq ) to 882.7(Te ) for manual and from 113.2(Tq ) to 878.2(Te ) for automatic detection. The average relative error of multiple observations range from 0.0%(Tq ) to 6.4%(Ti ). Thus, the average relative error obtained in the 111 images was 4.6% and the mean relative error from multiple observations was 2.1%. V. C ONCLUSION A new method was developed to automatic counting the number of Collembola in digital images. The main challenges encountered in implementing such a system were the different characteristics of the images used in terms of noise. The presence of specular reflection at the edges of the disk from the lighting used, and the presence of foam, usually in the center
N ◦ replicates 9 10 9 10 10 5 5 5 5 5 5 5 4 5 5 5 4 5
Min 0.3% 1.8% 0.3% 0.9% 0.5% 4.1% 1.2% 7.1% 3.1% 0.5% 3.1% 0.5% 1.7% 5.3% 3.6% 0.0% 0.6% 7.3%
AVERAGE
Relative errors of individual image Max Average 6.2% 4.0% 8.0% 3.8% 4.9% 3.0% 6.1% 3.0% 5.5% 3.3% 12.3% 7.4% 13.5% 6.2% 11.2% 9.1% 13.3% 7.3% 13.6% 5.8% 6.1% 5.0% 4.8% 2.6% 8.1% 4.1% 9.3% 7.2% 10.3% 7.1% 5.3% 2.0% 14.6% 9.1% 14.0% 11.5% 4.6%
Std 2.0% 2.0% 1.6% 1.9% 1.8% 3.0% 4.6% 1.7% 4.2% 5.2% 1.1% 1.7% 2.8% 1.7% 2.5% 2.2% 6.2% 2.5% 2.7%
TABLE III R ESULTS FOR AVERAGE OF ALL REPLICATES ( ALL 111 IMAGES ).
Image
Ta Tb Tc Td Te Tf Tg Th Ti Tj Tl Tm Tn To Tp Tq Tr Ts AVERAGE
N ◦ replicates 9 10 9 10 10 5 5 5 5 5 5 5 4 5 5 5 4 5
Manual 790.3 423.4 748.7 870.6 882.7 318.4 203.4 187.4 278.6 186.4 473.6 595.2 428.5 206.2 203.6 113.2 178.8 159.0
Average of all replicates Automatic Relative error 782.4 1.0% 425.6 0.5% 734.3 1.9% 853.4 2.0% 878.2 0.5% 307.6 3.4% 207.0 1.8% 182.0 2.9% 260.8 6.4% 187.6 0.6% 455.4 3.8% 592.6 0.4% 442.5 3.3% 201.8 2.1% 194.6 4.4% 113.2 0.0% 169.8 5.0% 151.2 4.9% 2.1%
of the disk, complicates the identification of Collembola. In this context, specific algorithms were developed for the elimination/reduction of these forms of noise that contaminate the images. The specular reflection is identified and effectively removed by segmenting the image into 2 regions. The foam in the image is removed using an algorithm that performs successive binarization of the image. With this image, without specular reflection and without foam, the Collembola are counted using image processing methods for detection and identification objects in the image. To evaluate the performance of the system developed, tests were performed to compare the results obtained by automatic system and manual operator. The average relative error obtained in the 111 images tested was 4.6% with standard
1871
deviation of 2.7% and the mean relative error from multiple observations was 2.1% which conveys the good results obtained by the developed system. In the future a comparison between the automatic system and several different operators on the same images will be made. It is necessary to evaluate the error between different manual operators as well, in order to validate the counts obtained automatically. The application developed can be used to counting the number of Collembola in digital image, and eliminate the time-consuming task of a manual operator. ACKNOWLEDGMENT We would like to thank S´onia Chelinho from the IMARCMA for some of the images used in this study. This work was supported by Fundac¸a˜ o para a Ciˆencia e Tecnologia (FCT) through a PhD fellowship (SFRH/BD/32150/2006). R EFERENCES [1] T. Natal-da-Luz, R. Ribeiro and J.P. Sousa, Avoidance tests with collembola and earthworms as early screening tools for site–especific assessment of polluted soils. Environmental Toxicology and Chemistry 23, 2188–2193, 2004. [2] M.T. Fountain and S.P. Hopkin, Folsomia candida (Collembola): A ”Standart” soil Arthropod. Annual Review of Entomology 50, 201–222, 2005. [3] P.F. Bellinger, K.A. Christiansen and F. Janssens, Checklist of Collembola of the World. http://www.collembola.org, August, 2010. [4] J.M. Wolfe, T.S. Horowitz and N.M. Kenner, Rare items often missed in visual searches. Nature 435, 439–440, 2005. [5] J. Lukas, Z. Kucerova and V. Stejskal, Computer-based image analysis to quantify the number of micro-arthropods in a sample. Entomologia Experimentalis et Applicata 132, 289–294, 2009. [6] J. Luk´as˘ and V. Stejskal, Image analysis of occupancy and contaminationMediterranean flour moth, Ephestia Kuehniella and parasitoid Venturia canescens. Jounal of Stored Produts Research 27(9), 85–92, 2004. [7] J. Fornal, T. Jeli´nski, J. Sadowska, S. Grundas, J. Nawrot, A. Niewiada, J.R. Warchalewski and W. Blaszczak, Detection of granary weevil Sitophilus granarius (L.) eggs and internal stages in wheat grain using soft X-ray and image analysis. Jounal of Stored Produts Research 43, 142–148, 2007. [8] P.J.D. Weeks, M.A. O’Neill, K.J. Gaston and I.D. Gauld, Automating insect identification: exploring the limitations of a prototype system. Journal of Applied Entomology 123, 1–8, 1999. [9] Mathworks: Using Matlab, Version 6.5. The MathWorks, Inc. Natick MA., 2002. [10] A.R.S. Marcal and C.M.R. Caridade, A system for automatic counting the number of collembola individuals on petri disk images. Spring Lecture Notes in Computer Science 4142, 814–822, 2006. [11] T. Natal-da-Luz, S. Tidona, B. Jesus, P.V. Morais and J.P. Sousa, The use of sewage sludge as soil amendment. The need for an ecotoxicological evaluation. Journal of Soils Sediments 9, 246–260, 2009.
1872