Automatic detection of the view position of chest radiographs Thomas M. Lehmann*, Mark O. Güld, Daniel Keysersa, Henning Schubertb, Andrea Wenning, Berthold B. Weinb Department of Medical Informatics a Chair of Computer Science VI b Department of Diagnostic Radiology Aachen University of Technology (RWTH), Aachen, Germany
ABSTRACT Automatic identification of frontal (posteroanterior/anteroposterior) vs. lateral chest radiographs is an important preprocessing step in medical imaging. A recent approach by Amura et al. (Procs SPIE 2002; 4684: 308-315) is based on manual selection and combination of about 500 radiographs to generate as much as 24 templates by pixel-wise summing up the references, and a correctness rate of 99,99 % is reported. In order to design a fully automated procedure, 1,867 images were arbitrarily selected from clinical routine as reference for this work: 1,266 in frontal and 601 in lateral view position. The size of the radiographs varies between 2,000 and 4,000 pixels in each direction. Automatic categorization is done in two steps. At first, the image is reduced substantially in size. Regardless of the initial aspect ratio, a squared version is obtained, where the number h of pixels in both directions is a power of two. In the second step, the normalized cross correlation function at the optimal displacement is used for 5-nearest-neighbor classification. Leaving-one-out experiments were performed for h = 4, 8, 16, 32, and 64 resulting in mean correctness of 92.0 %, 99.3 %, 99.3 %, 99.6 % and 99.4 %, respectively. With respect to the approach of Amura et al., these results show that the determination of the view position of chest radiographs can be fully automated and substantially simplified if the correlation function is used directly for 5-NN classification. Keywords: Image Analysis, Chest Radiographs, Content-Based Image Retrieval (CBIR), Picture Archiving and Communication Systems (PACS), Computer-Aided Diagnosis (CAD), Software Evaluation
1. INTRODUCTION Although modern imaging modalities such as computed tomography or magnetic resonance imaging are about to replace many types of x-ray examinations, the traditional chest study is still by far the most common type of radiological procedures, accounting for at least a third of all examinations in a typical radiology department [1]. However, the reading of chest radiographs is extremely challenging and, therefore, a wide area of research for computer-aided diagnosis (CAD) in chest radiography has grown. In particular, the segmentation of lung fields or the rib cage as well as local analysis such as nodule detection are the most frequently studied problems in automatic image processing of chest radiographs [2]. To implement a CAD system for chest radiographs into a clinical environment, it is important to correctly identify the view position of image acquisition, i.e., posteroanterior (PA) or anteroposterior (AP) vs. lateral view [3,4], as well as the orientation of the image, i.e., top-down, left-right, and mirroring [5,6,7]. These are also essential preprocessing steps for data handling in picture archiving and communication systems (PACS) and content-based image retrieval (CBIR). Pietka and Huang [5] presented an automatic three-step procedure that determines the image orientations of computed radiography chest images and rotates them into a standard position to be viewed by radiologists. Based on horizontal and vertical pixel profiles, the orientation of the spine within the images is detected and the upper extremities are located. Finally, the lungs are extracted and compared to ascertain whether the image is flipped. Based on 976 images, a *
[email protected]; phone +49 241 80-88793; fax +49 241 80-82426; http://www.irma-project.org; Department of Medical Informatics, Aachen University of Technology, Pauwelsstr. 30, D - 52057 Aachen, Germany.
rate of 95.4 % correctly orientated radiographs is reported. In order to simplify this approach and to make it suitable for hardware implementation, Evanoff and McNeill [7] applied linear regression to only two orthogonal profiles. Then, the edge of the heart is located to make sure that the image is not displayed as a mirror image. However, only 90.4 % correctness is reported based on only 115 chest images. More sophisticated, Boone et al. [6] extracted feature data from 1,000 digitized chest radiographs to train a neural network on orientation correction. Based on another set of 1,000 images which have not been seen during training, 99.4 % were correctly rotated but the overall correctness including mirroring was only 88.8 %. Harreld et al. [3] also applied neural networks to identify the view position of chest radiographs and reported an accuracy of 98.7 %. However, the design of neural networks is sophisticated, their training is complicated and time consuming, and also, it is desirable to develop more accurate methods for the identification of correct views of chest radiographs. Recently, Arimura et al. [4] have proposed an advanced computerized method by using a template matching technique for correctly identifying either PA or lateral views and applied it to a large database of approximately 48,000 PA and 16,000 lateral chest radiographs. In particular, 24 templates were generated by the summation of in total 464 reference images, which had been manually selected and combined. A two-step scheme is applied. If the difference between the two largest correlation coefficients with three PA and two lateral templates is above a certain threshold, the second step is applied to distinguish small and large patients and to classify the radiograph based on further 11 to 19 particular templates. Although an accuracy of 99.99 % is reported, the manual generation of such a large number of templates is cumbersome, time consuming and, most crucial, it is highly observer-dependent. Therefore, the technique of Arimura et al. is difficult to reproduce and to apply to other PACS or CBIR environments. In this paper, we present a simpler method based on the k-nearest-neighbor (k-NN) classifier resulting in almost equal accuracy rates but being both computationally efficient and fully automated, since the selection and combination of references for template generation becomes obsolete.
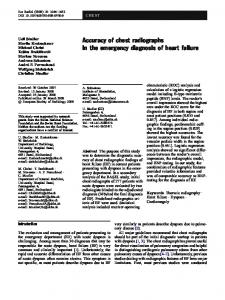
2. METHODS Our approach for the identification of the view position of chest radiographs is embedded in a system for content-based image retrieval in medical applications (IRMA) [8]. IRMA is a distributed system using a central relational database, which stores administrative information about distributed objects (image data, methods of computation, and features resulting from method processing) and query processing to control parallel processing on all IRMA workstations [9]. 2.1. Image data The IRMA database is used as reference for this study. It currently holds 1,867 chest radiographs which have been selected arbitrarily from clinical routine. In particular, 1,266 radiographs in posteroanterior/anteroposterior (PA/AP) and 601 images in lateral view position are available. The size of radiographs ranges between 2,000 and 4,000 pixels in each of x and y directions with 8 bit quantization. The non-lateral images can be differentiated into plain images of standing patients, supine images from critically ill patients from intensive care units, and pediatric images in both hanging and laying positions (Fig. 1).
(a)
(b)
(c)
(d)
(e)
Figure 1: The chest radiographs within the IRMA database are used as references. (a) high contrasted PA from an adult patient; (b) and (c) AP from intensive care units of an adult and an infant patient, respectively; (d) and (e) lateral views.
Being representative for a large radiological department, the image quality could be separated into three groups: -
regular images with decent contrast and no severe pathology, medium grade images with low contrast and/or partial technical defects (e.g. collimation errors, over-/under-exposure), and poor quality images with metal artifacts, grave technical problems, and/or severe pathologies.
2.2. Size reduction Automatic categorization of PA/AP and lateral view positions is achieved in two steps. At first, the image is substantially reduced in size. Regardless of the initial aspect ratio, a maximal-sized squared version is obtained by linear interpolation, where the number of pixels in x and y directions is the next smaller power of two. Integrating neighbored pixels, a feature image of h x h pixels is generated (Fig. 2).
(a)
(b)
(c)
(d)
(e)
Figure 2: The h x h-sized images were obtained from the PA/AP chest radiograph in Fig. 1a: (a) to (e) correspond to h = 32, 16, 8, 4, and 2, respectively.
2.3. Distance measures To determine the similarity between a reference image r(x,y) and the sample radiograph under investigation s(x,y), a distance measure is required. Resulting from its mathematical simplicity, the Euclidean distance h
h
∑∑ (r ( x, y) − s( x, y))2
DE =
(1)
x =1 y =1
is frequently applied to accomplish such a task. However, DE is affected by differences in the general illumination of the images to be compared. In other words, the Euclidean distance becomes large if the x-ray dose is changed but the object imaged and the imaging geometry is maintained during the acquisition of r and s. Therefore, the empirical correlation coefficient which is also referred to as normalized cross correlation coefficient or cross covariance coefficient h
h
∑∑ (r ( x, y) − r )(s( x, y) − s ) DV =
x =1 y =1
h h h h ( ( r ( x , y ) − r )2 ⋅ s ( x , y ) − s )2 x =1 y =1 x =1 y =1
∑∑
(2)
∑∑
is applied, where r and s denotes the mean of r and s, respectively. In order to compensate translations within the radiographs, the maximum of the covariance function D F (k , l ) is determined
D F = max m , n ≤d
x =1 y =1 h h h h 2 2 (r ( x − m, y − n) − r ) ⋅ (s( x, y ) − s ) x =1 y =1 = 1 = 1 x y h
h
∑∑ (r ( x − m, y − n) − r )(s( x, y) − s )
∑∑
(3)
∑∑
where m and n denote the integer shift between the feature images r and s. The integer d denotes the maximal displacement. It is made linear dependent on the size h of the feature images. 1 h d = ⋅ 4 2
(4)
Note that (2) results from (3) for the special case of d = 0. Hence, D F ≡ DV if h < 8. Although shifts in x and y directions are handled in (3), other global transformations such as scaling, rotation, or axis deformation may occur in chest radiographs. In 1993, Simard et al. [10] proposed an invariant distance measure called tangent distance (DT): A transformation of an image (e.g. scaling and rotation) typically leads to non-linear, difficult to handle changes in pattern space. For small transforms, these changes can be effectively approximated by a linear subspace, which is the tangent subspace to the set of transformed patterns. The tangent distance is then defined as the minimum distance between the tangent subspaces of reference and observation. This distance can be computed efficiently and is invariant with respect to small amounts of the transformations considered. Simard et al. proved DT to be especially effective for the task of handwritten character recognition [10]. In addition, it has been shown in a previous study that DT outperforms many other techniques when applied to the classification of radiographs. Optimal results were obtained when the tangent distance was combined with an image distortion model that compensates local image alterations, e.g., caused by noise, pathologies, varying collimator fields, or changing positions of the scribor in a radiograph [11]. Hence, we also applied DT to distinguish PA/AP and lateral views of chest radiographs in this study. 2.4. Classification Instead of computing the distance to a template obtained from the summation of references, as proposed by Arimura et al. [4], a k-NN classification scheme is used. In other words, DE, DV, DF, or DT is computed to all references, and the class holding the most entities within the k most similar references is chosen. With respect to numerous investigations documented in the literature, we choose a fixed k = 5 and computed the results for k = 1 for the sake of comparison only. 2.5. Simulation of Arimura’s method In order to compare the classification results to the approach of Arimura et al. [4], three PA/AP radiographs representing the classes (a) to (c) mentioned above and two lateral reference images of different chest width were selected as reference (Fig. 1). They were reduced in size applying the method described earlier. This approximates the first processing step in [4], where, however, the 5 templates where obtained from summation of 200, 12, and 18 reference radiographs for the PA/AP, and of 200 images for the lateral view, which then was horizontally flipped to obtain the fifth mask. Note that detailed information on the selection procedure of chest radiographs and their numbers used for template generation as well as scale, rotation, and/or shift registration is not provided in [4]. Therefore, we did not attempt to reproduce the second step of the scheme with further 19 templates generated from altogether 81 original chest radiographs, partially being used already in step one. Instead of, we arbitrarily selected 230 frontal and 200 lateral radiographs for training while the remaining images were used for testing. In a first experiment, 5-NN classification was used directly for the 430 prototypes. In a second experiment, two templates were generated summing the unregistered size-reduced training images of each group. The resulting templates are visualized in Figure 3. Note the significant blurring of the templates.
(a)
(b)
(c)
(d)
Figure 3: The AP-template was obtained from 230 PA/AP chest radiographs selected randomly from the IRMA database. (a) and (b) represent 64 x 64 and 32 x 32 pixel, respectively. (c) and (d) display the lateral template based on 200 reference images, respectively.
3. RESULTS 3.1. Euclidean Distance Table 1 shows the classification correctness that is obtained using a similarity measure based on the Euklidean distance DE. The overall best correctness is 99.1 % resulting with a feature image of 32 x 32 pixels (1,024 feature values) and the 1-NN classification method. In general, leaving-one-out experiments outperform the other methods. Using a 5-NN classification, the correctness drops slightly but the best template size is only 16 x 16 pixels in size (256 feature values). Referring to only 5 prototypes, 90 % correctness is obtained. The template method that corresponds to the approach from Arimura et al. reaches a correctness of about 97.5 % for the largest template size of 64 x 64 pixel (4,096 feature values). The worst correctness of 76.5 % is obtained with the mean gray value of the radiographs (1 x 1 pixel size or 1 feature value) and 430 prototypes. This indicates a significant difference in the mean gray value of PA/AP and lateral chest radiographs.
size of feature image
leaving-one-out experiments
5 prototypes
430 prototypes
2 templates
1-NN
5-NN
1-NN
1-NN
5-NN
1-NN
64 x 64
99.09 %
98.66 %
90.62 %
98.66 %
98.77 %
97.50 %
32 x 32
99.09 %
98.66 %
90.79 %
98.72 %
98.77 %
97.42 %
16 x 16
98.93 %
98.72 %
90.09 %
98.82 %
98.93 %
96.66 %
8x8
99.04 %
98.66 %
89.56 %
98.61 %
98.82 %
96.24 %
4x4
98.50 %
98.86 %
87.47 %
98.55 %
98.82 %
94.57 %
2x2
93.09 %
94.80 %
92.98 %
92.13 %
94.54 %
91.02 %
1x1
77.83 %
81.41 %
84.52 %
76.49 %
81.90 %
81.56 %
Table 1: Classification correctness based on the Euklidean distance DE
3.2. Correlation Coefficient The usage of the empirical correlation coefficient DV as distance measure was suggested by Arimura et al. [4]. In this case, the overall best performance is 99.4 % and obtained with leaving-one-out experiments, 64 x 64 pixel feature images and the 1-NN classifier. Again, 5-NN is almost as good as 1-NN. It is remarkable that the correctness is significantly improved for the 5 prototypes method, where performance reaches 96.6 % for largest size of feature
images. Since DV is independent of a mean gray value, the worst classification of about 67.8 % is obtained for all methods with 1 x 1 pixel size. Note that this corresponds exactly to the theoretical threshold of this experiment with 601 lateral and 1,266 AP/PA radiographs.
size of
leaving-one-out experiments
feature image
5 prototypes
430 prototypes
2 templates
1-NN
5-NN
1-NN
1-NN
5-NN
1-NN
64 x 64
99.41 %
99.20 %
96.63 %
98.55 %
98.77 %
97.56 %
32 x 32
99.38 %
99.20 %
96.52 %
98.66 %
98.72 %
97.56 %
16 x 16
99.25 %
99.09 %
95.82 %
98.45 %
98.66 %
97.50 %
8x8
99.20 %
99.14 %
95.82 %
98.55 %
98.55 %
97.01 %
4x4
98.61 %
98.39 %
90.31 %
97.16 %
97.00 %
95.27 %
2x2
87.84 %
91.64 %
90.47 %
86.82 %
91.12 %
90.40 %
1x1
67.81 %
67.81 %
67.76 %
67.81 %
67.54 %
72.10 %
Table 2: Classification correctness based on the covariance coefficient DV
3.3. Correlation Function Determining the maximum of the correlation function compensates horizontal and vertical shifts of the thorax position within the chest radiographs. Hence, further improvement is obtained in almost all experiments. Since the displacement is adapted to the size of the reduced image, experiments for smallest image sizes were skipped. The best correctness is 99.6 % using a 5-NN classification scheme based on 32 x 32-sized feature images. Reducing the number of feature components to 64 (feature images of 8 x 8 pixels), the correctness is still 99.3 %. Referring to only 430 prototypes (instead of 1,866 as for the leaving-one-out experiments), still a correctness of about 99 % is obtained for both, 1-NN and 5-NN classification and 32 x 32-sized feature images. Again, the summation of the reference images up to two templates (as suggested by Arimura et al. [4]) for all image sizes is worse than using the prototypes directly for NN classification.
size of
leaving-one-out experiments
5 prototypes
430 prototypes
2 templates
feature image
d
1-NN
5-NN
1-NN
1-NN
5-NN
1-NN
64 x 64
8
99.57 %
99.46 %
96.89 %
98.88 %
98.93 %
97.84 %
32 x 32
4
99.41 %
99.57 %
96.84 %
98.93 %
99.04 %
97.43 %
16 x 16
2
99.52 %
99.25 %
96.79 %
98.66 %
98.93 %
97.56 %
8x8
1
99.25 %
99.25 %
95.45 %
98.61 %
98.39 %
97.56 %
4x4
0
98.61 %
98.39 %
90.31 %
97.16 %
97.00 %
95.27 %
Table 3: Classification correctness based on the maximum of the covariance function DF
3.4. Tangent Distance The tangent distance compensates for small global transformations such as rotation, scaling, shearing, and translations, while the image distortion model compensates for small local transforms like noise or changing scribor positions [11].
Hence, further improvements in accuracy are obtained. The best correctness is 99.68 % for 32 x 32-sized feature images and the 5-NN classifier. Especially for the reduced set of 430 references, the tangent distance DT outperforms the correlation function DF. For instance, a 99.46 % correctness is obtained with 32 x 32-sized feature images and 1-NN classification while that using the covariance function is only 99.04 % (32 x 32 pixels, 5-NN).
size of feature image
leaving-one-out experiments
5 prototypes
430 prototypes
2 templates
1-NN
5-NN
1-NN
1-NN
5-NN
1-NN
64 x 64
99.57 %
99.62 %
95.02 %
99.46 %
99.25 %
96.45 %
32 x 32
99.63 %
99.68 %
96.14 %
99.46 %
99.25 %
95.89 %
16 x 16
99.52 %
99.46 %
96.47 %
98.98 %
99.20 %
94.22 %
8x8
98.66 %
98.55 %
95.39 %
98.13 %
97.97 %
91.02 %
4x4
91.11 %
94.06 %
87.63 %
90.36 %
94.86 %
77.24 %
Table 4: Classification correctness based on the tangent distance DT
3.5. Computing times Although the leaving-one-out experiments for large image sizes are quite time consuming, the classification of a single item is reasonably fast for all methods. Referring to a feature image with 16 x 16 pixels, runtimes are about 0.005 s, 0.02 s, 1.7 s, and 2.0 s for DE, DV, DF, and DT, respectively. However, increasing the image size increases the runtime especially for the covariance function-based method, because here, also d is increased. For a 32 x 32-sized template, classification based on DF and DT takes about 22.5 s and 7.0 s, respectively. All time measurements were obtained on a regular Pentium III PC with 1 GHz clock running under Linux. All programs are compiled with gnu c++ 2.95 with standard optimization.
4. DISCUSSION Automatic differentiation between PA/AP and lateral views of chest radiographs is important for several image processing tasks. A recent approach is based on manual selection and combination of radiographs for template generation. We have shown that this task can be fully automated and substantially simplified if the maximum of the normalized correlation function is used directly for classification. Based on 1,867 reference images from the IRMA database, a sufficient precision of 99.3 % is obtained for 8 x 8-sized radiographs using both, 1-NN and 5-NN classification. Applying 32 x 32-sized feature images, the correctness increases to 99.6 % if the 5-NN classifier is employed. While Arimura et al. reported 99.99 % correctness for their two-step procedure based on 24 templates [4], the classification rate using the simplified first step with 5 reference images as template was only 96.8%. However, the addition of instances as proposed by Arimura et al. is suitable to increase the signal to noise ratio only if geometric transforms such as translations or rotations do not occur. Obviously, this assumption does not hold for the chest radiographs in use. Consequently, the quality of classification improves for all experiments and all distance measures when the similarities of an image to be classified is individually computed to all of the references, which otherwise are used to generate the template, and subsequently, the k-NN decision rule is applied. Arimura et al. suggested a 16 x 16 pixel template. Since a 32 x 32-sized feature image was found to be optimal but sufficient accuracy is already obtained using 8 x 8-sized images, this roughly corresponds with the more detailed data analysis presented in this study. Referring to the entire set of 1,866 references, the results obtained with 1-NN and 5-NN classifiers do not differ significantly. However, the 5-NN classifier is slightly superior based on the 430 references subset. This might indicate that the collection of about 2,000 radiographs is representative for clinical routine. While the impact of the covariance function is remarkable with respect to the covariance coefficient, the classification correctness obtained with the tangent
distance further improves the overall results slightly. This might indicate that the compensation of chest position already accounts for most of the affine transformations in chest radiographs and compensation of the remaining affine transformation components and local distortions has only a small additional positive effect. Interestingly, for sizes of 8 x 8 pixels and smaller, the tangent distance leads to less accuracy of the classifier. This is not surprising, as the effective dimensionality of the feature vector is reduced implicitly by the dimensionality of the tangent subspace (e.g., a six-dimensional subspace for affine transformations). If this reduction is large with respect to the image size (e.g.. ratio 6 / (4 x 4) = 37.5 %) important information may be lost while the effect usually is beneficial for larger image sizes (e.g., ratio 6 / (64 x 64) = 0.15 %).
5. CONCLUSION The IRMA framework enables the validation of numerous image processing algorithms on a large dataset [8]. Here, it was employed to evaluate and simplify the method proposed by Arimura et al. [4] for automatic detection of the view position in chest radiographs. Using our approach, the correctness of classification is 99.6 %. However, the approach presented here does not need any manual selection of reference images for template generation. Since the detection of the view position and orientation of radiographs is an important preprocessing step for CAD [2], PACS [12], and CBIR [8], numerous applications might benefit from the simple approach presented here.
ACKNOWLEDGEMENT This work was performed within the project: image retrieval in medical applications (IRMA), which is supported by the German Research Community (Deutsche Forschungsgemeinschaft, DFG) grants Le 1108/4 and Le 1108/6.
REFERENCES Daffner R: Clinical Radiology – The Essentials. Baltimore MD: Williams & Wilkins, 2nd ed. 1999. van Ginneken B, ter Haar Romeny BM, Viergever MA: Computer-aided diagnosis in chest radiography – A survey. IEEE Transactions on Medical Imaging 2001; 20(12): 1228-1241. 3. Harreld MR, Marovic B, Neu S, Valentino DJ: Automatic labeling and orientation of chest CRs using neural networks. Radiology 1999; 213(2): 321 (abstract no. 958). 4. Arimura H, Katsuragawa S, Ishida T, Oda N, Nakata H, Doi K: Performance evaluation of an advanced method for automated identification of view positions of chest radiographs by use of a large database. Proceedings SPIE 2002; 4684: 308-315. 5. Pietka E, Huang HK: Orientation correction for chest images. Journal of Digital Imaging 1992; 5(3): 185-189. 6. Boone JM, Seshagiri S, Steiner RM: Recognition of chest radiograph orientation for picture archiving and communications systems display using neural networks. Journal of Digital Imaging 1992; 5(3): 190-193. 7. Evanoff MG, McNeill KM: Automatically determining the orientation of chest images. Proceedings SPIE 1997; 3035: 299-308. 8. Lehmann TM, Wein B, Dahmen J, Bredno J, Vogelsang F, Kohnen M: Content-based image retrieval in medical applications: A novel multi-step approach. Proceedings SPIE 2000; 3972: 312-320. 9. Güld MO, Wein BB, Keysers D, Thies C, Kohnen M, Schubert H, Lehmann TM: A distributed architecture for content-based image retrieval in medical applications. In: Inesta JM, Mico L (eds): Pattern Recognition in Informations Systems. Proceedings of the 2nd International Workshop on Pattern Recognition in Information Systems. ICEIS Press, Setubal, Portugal, 2002; 299-314. 10. Simard P, Le Cun Y, Denker J: Efficient pattern recognition using a new transformation distance. In: Hanson S, Cowan J, Giles C (eds.): Advances in Neural Information Processing Systems 5, Morgan Kaufmann, 1993; 50-58. 11. Keysers D, Dahmen J, Ney H, Wein BB, Lehmann TM: Statistical framework for model-based image retrieval in medical applications. Journal of Electronic Imaging 2003; 12(1): in press. 12. McNitt-Gray MF, Pietka E, Huang HK: Image preprocessing for a picture archiving and communication system. Investigative Radiology 1992; 27 (7): 529-535. 1. 2.