Automatic Extraction of Process Categories from Process Model Collections Monika Malinova1, Remco Dijkman2, and Jan Mendling1 1
Institute for Information Business, Wirtschaftsuniversität Wien, Austria
{monika.malinova, jan.mendling}@wu.ac.at
2
Eindhoven University of Technology, Eindhoven, The Netherlands.
[email protected]
Abstract. Many organizations build up their business process management activities in an incremental way. As a result, there is no overarching structure defined at the beginning. However, as business process modeling initiatives often yield hundreds to thousands of process models, there is a growing need for such a structure. This challenge calls for a technique to extract process categories from a set of process models automatically which yields an up-to-date view of the structure of a collection of process models. It also provides a means to check whether pre-defined process categories are still reasonable. In this paper, we introduce a technique for automatically extracting process categories from process model collections and test it using a collection from industry. The results demonstrate the usefulness of the technique by revealing issues of the preexisting process categories. In this way, we contribute to the field of process model management and quality assurance. Keywords: clustering, process model collection, process architecture, process category
1
Introduction
Business process management initiatives are confronted with an extensive number of process models, often ranging in thousands of models. A key challenge in handling such a number of models is to define a suitable structure for organizing them and to provide useful techniques for abstracting from individual models to develop an understanding at a higher level of abstraction [1]. A structure for a process model collection is often referred to as process architecture. We define a process architecture as an overview of the processes that exist in an organization as well as the relations between these processes. Typical relations that are covered include input/output and decomposition relationships. The term process category is used to refer to coherent groups of processes that exist in the most abstract model of a process architecture. Defining a process architecture is especially problematic for modeling initiatives that have grown over time without a predefined or outdated structure. But also process
model collections that have been well organized at a certain point in time might have evolved in such a way that the structure has become obsolete. The definition of a process architecture is a problem that relates to the research area of quality management for process model collections. While there are various works that help to verify a single process model [2], to restructure it [3], or to rework labels [4], there is little research on the automatic identification of relationships between multiple process models. The need for such techniques is emphasized by papers on process model refactoring [5, 6]. The works by [1, 7] belong to the few examples that aim to extract decomposition relationships. There is a research gap in this area regarding techniques that help to organize a process model collection in terms of a process architecture. In this paper, we address this research gap by translating the problem of constructing a process architecture into a clustering problem. To this end, we define a technique for extracting process categories from a collection of process models. Our technique builds on the concept of a document vector representation of process models. We use classical K-means clustering on these vectors in order to build process categories. We test the technique using a process model collection from industry. The results demonstrate the usefulness of the technique by revealing quality issues of the preexisting process categories. In this way, we contribute to the field of process model management and quality assurance. Against this background, the remainder of the paper is structured as follows. Section 2 summarizes essential concepts of process architecture and illustrates our research problem. Section 3 defines our technique for process category extraction based on deriving document vectors and clustering them. Section 4 presents and discusses the results of applying our technique to an industry collection of process models. Section 5 states the implications for research and practice before Section 6 concludes the paper.
2
Background
In this section, we discuss the background of our work and formalize the notions of process model collection and process architecture. 2.1
Process Architecture
Process architecture is used by organizations as a means for understanding the organization from a business process perspective [8]. Prior studies have pointed out that many organizations fail to look at their processes as an integrated collection, and rather focus on singular processes [9]. A process architecture is of good help in this regard, as it explicates the relations between the different processes of an organization [10]. Typically, the relations between processes are defined in two directions: input/output and decomposition. Input/output relationships can be defined between processes belonging to the same category [11, 12]. In the simplest case, such a relationship shows that one process provides an output which is used as an input by an-
other one. In the general case, also n:m relationships can occur. Decomposition relationships can be defined between process models at different levels of granularity. Typically, decomposition is defined in a hierarchical way where elements of a process are decomposed into more fine-grained sub-processes [10, 12]. In this line, process architecture can be described as a process model collection that is systematically organized in terms of explicit relations between the processes [10]. A process category refers to an element of the most abstract model, which is the root of the decomposition tree of the process architecture. More precisely, we define a process architecture as follows: Definition 1. Process Architecture. A process architecture is a tuple (P, T, R), in which: P is a set of business processes; T is a set of relationship types; and R: P P T is a set of relations between processes. In a concrete architecture, the set T defines concrete relationship types and their graphical representation (e.g. ArchiMate [13]). The different relations that can be defined between processes partially relate to relationships that are typically described between activities. The control relation defines that the completion of one process triggers the execution of another one. The data flow relation can indicate such a trigger relation as well. The decomposition relation describes that subordinate processes might be required to complete before a superordinate process can complete. This relation is discussed in various works on process modeling, e.g. in [14, 15]. However, the research focus so far has been on how a single activity relates to a sub-process. Some empirical works in this area exist [7, 16]. What is missing at this stage is an appropriate coverage of the overall set of decomposition relations in a process architecture. 2.2
Process Categories
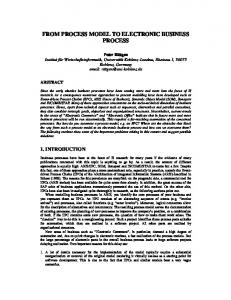
From the perspective of process architecture, the decomposition relation relates a business process to a business process that is a part of it. Figure 1 shows an example where a Sales process relates to a Billing process in a decompositional way. Processes like Sales, Procurement and Human Resource Management in this example can be abstract process categories. Such process categories are typically defined at the top level of a process architecture for structuring the whole organization from a process perspective. The root element of the decomposition graph of a process architecture is often referred to as a process map or process landscape. Throughout this paper, we consider it in an abstract way and define the elements on the level below this root element as process categories. Therefore, the set of process categories in Figure 1 contains the elements Sales, Procurement and HRM. Sales
Offering
Selling
Procurement
Billing
After Sales
Customer Service
Procurement of Services
Procurement of Goods
HRM
Hiring
Firing
Returns
Fig. 1. Decomposition of Processes in a Process Architecture
Payroll
Definition 2. Process Category. Given a process architecture (P, T, R), the set of process categories PC refers to the top-level elements of the decomposition relation such that PC = { p P | (root, p, decomposition) R}. There are various challenges associated with process categories. First, a hierarchical decomposition defines a classification problem. In practice, organizations often establish their process categories based on organizational units. Such a case is apparent in Figure 1 where among others the category Sales has been defined based on the Sales department. A strict decomposition based on such categories often leads to classification problems for more fine-grained processes that are shared between departments. Second, a set of process categories might be appropriate at a certain point in time. However, organizations evolve over time, partially organic, but also disruptively when divisions are sold or outsourced, or when other companies are acquired. Third, many companies build up their BPM activities in an incremental way. As a result, there is no overarching process architecture defined in the beginning. While an increasing number of smaller or bigger sets of models from various projects are stored, there is a growing need for structure. All these challenges call for a technique to extract process categories from the set of process models automatically. Thus, such a technique yields an up-to-date view on the process models. Furthermore, it provides a means to check whether the pre-defined process categories are still reasonable.
3
Conceptual Approach
In this section, we describe our technique for automatically extracting process categories from a collection of process models. Our technique could be applied on process collections with no pre-defined categories. In this study we use a process collection with a pre-existing list of process categories, and aim to check its plausibility.
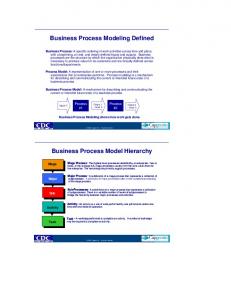
Fig. 2. Technique for extracting process categories
An overview of our technique is shown in Figure 2. As a first step, we apply preprocessing filters on a process model collection, such as the removal of stop words, stemming, etc. Each process model is then mapped to a vector space based on frequency. We apply the K-means clustering method to the set of vectors. Process models are placed in the same cluster if there is a co-occurrence relationship between
them. Each cluster is furthermore defined in terms of themes which stem from their most frequent words [17]. 3.1
Document Vectors of a Business Process
To be able to apply K-means clustering, it is necessary to represent business processes in a vector space. To this end, we will rely on a notion of similarity in the vector space of which task labels encode each business process as a corresponding document vector. Definition 3. Document Vector of a Business Process. Let W be a set of words, P be a set of processes and w(p) = (W, m) be the function that returns the bag of words that appear in a process p P, where W W and m: W . dp = (w1p, w2p, …, wnp) is the document vector of process p P, in which each index i represents a word from the set of all words in the collection {W | (W, m) = w(p), p P} and wip = 1 if w w(p) for the word w represented by i, wip = 0 otherwise.
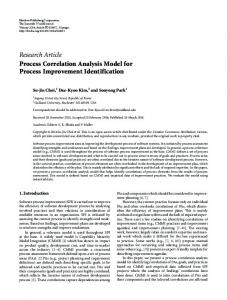
Fig. 3. Vector generation of business process models
In Figure 3 we illustrate the vector generation for business process models. Here we see that the values in each vector encode the word presence and frequency of the words in the respective process model. For example the process model Handle orders has five tasks each consisting of two words. In four tasks the word ‘Order’ occurs, hence this word has the value 4 in the vector space for Handle orders. There are several alternatives for computing the document vectors. Prior work has defined a notion of similarity that takes into account behavioral relations between tasks in a business process and encodes them in a vector space [18]. However, it has been shown that notions that encode behavior have little benefit over notions that work only based on task labels [19]. Furthermore, we investigated different weights. In particular, instead of using the value 1 in a document vector for a word that appears, the term frequency (TF) of the word can be used. The TF can be computed in various ways (e.g.: given w(p) = (W, m), wip = m(w) for a word w W represented by i) [20]. Also, TF divided by the inverse document frequency (IDF) can be used. There are also different options for computing the IDF (e.g.: for a word w the IDF is log |P| / |{p| p P, w w(p)}|) [20]. Another variation that can be applied is that words can be removed from the collection of words that is to be considered. Common preprocessing that is applied to reduce the total number of words is to remove ‘stop words’,
which are frequently occurring words that do not bear any relevant meaning, such as ‘the’ and ‘a’. Also frequently applied is ‘stemming’, which is the action of reducing words to the stem form. For example, stemming would reduce ‘stemming’, ‘stemmed’, and ‘stemmer’ to ‘stem’ [21]. Given the document vectors of a collection of business process models, the clustering method can now be applied. 3.2
Clustering
The K-means clustering method assumes that elements exist in a vector space. It will create K clusters in that space, corresponding to K points that are at the center of each cluster, also called centroids. These clusters are created by determining the centroids in such a way that, if each element is assigned to its closest centroid, the total distance from elements to their centroids is minimal. An algorithm to compute such a clustering is developed by [22]. Definition 4. Clustering. Given a set of p document vectors dp and a number of clusters K, we define clustering as a technique to group similar document vectors together by finding a classification C of dp into K classes {C1, C2, …, CK}. There exists a distance function that evaluates the quality of a clustering, which is minimized. The distance measure between the document vectors that we use is the Euclidean distance, which finds the co-occurrence relationship between process models based on how many words the process models have in common. Definition 5. Euclidean Distance. Euclidean distance of two document vectors d1 ‖ ‖. The smaller the (dissimilarity) value of and d2 is defined as is, the more similar the two document vectors are. We can use the Euclidian distance to define the cluster quality function, which is needed to find the optimal clustering, as follows: Definition 6. Clustering quality. Given a clustering C and a distance function dis: dp dp , the clustering quality is:∑ ∑ For example, in Figure 3, the process models Handle orders and Process orders are placed in cluster 1 because of their similarity. On the other hand, the process model Handle customer calls is placed in cluster 2, as a result of the low co-occurrence relationship with the process models in cluster 1. Accordingly, cluster 1 is characterized in terms of words such as order, check and process, because they appear often in both process models. Cluster 2 covers words like customer and call. The cluster goodness can be additionally evaluated through measuring the purity, entropy and F-Measure [23, 24, 25]. In the case of pre-existing classes of process models, these measures show how representative the derived clusters to the preexisting classes are. Thus, a cluster would be ideal if it contains processes from a single class (purity=1), the distribution of the classes within a given cluster is low
(entropy=0), and it contains processes from one class and processes from one class have been placed in only one cluster (F-Measure=1). Definition 7. Entropy. Given a cluster j and a class i, the entropy of a cluster is ∑ , where L is the number of classes and is the probability that member of cluster j belongs to class i. The total entropy of the clustering is ∑ , where m is the number of data points and K is the number of clusters. Definition 8. Purity. Given a cluster j and a class i, the purity of a cluster is ∑ . The total purity of the clustering is , where m is the number of data points and K is the number of clusters. Definition 9. F-Measure. Given a cluster j and a class i, the F-Measure of a cluster is , where is the recall of class i with respect to cluster j and
is the precision of class i with respect to cluster j. The total F-
measure for the entire data set of size p is given by
4
∑
.
Evaluation
In this section we test our technique on the SAP process model collection. To begin with, we describe the preprocessing filters we apply to the data. Then we present the results of the process clusters we extracted comparing to the pre-existing classes. 4.1
Experiment Input
We use the SAP process collection consisting of 604 process models grouped in 29 process categories as shown in Table 1. Each SAP process category corresponds to a functional block of the SAP system and consists of those business process models this block is dedicated to. We disregard duplicate process models within one SAP process category, but leave those that have the same label but belong to different categories. Hence, we apply the clustering method to the remaining 453 SAP process models. 4.2
Data Preprocessing
Before we start with the clustering method, we first preprocess the data and map each process model to a vector space. We apply several transformations on the vector representation. First, we remove the stop words. Second, we use a stemmer in order to map words with different endings into a single word. Third, we discard words that appear with less than a given threshold frequency because they make little contribution to the similarity between two process models [26]. We select words ranked by their weights of appearing at least 10 times. The most frequent words are however not necessarily the most important ones. Words which appear frequently in a small number of process models, but rarely in the other, tend to be more relevant and specific for that particular group of process models. Thus, we transform the basic term fre-
quencies TF and TF-IDF weighting scheme and we use the TF-IDF value instead of the absolute term frequency of each term to build the vector for each process model. We normalize the process models on their length, as to avoid giving advantages to larger process models over smaller ones. The rationale behind this is that words in large process models will appear more frequently which will lead to these being ranked above smaller ones. We also make sure that the maximum number of words and the minimum term frequency is not enforced on a per-class basis, but based on the process models in all the categories. As a result of the data preprocessing, the initial set of 2351 words was reduced to 422. Finally, clustering is performed by measuring the distance between the vectors. 4.3
Clustering
We apply K-means clustering to the SAP process collection with its 29 pre-existing process categories. In case that the categories perfectly reflect the words and themes, the clustering would be expected to output 29 clusters with purity of 1,entropy of 0 and F-Measure of 1. In this case, each cluster should contain process models from one single SAP process category, and processes from one SAP process category are placed in only one cluster. For this reason we set K to be 29. 4.4
Results and Discussion
Clustering in general is not straightforward to evaluate, especially when a large set of data has been used. However, based on Table 1 and Table 2 we are able to derive some insights into the benefits the clustering solution brings when used to organize a large set of process models. Table 1 summarizes the clustering of the SAP process models and shows the values for the entropy, purity and F-Measure. The total entropy measure for all 29 clusters (E=1.98) shows that processes from one category have been dispersed to several clusters. On the other hand, the total purity measure (P=0.49) tells us that in average all clusters contain almost 50% processes coming from the same category. Whereas the total F-Measure (F=0.21) specifies that in average 21% of the retrieved relevant processes within one cluster are in fact relevant. We use color scaling to highlight the dominance of an SAP process category in each cluster. The darker the shade the more dominant the process category in the respective cluster, whereas the brighter the shade the less processes from that category have been placed in that particular cluster. Therefore, when we look at each cluster individually, we derive somewhat different and more revealing insights than the overall clustering quality values. Based on Table 1 and the quality measures, we can essentially distinguish between three types of clusters. The first type (several categories – one cluster) typically have high values for entropy, while low values for purity and F-Measure (e.g. clusters 7, 8, 9, 10, 12, 18, 19, etc). Accordingly, these clusters contain processes from different process categories. The second type (one category – several clusters) has entropy of 0 and purity of 1 (e.g. clusters 11, 15, 16, 27 and 29) indicating that in these clusters processes from a single category have been stored.
Yet, for all these clusters the F-Measure is low, which assesses the tradeoff of recall and precision. Hence, whereas processes from a single category have been placed in these clusters, also other clusters contain processes from the same category. Lastly, the third type (one category - one cluster) is when all process models from one SAP process category have been placed in only one cluster (e.g. Cluster 3). According to the cluster quality measures, this cluster is ideal because it has entropy of 1, purity of 0 and F-Measure of 1. Cluster
SAP Process Category (number of processes)
Financial Accounting (53) Sales and Distrib. (36) Project Mngm (34) Asset Accounting (32) Customer Service (25) Treasury (24) Procurement (20) Reven.&Cost Control. (19) Enterprise Controlling (19) Quality Management (18) Compensation Mngm (17) Production (16) Plant Maintenance (32) Envir. Health and Saf. (15) Produc.&Procur.Plan. (14) Train.&Event Mngm (12) Personnel Time Mngm (11) Personnel Develop. (10) Recruitment (9) Payroll (7) Benefits Admin. (6) Real Estate Mngm (6) Organizational Mngm (5) Personnel Admin. (4) Invent. Mngm&Transp. (3) Product Data Mngm (3) Travel Management (1) Retail (1) null (1)
1 2 3 4 5 6 7 8 9 10 11 12 1 12 12 1 12 1 1 2 9 1 9 9 8 1 2 8 3 8 1 1 3 2 2 6 3 16 1 8 3 1 2 3 1 13 8 12 11 10 8 1 7 2 4 3 1 1 4 4 3 3 1 1 1 2 12 4
13 14 15 16 17 18 19 20 21 22 23 3 3 2 1 2 1 2 13 1 3 6 4 1 1 1 5 2
2
4 2
2 3 1 2
12
3 14 17 27 43 20 9 98 9 15 3
24 25 26 27 28 29 7 1 10 8 2 1 4 1 2 3 3 13 9 2 1 10 4 2
5 1 8 1 6
1 1
Total in cluster
2
Entropyj (E=1,98)
1,0 1,0 0,0 0,8 1,6 0,6 2,2 2,0 2,1 2,3 0,0 3,8 1,5 0,9 0,0 0,0 0,9 1,5 2,4 1,4 1,4 0,7 2,1 1,6 0,8 1,2 0,0 1,9 0,0
6
3
4 32 15 8 11 9 12 13 12 13 19 1
Purityi (P=0,49) F-Measure ij (F=0,21)
0,5 0,5 1,0 0,8 0,3 0,9 0,5 0,4 0,4 0,4 1,0 0,1 0,4 0,8 1,0 1,0 0,7 0,5 0,4 0,5 0,5 0,8 0,4 0,6 0,8 0,7 1,0 0,5 1,0 0,1 0,1 1,0 0,9 0,1 0,4 0,5 0,3 0,5 0,6 0,4 0,2 0,3 0,7 0,2 0,3 0,1 0,2 0,4 0,3 0,2 0,6 0,3 0,2 0,4 0,3 0,7 0,5 0,1
Table 1. Clusters
Nonetheless we find that the underlying reason for such process distribution amongst the clusters occur because each resultant cluster consists of those processes that relate to one theme [26]. Table 2 illustrates each cluster theme and its most frequent words. Table 1 and Table 2 indeed show a different, yet meaningful categorization of the SAP process models. For example, in the first type of clusters (several categories – one cluster) although the processes come from different SAP categories, they do in fact deal with the same theme. Such as, in Cluster 8, (C8): Manage accounts and payment, all process models that relate to accounts and payment have been stored (e.g. process models coming from SAP Financial Accounting, SAP Payroll, etc). As a result, all process models being placed in C8 will in turn be used by all these SAP functional areas. On the other hand, clusters from the second type (one
category – several clusters) suggest that one SAP category holds processes that deal with different aspects of the same or similar entity. Accordingly, these processes have been spread out to more clusters, each addressing a different aspect of an entity (e.g. C11: Manage assets, C15: Acquire assets, C16: Analyze investments). Lastly, Cluster 3 apparently is not associated with any other cluster, because the most frequent words for this cluster are distinctive and do not appear in the other clusters.
Table 2. Cluster theme and word frequency for each cluster
Based on this, we find that those clusters that contain processes from the same SAP process category are by some means related to each other (e.g. (C11, C15 and C16) or (C6, C8, C12 and C24)). Because, when processes are decomposed based on departments, it is usually not visible how the process models of these units relate to each other. We also observed process redundancies within the same cluster, which was in fact the same process model coming from a different SAP process category. Thus, our clustering solution helps in avoiding process redundancies among the different SAP functional areas.
5
Implications
Our study offers three main implications for research and practice, namely the quality check of pre-existing process categories, process category extraction from a process model collection, and naming activities in process models. First of all, by clustering process models from a process model collection we yield an up-to-date view of the structure of a collection of process models. Accordingly we evaluate the plausibility of pre-existing process categories. Our findings show that categorizing processes based on organizational units is not such a good criterion. In fact, due to the unclear relations between the process models belonging to different organizational units, this type of classification yields process redundancies. Yet, when the process models are categorized according to themes, an organizational unit eventually (depending on the value that needs to be created) uses processes that belong to
different themes and are necessary for the value-creation. This would help increase the correlation between the process categories and in turn cause process reuse among departments. In addition, this will assist organizations use a single process for more purposes, instead of using one process for a single purpose within one department. We also identify the significance of assigning meaningful labels to process model activities. This is because useful information should be deduced from the process activity names in order for them to be correctly clustered. Accordingly, process activities should be appropriately labeled. Each activity label should relate to one entity and the different aspects associated with this entity.
6
Conclusions
In this paper we presented a technique for extracting process categories from process model collections. We applied this technique to a process model collection from industry with pre-existing process categories. This enabled us to gain insights into the quality of the pre-defined categories and the usefulness of the technique. When applying the technique to the process model collection, we revealed several quality issues with the pre-existing process categories, thus demonstrating the usefulness of the technique. We find that a strict decomposition of processes based on organizational units often leads to classification problems for processes on more detailed levels that are shared between departments. Rather, categorizing process models according to themes, where process models that pertain to the same theme belong to the same category, causes process reuse among organizational units. We prove that categorization based on themes does indeed reflect processes and process dependencies in industry. In future work we will complement this study by adapting our technique by using various clustering methods in order to extract process categories from a process model collection with no pre-existing categories. We will also focus on positioning the extracted process categories in a process architecture and validating the process architecture with the respective organization.
References 1. Smirnov, S., Reijers, H. A., Weske, M. Nugteren, T.: Business process model abstraction: a definition, catalog, and survey. Distributed and Parallel Databases. 3, 63-99 (2012) 2. van Dongen, B. F. Mendling, J., van der Aalst, W. M.: Structural patterns for soundness of business process models. Enterprise Distributed Object Somputing Conference (2006) 3. Polyvyanyy, A., García-Bañuelos, L., Dumas, M.: Structuring acyclic process models. Business Process Management. 276-293 (2010) 4. Leopold, H., Smirnov, S., Mendling, J.: On the refactoring of activity labels in business process models. Information Systems (2012) 5. La Rosa, M., Wohed, P., Mendling, J., ter Hofstede, A., Reijers H. A., van der Aalst, W. M.: Managing Process Model Coplexity via Abstact Syntax Modifications. IEEE Transactions on Industrial Informatics. 7-4. 614-629 (2011) 6. Weber, B., Reichert, M., Mendling, J., Reijers, H. A.: Refactoring large process model repositories. Computers in Industry. 5-62,. 467-486. (2011)
7. Reijers, H. A., Mendling, J., Dijkman, R. M.: Human and automatic modularizations of process models to enhance their comprehension. Information Systems. 5-36. 881-897 (2011) 8. Pritchard, J. P., Armistead, C.: Business Process Management - lessons from European business. Business Process Management Journal (BPMJ). 1-5. 10-35 (1999) 9. Armistead, C.: Principles of business process management. Emerald Management Reviews. 6-6. 48-52 (1996) 10. Malinova, M., Leopold, H., Mendling, J.: An Empirical Investigation on the Design of Process Architectures. Wirtschaftsinformatik, Leipzig, Germany (2013) 11. Dijkman, R. M., Vanderfeesten, I., Reijers, H. A.: The Road to a Business Process Architecture: An Overview of Approaches and their Use. Einhoven University of Technology, The Nederlands (2011) 12. Dumas, M., La Rosa, M., Mendling, J., Reijers, H. A.: Fundamentals of Business Process Management, Berlin Heidelberg: Springer. 42-43 (2013) 13. Lankhorst, M.: Enterprise architecture at work: Modelling, communication and analysis, Springer. (2009) 14. Davis, R.: Business Process Modelling with ARIS: A Practical Guide. Springer-Verlag. London, UK (2001) 15. Mendling, J.: Metrics for process models: empirical foundations of verification, error prediction, and guidelines for correctness. 6. Springer (2008) 16. Smirnov, S., Reijers, H. A., Weske, M.: From fine-grained to abstract process models: A semantic approach. Information Systems 8-37. 784-797 (2012) 17. Kim, S., Wilbur, J. W.: Thematic clustering of text documents using an EM-based approach. Journal of Biomedical Semantics. 3 (2012) 18. van Dongen, B., Dijkman, R. M., Mendling, J.: Measuring Similarity between Business Process Models. Proceedings of the 20th International conference on Advanced Information Systems Engineering. Montpellier, France (2008) 19. Dijkman, R. M., Dumas, M., van Dongen, B., Käärik, R., Mendling, J.: Similarity of Business Process Models: Metrics and Evaluation. Information Systems. 2. 498-516 (2011) 20. Wu, H. C., Luk, R. W. P., Wong, K. F., Kwok, K. L.: Interpreting tf-idf term weights as making relevance decisions. ACM Transactions on Information Systems (2008) 21. Porter, M.: An algorithm for suffix stripping. 130-137 (1980) 22. Lloyd, S. P.: Least squares quantization in PCM. IEEE Transactions on Information Theory. 2-28 (1982) 23. Wu, J., Xiong, H., Chen, J.: Adapting the right measures for k-means clustering. Proceedings of the 15th ACM SIGKDD international conference on Knowledge discovery and data mining. 2009. 24. Xiong, H., Wu, J., Chen, J.: K-means clustering versus validation measures: a datadistribution perspective. Systems, Man, and Cybernetics, Part B: Cybernetics. IEEE Transactions (2009) 25. Huang, A.: Similarity measures for text document clustering. Proceedings of the Sixth New Zealand Computer Science Research Student Conference (NZCSRSC2008), Christchurch, New Zealand. 49-56 (2008) 26. Huang, A., Milne, D., Frank, E., Witten, I. H.: Clustering Documents using a Wikipediabased Concept Representation. Advances in Knowledge Discovery and Data Mining, Bangkok, Thailand (2009) 27. Eid-Sabbagh, R.-H., Dijkman, R. M., Weske, M.: Business Process Architecture: Use and Correctness. Business Process Management. Tallinn, Estonia (2012) 28. Huang, Y. J., Powers, R., Montelione, G. T.: Protein NMR recall, precision, and Fmeasure scores (RPF scores): structure quality assessment measures based on information retrieval statistics. Journal of the American Chemical Society. 127. 1665-1674 (2005)