Automatic Generation and Maintenance of Correct Spreadsheets ?
Martin Erwig
Robin Abraham
School of EECS Oregon State University
School of EECS Oregon State University
[email protected]
[email protected]
Irene Cooperstein†
Steve Kollmansberger
Department of CS University of Houston
School of EECS Oregon State University
[email protected]
[email protected]
ABSTRACT
1.
Existing spreadsheet systems allow users to change cells arbitrarily, which is a major source of spreadsheet errors. We propose a system that prevents errors in spreadsheets by restricting spreadsheet updates to only those that are logically and technically correct. The system is based on the concept of templates that describe the principal structure of the initial spreadsheet and all of its future versions. We have developed a program generator that translates a template into an initial spreadsheet together with customized update operations for changing cells and inserting/deleting rows and columns for this particular template. We have designed a type system for templates that ensures the following form of “spreadsheet maintenance safety”: Update operations that are generated from a type-correct template are proved to transform the spreadsheet only according to the template and to never produce any omission, reference, or type errors. Finally, we have developed a prototype as an extension to Excel, which has been shown by a preliminary usability study to be well accepted by end users.
Of all end-user programming applications, spreadsheets are without a doubt the most widely used. Estimates show that hundreds of millions of spreadsheets are created for professional use each year [14], yet in spite of their popularity, spreadsheets also display their share of problems: Research shows that spreadsheets contain errors at alarmingly high rates [5, 12]. Some studies even report that 90% or more of real-world spreadsheets contain errors [17]. Clearly, the problem of spreadsheet reliability is of great importance to the professional world. The question of how to improve spreadsheet reliability has been approached in several different ways. The default method provided by Excel revolves around a debugging approach. Excel automatically detects errors which render computation impossible, such as circular references or divide-by-zero errors. It then flags these errors and leaves the user to debug them using a selection of functions provided by the audit toolbar. However, while Excel points out some computational errors, it cannot accurately detect less obvious errors which may yield a computable value, but still be semantically incorrect. Another method of ensuring reliability is to encourage extensive testing of spreadsheets. Rothermel et al. have developed the “What You See Is What You Test” methodology for spreadsheet testing, which encourages users to examine the entire spreadsheet cell by cell [18]. By providing visual feedback as to which cells have been tested, this methodology is intended to promote thorough testing under the assumption that users will, when prompted, be able to look at a cell and determine if it contains a correctly computed value or not. To support this approach, the authors have also investigated systems for automatically generating test values [11] and for propagating user-supplied assertions through spreadsheets [6].
Categories and subject descriptors: D.2.2 [Software Engineering]: Design Tools and Techniques; D.2.7 [Software Engineering]: Distribution, Maintenance, and Enhancement; H.4.1 [Information Systems Applications]: Office Automation—spreadsheets General terms: Languages, Reliability Key words: Spreadsheet, Template, Program generation, Error prevention, Type system, End-user software engineering
Permission to make digital or hard copies of all or part of this work for personal or classroom use is granted without fee provided that copies are not made or distributed for profit or commercial advantage and that copies bear this notice and the full citation on the first page. To copy otherwise, to republish, to post on servers or to redistribute to lists, requires prior specific permission and/or a fee. ICSE’05, May 15–21, 2005, St. Louis, Missouri, USA. Copyright 2005 ACM 1-58113-963-2/05/0005 ...$5.00.
INTRODUCTION
∗ This work is partially supported by the National Science Foundation under the grant ITR-0325273 and by the EUSES Consortium (http://EUSESconsortium.org). † Work of Irene Cooperstein performed at Oregon State University during summer 2004 as part of the CRA-W Distributed Mentor Project.
However, these approaches suffer from two drawbacks. First of all, they are time consuming. The effort to manually check every1 formula in a spreadsheet is not trivial. Second, these testing procedures must be repeated every time a change is made to the spreadsheet to ensure its continuing correctness. This software-maintenance issue is especially important as spreadsheets are rarely viewed as static entities, but are instead edited and manipulated frequently in the course of their use. Although there is abundant evidence that professional spreadsheets contain errors at a high rate, research also shows that surprisingly few companies have adequate guidelines for spreadsheet development, and even fewer actually follow those guidelines meticulously [13]. This suggests that testing methodologies would probably not be employed frequently enough to be effective in preventing errors. Any approach to designing a system to reduce errors, then, would be more effective if integrated into the most basic steps of designing and updating a spreadsheet, rather than requiring the user to spend additional time performing a detailed audit. Therefore, we propose another method of ensuring spreadsheet correctness focusing not on error detection, but on error prevention. The idea we will pursue in this paper is to specify the possible evolutions of a spreadsheet in advance and to create customized update operations for any such specification. The benefit of this approach is that users can still apply update operations to their spreadsheets (such as row/column insertions or deletions), but only those that keep the spreadsheet within the specified evolution and do not introduce any reference, type, or omission errors. Our goal is to create an environment in which update operations can be guaranteed to always result in a correct spreadsheet. In such an environment, formulas need only be audited once, at its initial creation, thus reducing the maintenance work greatly because the potential sources of errors can be reduced to data entry mistakes. We have implemented this system as an extension of Excel. Our prototype, dubbed Gencel, takes an initial template and translates it into an Excel spreadsheet together with customized update operations that safely expand the spreadsheet according to the template as needed. In particular, Gencel eliminates the following kinds of errors from spreadsheets. • Omission errors (omitted cells in aggregations) • Reference errors (undefined/wrong references) • Type errors (operands have illegal types) The impact of these errors has been extensively documented. For example, an omission error has caused a Florida construction company to underbid a project by a quarter of a million dollars [8]. An example of a type error is the illegal interpretation of a date as a numeric value, which caused an operating fund of the Colorado Student Loan 1 Part of this problem can be addressed by the concept of “regions”, which are blocks of cells containing identical formulas: A region can be validated with a single test [7]. This approach relies on the presence of contiguous blocks of identical formulas. However, complex spreadsheets may not be adequately represented by this model, as in the case where a “region” consists of several cells of formulas which together compose a repeating group.
Program to be understated by $36,131 [19]. Finally, a reference error caused a hospital’s records to overstate its Medicaid/Medicare crossover log by $38,240 [20]. The use of Gencel would have prevented all these errors. In addition to these formal results, a pilot usability study has indicated that Gencel would be well accepted by end users and presents only a moderate learning curve. In this paper, we will describe this system of spreadsheet specifications and explain how automatically customized update operations preserve the structure and correctness of a given spreadsheet. In Section 2, we illustrate the idea of using program generation to support the creation of safely evolvable spreadsheets. In Section 3, we will briefly define the table evolution calculus that forms the formal foundation of our Gencel system. A type system for the calculus is developed in Section 4 to guarantee that well-typed templates will be transformed into customized spreadsheets that can only evolve without errors. Section 5 describes our implementation of the Gencel system as an extension of Excel and reports results of a pilot user study. Finally, related work is outlined in Section 6, and conclusions and plans for future work are given in Section 7.
2.
SPREADSHEET GENERATION FROM TEMPLATES
Given a spreadsheet, there are an infinite number of possible update operations that could be applied to it. However, only a small set of these updates are reasonable. The decision as to whether a particular update should be allowed or prohibited depends on the roles of the affected cells in the spreadsheet’s tables. The cells of a table can be distinguished according to their content into header, data, and computation cells. Moreover, some rows or columns of a table are fixed, like header and footer rows and columns, while other rows and columns are duplicated if new data is to be added. The specification language that is part of our Gencel system reflects this view and offers constructs to define a table as a horizontal sequence of fixed and extensible columns where a column is constructed as a vertical sequence of fixed and extensible blocks, which are rectangular collections of cells containing values and formulas. These specifications, called templates, are translated into initial spreadsheets together with tailor-made versions of update operations performing the tasks of insertion (or deletion), copying and pasting, and updating existing formulas in such a way that the spreadsheet correctness is always preserved. In this section templates will be given in a visual notation called Vitsl (visual template specification language). A corresponding textual representation will be presented in Section 3 where we introduce the table evolution calculus. Our first example is the specification of a plain column of numbers with a header at the top and a summation formula at the bottom. This table template can be specified by the Vitsl expression shown below. The template consists of three elements: the header containing the label, the footer containing the summation formula, and a vertically expandable group (also called vex group for short) that consists of a single cell containing the value 0. The argument of the summation formula, u, is a relative reference to the vex group above it.
Values 0
.. .
Σ(u) In a user interface to edit these templates, which is described in [2], we actually use row/column references as known from Excel. However, for the technical discussion it is convenient to have references represented in a textual form. This template describes a class of tables that all consist of one column with the shown header and footer and that have one or more number cells in between. In general, Vitsl offers the following visual elements for templates: • Cells, represented by rectangles that contain values and formulas. • References, represented by names for relative grid offsets. • Vex groups, represented by vertical dots that indicate the possible expansion of one or more cells in the vertical direction. • Hex groups, represented by horizontal dots that indicate the possible expansion of one or more columns in the horizontal direction. An example of a horizontally expandable group (hex group) is given in the summation table shown below. Values
···
Total
0
.. .
Σ(`) .. .
Σ(u)
Σ(u)
Here the summation column is horizontally expandable and is horizontally joined by a column that also contains a header and a summation footer, but whose vex group contains a summation formula whose argument `, which means “left”, references the number cell of the hex group. The hex group illustrates that expandable groups may consist of groups of cells and not just single cells. Moreover, one column can also contain multiple vex groups. An example for a template containing multiple vex groups is the accounting sheet shown below. Income 0
.. .
Σ(u) Expenses 0
.. .
Σ(u) Net Earnings
∆(u5 , u2 )
The gaps between cells indicate the scope of the vertical dots. For example, the first vex group is the repeated 0 and not the block of the top two cells. The formula ∆(u5 , u2 ) computes the difference between the two summation cells (u2 means “two cells up”, etc.). Finally, a table can contain multiple hex groups. However, vex groups and hex groups cannot be arbitrarily nested. The only possible nesting is that hex groups may contain vex groups, but not the other way around. In addition, a couple of structural constraints are needed to ensure that a reasonable definition for the spreadsheet update operations exists. For example, all columns in a table have to align vertically. To explain the idea of alignment, consider a column as a sequence of fixed and expandable blocks (cell groups), say c = [b1 , . . . , bk ]. Now c aligns with another column c0 = [b01 , . . . , b0k ] only if (1) bi has the same height as b0i and (2) bi is an expandable group iff b0i is. This constraint ensures that vex groups are horizontally aligned, which allows the insert-row command to be defined to insert a number of rows according to the common height of the vex groups. Similarly, we require that all blocks in a column have the same width. For columns in hex groups, this constraint ensures that the insert-column command can be defined to create a number of columns according to the common width of the blocks of the hex group. As a final example we present a template for a multi-year budgeting sheet that contains a multi-cell vex group. ···
2005 Category
.. . Total
Qnty 0
Cost
Total
0
2
.. .
Π(` , `) Σ(u)
Total Qnty
Cost
3
Σ(` )
.. .
Σ(`2 ) Σ(u)
The relative references used in templates are very expressive: First, unlike absolute addresses, relative references are compositional. That is, they need not be adjusted when cells or blocks are composed with other blocks. Second, depending on their origin and target, relative references can express single-cell addresses as well as ranges. For example, the u references in the summation formulas in the table above point into a vex group and refer to all the cells that will be generated within that group. In contrast, the references `2 and ` in the Π formulas point to nonexpandable cells and refer always to single values. Additionally, the budget template with its multi-cell vex group illustrates another powerful feature of our model that goes beyond Excel’s capabilities—the possibility of nonconsecutive ranges. Consider, for example, the rightmost summation formula Σ(`2 ). The relative reference refers to the cell containing the Π formula, which represents a product. The repeated application of insert-column commands generates several non-adjacent instances of that cell. Nevertheless, the update operations created by the Gencel system will properly update the rightmost summation formula to always contain references to exactly all those cells (see Figure 2). The same is true for the Qnty summation formula. The initial spreadsheet generated from the budget template is shown in Figure 1. Note the toolbar on the righthand side of the screenshot. This is the user interface for the customized update functions.
` ` = `2 = (−2, 0). The syntax of templates is summarized in Figure 3. f b c t
∈ ∈ ∈ ∈
Fml Block Col Template
::= ::= ::= ::=
φ | ρ | φ(f, . . . , f ) f | b | b | bˆb b | b↓ | cˆc c | c→ | t | t
(formulas) (blocks, tables) (columns) (templates)
Figure 3: Template Syntax.
Figure 1: Generated Gencel spreadsheet.
After one column and two row insertions and several changes to the stored values, the spreadsheet might look as shown in Figure 2. Observe how the SUM formulas in the last column contain references that represent a non-consecutive range. The Gencel system offers additional buttons for inserting columns to the left and right of the current position as well as for inserting rows above and below the current row. Note that it is not possible to enter values of wrong types or to change or delete existing formulas. For illustration we show here the formula view of the generated spreadsheet. End users will generally only see the computed values. The spreadsheet in Figure 2 is created by precisely following the formal definitions of the table calculus. We can optimize the generated formulas further by compressing ranges, which yields, for example, SUM(D3:D5) in cell D6.
3.
THE TABLE EVOLUTION CALCULUS
The table evolution calculus provides a formal foundation for the Gencel system. In Section 3.1 we will define its syntax. In Section 3.2 we describe the translation of templates into tables. The semantics of table update operations relative to a template is given in Section 3.3, and the evaluation of tables is defined in Section 3.4. A more detailed description can be found in [9].
3.1
Syntax
A template t is given by a horizontal composition (|) of fixed (c) or expandable (c→ ) columns, where a column is given by a vertical composition (ˆ) of fixed (b) or expandable (b↓ ) blocks. A block is given by a composition of formulas (f ). Blocks are also used to represent plain tables. Formulas consist of basic values (φ), references (ρ), and expressions that are built by applying functions to a varying number of arguments given by formulas (φ(f, . . . , f )). In this simple version of the table calculus we only use functions that can be applied to an arbitrary number of arguments of the same type, like addition (Σ) and multiplication (Π). This restriction simplifies the semantics of formulas and the type system a bit, but is not essential. References are given by pairs of integers and represent relative references in the form of offsets. We use the following abbreviations for cell offsets: ` = (−1, 0), r = (1, 0), u = (0, −1), and d = (0, 1). We sometimes use sequences of abbreviated offsets to represent larger offsets, for example,
The constructs correspond directly to the visual notation. Whenever we want to talk about an arbitrary repeating group, that is, either a vex or a hex group, we also use the notation b+ . We also define that ˆ and | associate to the left. In the following we use the metavariables u and v to range over Template, Col, and Block, which allows us to give some definitions more concisely. As an example, consider the summation column, which was shown as the first Vitsl example in Section 2. This column is represented by the following template. ↓
Valuesˆ0 ˆΣ(u)
We refer to this expression as SumCol in the following. The summation table is represented by the following expression, which we name SumTab. (Valuesˆ0↓ ˆΣ(u))→ | TotalˆΣ(`)↓ ˆΣ(u) To support the semantics definition, we introduce the concept of template instance as a generalization of template. The syntax of template instances is identical to the syntax of templates given in Figure 3, except that b↓ and c→ are | replaced by b k and ck , respectively, where k represents the number of times b or c has been expanded. We use the metavariable t to range over template instances. Similar to repeating groups in templates, we use the abbreviation uk to represent an arbitrary vex or hex group in a template instance. A column c (from a template) of width w that is expanded k times in a template instance corresponds in the generated table to kw columns. This whole area in the table is called c’s expansion area, and k is called c’s repetition. Likewise, a block b of height h that is expanded k times corresponds in the generated table to a rectangular area of height kh. We summarize all structures/concepts and their distinguishing characteristics explicitly in Table 1 for easy future reference. Structure/Concept template (t) template instance (t) table (= block ) (b) repetition (k) expansion area (b)
contains ... ˆ, |, u↓ , u→ , and u+ | ˆ, |, u k , uk , and uk ˆ and | | exponent in u k , uk , or uk subpart of a table
Table 1: Auxiliary Structures
3.2
Generating Table Instances and Tables
The function I produces the initial template instance from a template by simply replacing each “→” or “↓” exponent by → a “1” exponent. The functions ← u and lu compute the width
Figure 2: Updated Excel budget spreadsheet.
and height of a table (column, block) u as follows. For for← → mulas we define f = lf = 1. For horizontal composition ←→ ← → we have u | v = → u +← v and lu | v = max(lu, lv), whereas ←→ → → for vertical composition we have uˆv = max(← u ,← v ) and luˆv = lu + lv. For repeating groups in templates we ← → → have u+ = ← u and lu+ = lu, whereas for vex (hex) groups ← → | | → in template instances we define u k = ← u and lu k = klu ← → → u and luk = lu).2 ( uk = k ← The following function locates cells in templates and tables based on absolute references. f [1, 1]
=f → u[i, j] if i ≤ ← u (u | v)[i, j] = ← → v[i − u , j] otherwise u[i, j] if j ≤ lu (uˆv)[i, j] = v[i, j − lu] otherwise u+ [ρ] = u[ρ] b[x, ((y − 1) mod lb) + 1] if y ≤ klb |k b [x, y] = ⊥ otherwise → → c[((x − 1) mod ← c ) + 1, y] if x ≤ k← c k c [x, y] = ⊥ otherwise The last case allows applications of the lookup function to work on templates. In Section 4 we will use the function also on template types. Next we define the function G for generating a table from a template. In fact, we define a slightly more general function that works on template instances and that can be reused in the definition of the update operations. In the initial template instance all → and ↓ exponents are replaced by ones. Then each application of an insert-column command to a hex group increases its exponent by one, whereas each application of an insert-row command increases the exponents of all vex groups in one line by one. A template instance contains sufficient information to (re)generate all formulas with all correct references for the corresponding table. This fact is exploited in the definition of the update operations, which essentially create an updated template instance and derive the changed formulas from the new instance. 2 Since we will reuse these auxiliary functions in the definition of the type system, we define them more generally for arbitrary templates and template instances, and not just for blocks.
The translation function G defined in Figure 4 takes as input the position of the top-left corner of the part currently being translated (x, y), which is needed for the proper translation of references (third line), and the complete template instance (t). The last argument is the part of the template instance that is seen at the current location (x, y). G xy (t, φ) =φ G xy (t, φ(f1 , . . . , fn )) = φ(G xy (t, f1 ), . . . , G xy (t, fn )) G xy (t, (i, j)) = Rxy (t, i, j) ← → u (t, v) G xy (t, u | v) = G xy (t, u) | G x+ y x x x G y (t, uˆv) = G y (t, u)ˆG y+lu (t, v) → ← → x+(k−1)← c c G xy (t, ck ) = G xy (t, c) | G x+ (t, c) | . . . | G y (t, c) y | G xy (t, b k ) = G xy (t, b)ˆG xy+lb (t, b)ˆ . . . ˆG xy+(k−1)lb (t, b) Figure 4: Table generation. The translation of relative into absolute references is performed by the function R whose definition is technically involved since it has to consider many different cases. For lack of space we therefore give here an informal explanation of the function and refer for the formal definition to [9]. R takes a template instance t and determines the absolute address or the range of absolute addresses that correspond to the relative reference (i, j) contained in the cell (x, y). First, R determines whether (i, j) points to a cell that is contained in a horizontally and/or vertically repeating group, which is remembered in the flags ξx and ξy (to be reused in Section 4). In that case the reference might denote a horizontal, vertical, or two-dimensional range, but only if the current cell (x, y) that contains the reference (i, j) is not contained in a repeating group that is expanded in parallel with the referenced one. This information can be obtained for the horizontal dimension by checking whether x + i lies outside the horizontal range of a possible repeating group containing (x, y), in which case the cells are expanded independently of one another. In this case the predicate δh (x, y) holds (again, reused in Section 4). Similarly, only if y + j lies outside the vertical range of the group containing the current cell, it is not expanded together with the group containing (i, j), in which case the predicate δv (x, y) holds. Second, if R has to produce a range, the corresponding references are computed by selecting all addresses (x0 , y 0 ) from the complete expansion area containing the referenced
cell (x + i, y + j) whose relative offset from the beginning of its corresponding instance of a repeating group is the same as the offset of the referenced cell from the first repeating group. Formally, this condition is expressed by requiring x0 mod w = (x + i) mod w and y 0 mod h = (y + j) mod h where w and h are the width and height, respectively, of the repeating group. Figure 2 illustrates this case where the generated range for the summation formula under Qnty consists only of two cells, which both start at the beginning of each repeating-group instance, that is, columns B and E. A similar example is the summation formula under Cost. As an example, consider the template SumCol together | with the instance t = Valuesˆ0 3 ˆΣ(u). Assume we want to find the range of the u parameter in the bottom-most cell. In this case, we apply the function R15 (t, 0, −1) since the u is in the fifth row of this instance, and it references an offset of one up in the vertical direction. First, we determine δh (0, −1) and δv (0, −1). These predicates tell whether or not the referenced location leaves the current expansion in horizontal or vertical direction, respectively. At this time the value of the referred location is computed by (1 + 0, 5 + (−1)) = (1, 4). This address is vertically outside the current expansion area, which consists of the referencing cell address (1, 5) alone. Therefore, δh is false, but δv yields true. Next we observe that the expansion area containing the referred location is vertically repeating from 2 to 4. With this information, R computes the range {(1, 2), (1, 3), (1, 4)} by taking all values of y within 2 and 4 such that the blocks align (this is significant if the block size in the repeating group is more than 1). As another example consider the budget sheet presented in Section 2. We can observe in Figure 2 that the ranges for the summation formulas in the two rightmost columns are just horizontal ranges even though the references point into a horizontally and vertically expandable region. However, since the cells containing the references are vertically aligned with the referenced cells, which means that their vertical expansions are synchronized, or, δh is false, only a horizontal range is created. Applying the function G to I(t) yields the initial table, that is, a block that contains a copy of all the values and formulas from the template. As an example, assume we want to construct the ta| ble for the instance t = Valuesˆ0 3 ˆΣ(u). In this case, | G first starts with G 11 (t, (Valuesˆ0 3 )ˆΣ(u)). G breaks the template instance into the upper and lower segment, determines the height of the upper segment, and recursively calls | G 11 (t, Valuesˆ0 3 ) and G 15 (t, Σ(u)). The latter parameter coordinate is generated by inspecting the height of the top piece, which consists of a single unit label and a three unit expansion block. The upper section is broken again, so that the | repeating block is addressed with G 12 (t, 0 3 ), which leads to G 12 (t, 0)ˆG 13 (t, 0)ˆG 14 (t, 0). Each of these applications of G results in 0. The lower portion is handled by the case of function application, which turns G 15 (t, Σ(u)) into Σ(G 15 (t, u)), which results in Σ((1, 2), (1, 3), (1, 4)), as shown through the example for illustrating the working of R. Therefore, the generated table will be Valuesˆ0ˆ0ˆ0ˆΣ((1, 2), (1, 3), (1, 4)).
3.3
Update Operations
Two kinds of update operations are allowed on generated tables: (1) changing values to other values of the same type and (2) inserting and deleting rows and columns. The first kind of update is realized in the following way. Before a new value φ can be entered into a cell at address (x, y), it is ensured that the cell in the template that corresponds to (x, y) does not contain a formula and the type of the cell is the same as the type of φ. We write chgφ(x,y) (t, b) for the update of the cell located at (x, y) in table b to the new value φ. The argument t gives the template instance that corresponds to b. Formally, chgφ(x,y) returns a pair (t, b0 ) where t is the unchanged template instance and b0 is the changed table. The effect of the row/column-insertion commands depends on the current position in the table. For example, the insert-column command (insC ) will insert k new Excel columns if the current position is within a hex group that has the width k. The formulas and values to be inserted into the new cells are taken from the hex group of the template. For a position outside of a hex group, insC has no effect. Similarly, the insert-row command (insR ) works only when the current position is in a cell from a vex group, in which case k new rows will be inserted where k is the height of all the aligned vex groups covering the current vertical position. Again, formulas and values are copied from corresponding vex groups of the template. In general, the insertion of columns and rows requires also the adjustment of absolute references in existing cells. We can accomplish both the generation of absolute references in newly inserted formulas and the reference adjustments by employing the G function in the following way. First, we update the template instance by increasing the exponent of a hex group (or a collection of vex groups). Then we can simply apply G to the new template instance and obtain correct formulas with correct absolute addresses for the whole table. Finally, we merge this new table with the values from the old table. The functions for updating template instances, C x and Ry , can be defined by recursively descending to the column or rows indexed by x or y, respectively, and incrementing column and row exponents if the encountered table part is a repeating group. Whereas C x has to descend only to the column level and extends at most one exponent for one column, Ry has to recurse into blocks that are contained inside columns and extends all aligned blocks (of which there are generally more than one). For example, executing R2 on | the template instance Valuesˆ0 3 ˆΣ(u) results in the instance |4 Valuesˆ0 ˆΣ(u). Merging the actual values from the old table with the new table obtained by G is achieved by two functions H (and V) that copy all values outside of the column (or row) range for the newly inserted column (row). These functions accept four parameters: an x and y coordinate, which start at 1 and 1, along with a newly generated table and the table before the row or column insertion. Both functions work by recursively descending to the individual cells. Each cell that that lies within the newly inserted columns (or rows) is left unchanged, that is, the default from the template is retained. Similarly, all formulas are left unchanged. All other cell values are copied from the latest table version. Again, we defer for the formal definition to [9].
Finally, the semantics of insC and insR are defined as follows. In the given definitions, the t argument represents the current template instance, whereas b represents the actual table. In addition to the new table, the functions also return the new template instance t0 . 0 1 1 0 0 insC where t0 = C x (t) (x,y) (t, b) = (t , H1 (G 1 (t , t ), b)) 0 1 1 0 0 R ins(x,y) (t, b) = (t , V1 (G 1 (t , t ), b)) where t0 = Ry (t)
Note that in the implemented Gencel system we do not keep a copy of the whole actual spreadsheet. Instead we send to Excel only cell definitions that need to be changed. The concept of template instances allows us to describe the update operations in the formal model as well as to implement an efficient system. Deleting rows and columns works in a similar way, see [9].
3.4
Val
Prod
b
φ→ →φ
Sum
b fk → → xk 1 ≤ k ≤ n b Σ(f1 , . . . , fn )→ → x1 + . . . + xn
Ver
Ref
b b[ρ] = f f → → φ b ρ→ →φ
b b b1 → → b3 b2 → → b4 b b1 ˆb2 → →b3 ˆb4
Tab
b 0 b→ → b b→ →b0
Figure 5: Evaluation of tables (blocks). We use the notation ⇓b to express that the table b is fully evaluated, that is, b contains only values and does not contain any unevaluated formulas or unresolved references. Formally, ⇓b holds for b = φ, or for b = b1 ˆb2 and b = b1 | b2 if ⇓b1 and ⇓b2 holds.
4.
α | α+ → α α | τ | τ | τ ˆτ | τ → | τ ↓
(formula types) (template types)
that f , found at position (x, y) in the template, has type ϕ in the context of the template type σ. The typing rules for formulas are shown in Figure 7. We have two rules for typing references that are used to distinguish between references to single cells and ranges. We can reuse the predicates δ and ξ from Section 3.2 to determine the nature of a reference ρ, that is, whether ρ denotes a range of cells (in which case Θ(ρ) holds) or a single cell (in this case we have ¬Θ(ρ)). We define the predicate Θ as follows. Θ(ρ) :⇐⇒ (δh (x, y) ∧ ξx ) ∨ (δv (x, y) ∧ ξy )
b fk → → xk 1 ≤ k ≤ n b Π(f1 , . . . , fn )→ → x1 ∗ . . . ∗ xn
b b b1 → → b3 b2 → → b4 b →b 3 | b 4 b1 | b2 →
::= ::=
Figure 6: Formula and template types.
Table Evaluation
The evaluation of a table essentially means to evaluate all cells by applying basic functions and looking up references. The evaluation of cells requires the whole table as an additional parameter to facilitate the evaluation of references, which are given by absolute addresses. Therefore, the evalb uation is formalized by a judgment b1 → → b2 defined in Figure 5 that expresses that table or block b1 evaluates to b2 in the context of the table b. The metavariables xi used in the rules Sum and Prod range over numeric values.
Hor
ϕ σ, τ
TYPE SYSTEM
In this section we define a type system for templates to guarantee a meaningful generation of tables and their update operations. We distinguish between two sets of types. First, the types of formulas (ϕ) include base types (α), for example, Num and String, and (first-order) function types for functions with an arbitrary number of arguments. It is easy to add, for example, unary and binary operations and corresponding function types and additional function-application typing rules. Second, the types of templates (τ ) have the same structure as tables, see Figure 6. The type system is defined through several judgments. First, we give typing rules for formulas. Since the type of a formula f depends, in general, on the types of formulas that are contained in cells referenced by f , we formalize the typing of formulas by a judgment σyx . f : ϕ that expresses
In rule App we use the notation α[+] to represent α or α+ , which allows single references as well as range references to be used as function arguments. However, range references are otherwise prohibited in cells, which is expressed effectively through the Fml rule in Figure 9, which requires α and prohibits α+ for f .
Val
φ has type ϕ σyx . φ : ϕ Ref
App
σyx . φ : α+ → α0 σyx . fi : α[+] σyx . φ(f1 , . . . , fn ) : α0
σ[(x, y) + ρ] = τ ¬Θ(ρ) σyx . ρ : τ
Ref+
σ[(x, y) + ρ] = τ
Θ(ρ)
σyx . ρ : τ +
Figure 7: Formula typing rules. We do not allow the arbitrary composition of blocks and columns. Some constraints are already expressed by the abstract syntax. In addition, we allow the vertical composition only for blocks of equal width, see the rules Ver and Col in Figure 9. Finally, we restrict the horizontal composition to columns that have the same vertical pattern. This constraint is expressed through the alignment predicate t o t, which is defined to be the reflexive and transitive closure of the relation formalized in Figure 8. The alignment of columns is used as a premise in rule Template in Figure 9. t1 o t t 2 o t t1 | t 2 o t c1 o c4 c2 o c5 c3 o c6 c1 ˆ(c2 ˆc3 ) o (c4 ˆc5 )ˆc6
cot c→ o t
c1 o c3 c2 o c4 c1 ˆc2 o c3 ˆc4 b1 o b2 b↓1 o b↓2
lb1 = lb2 b1 o b2
Figure 8: Column alignment. The type system shown in Figure 9 defines judgments of the form σyx ` t : τ that express that the (sub)table t has the template type τ at the position (x, y) in the context σ. Here we overload the judgment notation for tables, columns, blocks, and formulas. To illustrate the typing rules, we give a couple of examples. Using rule Val (from Figure 7) and Block+ (from
σyx . f : α σyx ` f : α
Fml
Hor
Ver
← →
σyx+ b ` b0 : τ 0 σyx ` b | b0 : τ | τ 0
σyx ` b : τ
σyx ` b1 : τ
x ` b2 : τ 0 σy+lb 1
lb = lb0
← → ← → b1 = b2
σyx ` b1 ˆb2 : τ ˆτ 0 Block+
Col
The table-evolution-safety property can now be expressed by the following theorem, which is proved in [9].
σyx ` c1 : τ
σyx ` b↓ : τ ↓
x σy+lc ` c2 : τ 0 1
σyx
` c1 ˆc2 : τ ˆτ
Col+
Template
σyx ` b : τ
σyx ` t :
← ← → c→ 1 = c2
0
Theorem 1. If t is well typed and (t, b) ∈ T (t), then ∃b0 .b→ →b0 ∧ ⇓b0 .
5.
PROTOTYPE EVALUATION
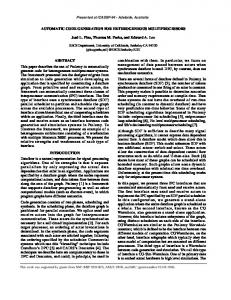
The components of the Gencel system are shown in Figure 10. The generator and type checker have been implemented in Haskell [15]. We have already successfully employed a similar Haskell-backend strategy in the recent implementation [1] of a header and unit inference system [10]. The information from the Excel sheet being manipulated by the end user is captured by a VBA program and sent to the backend server. The VBA system is shipped as an Excel add-in. The Haskell modules are compiled with GHC to a Windows executable that runs as the backend server.
σyx ` c : τ ` c→ : τ →
σyx
← → τ σyx+ t ` t0 : τ 0 σyx ` t | t0 : τ | τ 0
Frontend
Backend
t o t0
Figure 9: Table typing rules. Figure 9), we can derive that 0↓ has type Num↓ . Since Values has type String and is also of width 1, rule Ver can be employed to show that Valuesˆ0↓ has type StringˆNum↓ . To type the reference in the formula Σ(u) we need a templatetype context. With a context σ = StringˆNum↓ ˆNum we can first derive by rule Ref+ σ31 . u : Num+ (the row number 3 results from the adjustment in the second premise of the Ver rule). Since, according to rule Val, Σ has the type Num+ → Num in any template-type context σyx , we can apply the App rule to obtain the type Num for the summation cell, which finally yields the type σ for the whole summation column. The type system allows the typing of cyclic references by assuming a fixed, arbitrary type for all cells on the cycle in σyx . Cycles represent nonterminating computations and correspond to nonterminating function definitions whose value is undefined. In contrast to a Turing-complete language, we can detect nonterminating computations by identifying cycles in tables. Therefore, we consider a template to be type correct only if it does not contain any cycles. Definition 1. t is well typed with template type τ if τ11 ` t : τ and t does not contain a cycle. The main result for the presented table calculus is that a type-correct template allows only the generation of tables that can be always safely evaluated and never result in a computational error, such as type, omission, or reference errors. To express this result formally we define the set of tables T (t), that is, the set of (template instance, table) pairs, that can be obtained from a template t through update operations as follows. T (t) is the smallest set satisfying: (1) (I(t), G11 (I(t), I(t))) ∈ T (t) (2) (t, b) ∈ T (t) =⇒ u(x,y) (t, b) ∈ T (t) ← → for 1 ≤ x ≤ b , 1 ≤ y ≤ lb and R u ∈ {ins , insC , delR , delC , chgφ }
Message Dispatcher Spreadsheet
Message Dispatcher
Value Updates
Structure Updates
Value Checker Type Checker
Generator Templates
Excel
VBA
Haskell
Figure 10: Gencel system architecture.
The Gencel toolbar has four buttons for row and column insertions and two buttons for row and columns deletions. Depending on which button has been clicked, the VBA program sends the corresponding message, with information about the current cell selection, to the backend server. The server performs the update to yield the new template instance. It then generates the messages for the updates to be performed to the Excel spreadsheet and sends them to the VBA program (these messages simply paint the new template instance in the Excel spreadsheet). Through Excel events, the VBA program also keeps track of value updates to the Excel spreadsheet. The backend server contains a “Message Dispatcher” that receives messages from the VBA program. In case of structural updates like row/column insert/delete operations, the dispatcher interacts with the “Generator” module to come up with the new template instance and the messages to reflect the update in the Excel frontend. In case the user changes a value in the Excel spreadsheet, the dispatcher forwards the message to the “Value Checker” module that checks the updated value against the template to ensure that the new value is type correct. The other components of the backend server include the “Type Checker” module that checks the spreadsheet template loaded into the system
by the user to ensure that it is type correct. The template, after type checking, is translated into the initial table instance by the generator. Each Excel spreadsheet generated by the Gencel system has a corresponding Vitsl file that contains the most recent template instance for which the user saved the spreadsheet. Each time the user issues the save-file command in Excel, Excel would save the workbook, and the Excel events triggered notify the backend server to save the current template instance. Whenever the Gencel add-in has been enabled in Excel, every time the user loads a workbook in Excel, the events would trigger the backend server to load the corresponding template instance. This allows us to keep both files synchronized. Since we were concerned with the usability aspects of Gencel, we conducted as a first step a pilot think-aloud study with four subjects of varying age and experience with Excel. The subjects were drawn from a continuing education course for high school teachers conducted at Oregon State University. The think-aloud portion of the study took approximately one hour per subject. The first part of the study required the subjects to develop a budget spreadsheet to compute the projected and actual earnings for a company with multiple business locations. The second part of the exercise required the subjects to update the spreadsheet to include a new business location, as well as earnings data for a new time period. Of the four subjects, two successfully completed their tasks while two had to stop when they ran into technical difficulties from trying to use the Excel insertion and copy/paste features while within the Gencel framework. Two of the subjects performed an initial visual audit of the spreadsheet after loading the template. However, the subjects gained trust in the system’s error prevention capabilities and only checked the values in the data cells while performing the later tasks. Three of the four subjects demonstrated a moderate-to-good grasp of the Gencel system after only a short period of instruction, and expressed appreciation for the error-prevention capabilities of Gencel. Supporting this level of confidence in the subjects is the fact that of the spreadsheets created (each with approximately 160 cells), none contained any errors. The preliminary results from the study were very encouraging. They indicate that the users quickly perceive multiple benefits from the Gencel system, find it for the most part easy to learn, and that users do in fact create correct spreadsheets with Gencel. The study also highlighted several areas of improvement, information invaluable to the continued development of Gencel. A more comprehensive and detailed study is planned for the near future.
6.
RELATED WORK
We discuss related work in the areas of spreadsheet testing [18, 11, 16] and consistency checking [10, 6, 3, 4, 1]. Rothermel et al. have come up with the “What You See Is What You Test” methodology for testing spreadsheets [18]. This methodology uses data flow adequacy criteria and coverage monitoring to give users incremental feedback (using cell coloring and a “testedness” progress bar) on the percentage of cells that have been tested. A system that automatically generates test cases for end users to help them test their spreadsheets is described in [11]. Fault localization
techniques to help end users locate the sources of errors have also been incorporated into this testing approach [16]. The use of assertions to identify erroneous formulas is presented in [6]. In this system, assertions entered by the user are propagated through the spreadsheet formulas. It then warns the user if there is a conflict between the value in the cell and the cell’s assertion or when there is a conflict between the system-generated assertion and the user-specified assertion for a cell with a formula. A formal reasoning system for detecting spreadsheet errors based on a classification of spreadsheet contents into units was proposed in [10]. A related approach is reported in [3], which extends the unit system by a new kind of relationship. Although that described extension provides more fine-grained information about headers, it complicates automatic header inference. Accordingly, the approach of [3] requires the user to manually annotate spreadsheets with header information. Recently, we have implemented an automatic unit checker that is based on the automatic inference of header information based on different aspects of the spatial layout of spreadsheets [1]. The system presented in [4] carries out unit checking based on the actual physical or monetary units of the data in the spreadsheet. This approach requires the user to annotate the cells with the unit information, which is then used in the subsequent analysis to flag formulas that violate unit correctness. The most distinguishing difference between the described approaches and Gencel is that all the previous work has been concerned with the identification of errors in spreadsheets, whereas the approach taken by Gencel focuses on error prevention.
7.
CONCLUSIONS AND FUTURE WORK
We have presented a system for the development of safely evolvable spreadsheets. Two key aspects of the system are: • Customized update operations are automatically created by a program generator from templates • A type system guarantees the absence of errors in spreadsheets that evolve from templates An initial user study has indicated that the system is usable by end users and has a gentle learning curve. The user study also provided valuable feedback for directions of future research. The two most important next steps are the following. (1) Integrate Vitsl into Excel so that an end user can switch between two modes of spreadsheet editing: (a) the editing of templates, and (b) the expansion of tables and editing values. The challenge is to define an editing environment that can support flexible changes in the templateediting mode while keeping it synchronized with the current table (and also template instance). (2) To support a wide-spread use of the Gencel system and to enable a smooth transition, we have to offer tools that can load existing Excel spreadsheets into the Gencel system. To this end, we have to be able to distill templates from Excel spreadsheets such that the spreadsheet is an instance of the template. We call this process of identifying templates from plain spreadsheets template parsing. To cope with the anticipated high degree of ambiguity, we plan to leverage spatial analysis techniques that we have recently developed to identify semantic structures in spreadsheets [1].
Other useful extensions to be investigated include the integration of formatting into templates, which is to be inherited by evolving spreadsheets, or the concept of value generators that allow the systematic creation of new values taken from sequences/tables, such as [k, k + 1, . . .] or [Jan, Feb, . . .], instead of repeatedly generating the same values when inserting rows and columns. We believe the Gencel system is a promising new approach to address some of the software engineering problems in spreadsheets. The biggest advantages of the errorprevention approach, enabled through program generation, is a higher degree of correctness and the saving of (debugging and testing) time. Although the requirement for templates and the safety checks constrain the spreadsheet editing process, we believe the trade-off “safety for convenience” is worthwhile as it is well appreciated in many areas of our lives.
8.
REFERENCES
[1] R. Abraham and M. Erwig. Header and Unit Inference for Spreadsheets Through Spatial Analyses. In IEEE Int. Symp. on Visual Languages and Human-Centric Computing, pages 165–172, 2004. [2] R. Abraham, M. Erwig, S. Kollmansberger, and E. Seifert. Visual Specifications of Correct Spreadsheets. Technical Report CS05-60-1, School of EECS, Oregon State University, 2005. [3] Y. Ahmad, T. Antoniu, S. Goldwater, and S. Krishnamurthi. A Type System for Statically Detecting Spreadsheet Errors. In 18th IEEE Int. Conf. on Automated Software Engineering, pages 174–183, 2003. [4] T. Antoniu, P. A. Steckler, S. Krishnamurthi, E. Neuwirth, and M. Felleisen. Validating the Unit Correctness of Spreadsheet Programs. In 26th IEEE Int. Conf. on Software Engineering, pages 439–448, 2004. [5] P. S. Brown and J. D. Gould. An Experimental Study of People Creating Spreadsheets. ACM Transactions on Office Information Systems, 5(3):258–272, 1987. [6] M. M. Burnett, C. Cook, J. Summet, G. Rothermel, and C. Wallace. End-user Software Engineering with Assertions. In Int. Conf. on Software Engineering, pages 93–103, 2003. [7] M. M. Burnett, A. Sheretov, B. Ren, and G. Rothermel. Testing Homogeneous Spreadsheet Grids with the “What You See Is What You Test” Methodology. IEEE Transactions on Software Engineering, 29(6):576–594, 2002. [8] S. Ditlea. Spreadsheets Can be Hazardous to Your Health. Personal Computing, 11(1):60–69, 1987.
[9] M. Erwig, R. Abraham, I. Cooperstein, and S. Kollmansberger. Gencel — A Program Generator for Correct Spreadsheets. Technical Report TR04-60-11, School of EECS, Oregon State University, 2004. [10] M. Erwig and M. M. Burnett. Adding Apples and Oranges. In 4th Int. Symp. on Practical Aspects of Declarative Languages, LNCS 2257, pages 173–191, 2002. [11] M. Fisher II, M. Cao, G. Rothermel, C. Cook, and M. M. Burnett. Automated Test Case Generation for Spreadsheets. In Int. Conf. on Software Engineering, pages 141–151, 2002. [12] J. F. Lerch, M. M. Mantei, and J. R. Olson. Skilled Financial Planning: The Cost of Translating Ideas Into Action. ACM Conf. on Human Factors in Computing Systems, pages 121–126, 1989. [13] R. R. Panko. What We Know About Spreadsheet Errors. Journal of End User Computing (Special issue on Scaling Up End User Development), 10(2):15–21, 1998. [14] R. R. Panko. Spreadsheet Errors: What We Know. What We Think We Can Do. In Symp. of the European Spreadsheet Risks Interest Group (EuSpRIG), 2000. [15] S. L. Peyton Jones. Haskell 98 Language and Libraries: The Revised Report. Cambridge University Press, Cambridge, UK, 2003. [16] S. Prabhakarao, C. Cook, J. Ruthruff, E. Creswick, M. Main, M. Durham, and M. Burnett. Strategies and Behaviors of End-User Programmers with Interactive Fault Localization. In IEEE Int. Symp. on Human-Centric Computing Languages and Environments, pages 203–210, 2003. [17] K. Rajalingham, D. R. Chadwick, and B. Knight. Classification of Spreadsheet Errors. Symp. of the European Spreadsheet Risks Interest Group (EuSpRIG), 2001. [18] G. Rothermel, M. M. Burnett, L. Li, C. DuPuis, and A. Sheretov. A Methodology for Testing Spreadsheets. ACM Transactions on Software Engineering and Methodology, pages 110–147, 2001. [19] U.S. Department of Education. Audit of the Colorado Student Loan Program’s Establishment and Use of Federal and Operating Funds for the Federal Family Education Loan Program, July 2003. Report ED-OIG/A07-C0009. [20] U.S. Department of Health and Human Services. Review of Medicare Bad Debts at Pitt County Memorial Hospital, January 2003. Report A-04-02-02016.