speed the clinician's work, an automatic heart isolation tech- ... are oriented perpendicular to the direction toward the center ... We call this the âblobâ constraint.
AUTOMATIC HEART ISOLATION FOR CT CORONARY VISUALIZATION USING GRAPH-CUTS G. Funka-Lea1 , Y. Boykov3 , C. Florin1 , M.-P. Jolly1 , R. Moreau-Gobard1 , R. Ramaraj1 and D. Rinck2 1
Imaging & Visualization Dept., Siemens Corporate Research, Princeton, USA 2
Siemens Medical Solutions CT, Forchheim, Germany 3 University of Western Ontario, London, Canada
ABSTRACT
from this unfolding procedure. Our approach for the visualization of the coronary arteries relies on volume rendering instead of MIP. Volume rendering allows the coronary arteries to be seen in their three-dimensional context with the structures of the heart and the major blood vessels. A very large body of work exists on segmenting the left ventricle of the heart in 2D or 3D data sets from various imaging modalities. These studies focus on finding the blood pool of a chamber and sometimes the muscle that encloses the chamber. Some researchers have looked at segmenting both the left and right ventricles of the heart but the goal is again to find the blood pools and muscle as separate regions. Much of the work done on 3D cardiac segmentation has been modelbased (see [4] for a review or [5, 6, 7] for more recent work). Some of the latest studies attempt to segment all four chambers of the heart using a model [8, 9]. This work is not generally relevant to the case we are interested in, where all the chambers of the heart must be segmented together as a single object, separated from the surrounding physiology. Our work efficiently segments the blood pools and muscle of the heart as a single 3D region.
We describe a means to automatically and efficiently isolate the outer surface of the entire heart in Computer Tomography (CT) cardiac scans. Isolating the entire heart allows the coronary vessels on the surface of the heart to be easily visualized despite the proximity of surrounding organs such as the ribs and pulmonary blood vessels. Numerous techniques have been described for segmenting the left ventricle of the heart in images from various types of medical scanners but rarely has the entire heart been segmented. We make use of graphcuts to do the segmentation and introduce a novel means of initiating and constraining the graph-cut technique for heart isolation. The technique has been tested on 70 patient data sets. Results are compares with hand labeled results. 1. INTRODUCTION Cardiac Computer Tomography is a fast, non-invasive, submillimeter resolution, volumetric medical imaging modality. The development of Multi-slice CT has made it an important tool for imaging the coronary arteries. Nevertheless, 3D visualization of the coronary arteries has required human interaction to prepare the volume by removing structures that do not belong to the heart (lungs, liver, ribs, etc.). To dramatically speed the clinician’s work, an automatic heart isolation technique has been developed. For this method to be effective it needs to be fast enough for casual use and robust enough to handle different kinds of pathologies. This paper presents the heart isolation technique and its evaluation on a large number of real clinical cases. A typical technical approach for blood vessel visualization has been first to remove bones (examples include [1, 2]). With the bones removed, a maximum intensity project (MIP) will make most blood vessels readily visible. However, this approach is not sufficient for visualization of the coronary vessels because the contrast agent in the blood in the chambers of the heart obscures the coronaries in a MIP. A study by [3] reports a method to unfold a thin surface of the heart for better MIP visualization, but significant distortions result
0-7803-9577-8/06/$20.00 ©2006 IEEE
2. METHODS There are three important aspects of our approach to automatic heart isolation. The first is the use of the graph-cut technique [10] to perform the segmentation step. Second, a seed-region is automatically found so the segmentation can be run automatically. Third, an additional constraint was added to the graph-cut formulation to prefer a shape whose edges are oriented perpendicular to the direction toward the center of the seed-region. We call this the ”blob” constraint. This helps prevent leaking into the aorta or pulmonary vessels. 2.1. Segmentation initialization The type of graph-cut segmentation we use requires as an initialization that some points be known to lie within the region of interest and some points be known to lie outside of the region of interest. Automatic determination of such seed re-
614
ISBI 2006
gions begins by computing the volumetric barycenter weighted by intensity. Because we are working with contrast CT studies where the brightest regions are bone and blood, the location of this point is most affected by the distribution of these tissues. The distribution of bone in the chest is relatively symmetric about the heart. The largest concentrations of blood are generally within the chambers of the heart. Consequently in nearly all cases tested the point found is within the heart (see Figure 3). Given a point within the heart, the pre-segmentation step consists of determining the ellipsoid of maximum volume contained within the heart. This ellipsoid provides a stable initialization for the graph-cut algorithm. To this end, an ellipsoid is progressively grown starting from the entry point, just as if a balloon were blown into the heart. When the balloon touches the heart wall, it keeps on growing in the direction opposite to the contact point, just as if a balloon that touches a wall were blown (see Figure 1). This initialization step stops when the balloon touches several walls and cannot be inflated anymore. A limited number of reasonable assumptions have to be made on the detection of contact points. The blood pool and myocardium are characterized by for the most part by intensities larger than -224 (Hounsfield units) and any intensity below is considered as part of the out-of-heart structures. This technique has several advantages: its simplicity keeps the needed computation time low, and the balloon’s form (ellipsoidal with specific X, Y and Z radii) is close to the actual heart’s surface shape, giving a good shape prior for the segmentation. If the result of the balloon expansion is a region that is too small to be a region within the heart then the algorithm terminates and no heart isolation is produced. 2.2. Graph-cut based segmentation We consider a segmentation algorithm driven by the graph optimization technique [10] with an additional “blob” constraint. The idea lying behind this graph-cut segmentation is to minimize an energy function that is defined on a graph, according to the cut of minimum weight. The energy is written as the sum of two terms : Esmooth (f ) that imposes smoothness constraints on the segmentation map, and Edata (f ) measuring how the label f is adapted to the data: � Vpq (fp , fq ), (1) Esmooth (f ) = p,q∈N
Edata (f ) =
�
Dp (fp ).
(2)
p∈P
Vpq in (1) is the interaction function between the (directed) pair of neighboring pixels (p, q) for a given neighborhood system N , and Dp (fp ) is a likelihood of label fp for given pixel p. It is known (e.g. [11]) that graph cuts provide a global optimal solution for the case of binary valued fp . Graph-cut segmentation for object extraction was proposed in [10] where the likelyhoods Dp were used to set hard or soft
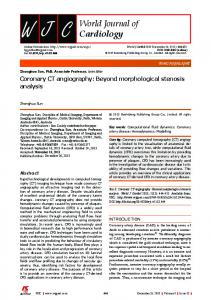
Fig. 1: Top left: A balloon is expanded within the heart. The heart wall pushes the balloon toward the heart center as the balloon grows. Top right: volume rendering of original heart volume. Bottom left: heart cropped based on segmentation mask in a single MPR. Bottom right: volume rendering after automatic heart isolation algorithm. region-based constraints and interactions are based on binary Potts model Vpq = wpq ∗ T (fp �= fq ) where discontinuity costs wpq are normally computed from differences in intensity between pixels p and q. Here we modify the energy equation to include a ”blob” constraint: E(f ) = Esmooth (f ) + Edata (f ) + Eblob (f ) , Eblob (f ) =
�
Bpq (f (p), f (q); C),
(3) (4)
p,q∈N
Bpq in (1) is a Potts interaction with discontinuity penalty depending on the angle between the line segments pq and pC where C is the center of the seed-region. We use Bpq (fp , fq ) = cos2 (pq, pC)∗T (fp �= fq ) if cos(pq, pC) < 0 and Bpq (fp , fq ) = 0 otherwise. Note that Bpq penalizes folds of a cut with respect to rays from center C. Thus, a blob energy term encourages cuts to look like convex blobs that are roughly centered at C. 2.3. Isolation refinement The goal of isolating the surface of the heart to visualize the coronaries is not strictly defined in terms of a contrast boundary in the image. In order to ensure that the coronaries are
615
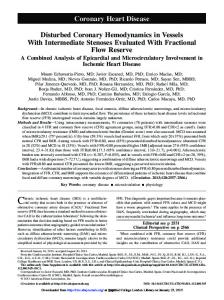
Fig. 3: Comparison of automatic (left) and manual (right) segmentation for Case 3. Note that the coronary bypass is readily visible in each but that the automatic results includes more of the aorta and other major vessels.
Fig. 2: Percentage of the automatically isolated heart surface that lies within a given distance from the manually delineated surface for 9 of the data sets. The dark line indicates the average of the results for the 9 cases. considered as part of the heart, the volume isolation mask needs to expand a little beyond the contrast boundary at the surface of the heart. The results of graph-cut segmentation is dilated to produce the final results. Instead of using a uniform dilation factor for the entire binary volume, the dilation factor itself is varied linearly in the sagittal direction. This provides more dilation at the base of the heart where the coronaries branch from the aorta. 3. RESULTS The presented algorithm has been tested on 70 CT data sets from patients. These 70 data sets come from a range of Siemens CT scanners: Sensation 16 (39 cases), Sensation 64 (25 cases), Volume Zoom (3 cases), Somatom Plus 4 - VZ (2 cases), and Siemens Sensation Cardiac (1 case). The cases also cover a range of apparent pathology or normal subjects. In Figure 4 cases 1, 7, 12, and 15 have stents. Cases 20 shows no apparent coronary pathology. In Figure 3 Case 3 has a bypass. In only two of the 70 data sets did our algorithm fail to find the heart. In these two cases the algorithm failed to initialize the segmentation correctly within the heart. In four of the 70 cases some part of the coronary arteries is missing from the isolated heart. In Case 20 in Figure 4 the right coronary artery has been truncated as part of the isolation. In five cases there was too much of the ribs or sternum and so the surface of the heart was partially obscured. In these cases the bone can generally be removed with a single clipping plane. In case 15, we see part of the sternum that actually occludes the lower part of the stent and the RCA. In those cases where the results were not ideal it is possible to use graph-cuts in an interactive fashion to fix the segmentation [10]. The automatically isolated heart surface was compared to manual delineation of the heart surface for 9 cases (see Figure 2. The median error between the manually and automatically
616
generated surface was 4.1 mm and the average error was 5.5 mm. Figure 2 show what percentage of the automatic surface lies within a given distance from the manually defined surface. On average 80% of the automatic surface lies within 7.6 mm of the manually defined surface. The major discrepancies between the manual and automatic results occur at the base of heart where the major blood vessels attach to the heart. This area is not critical for visibility of the coronaries. For one data set (Case 3) we had two experts manually delineate the heart. The median difference between these manually defined surfaces was 1.2 mm and the average difference was 6.7 mm. The balloon step takes less than a second (on a 2.4 GHz processor, 1 GB RAM). The entire segmentation itself takes about 20 seconds. 4. DISCUSSIONS A variety of techniques are available now for doing medical image segmentation [12]. Level-sets have been applied in a number of medical image scenarios (for example [13]). For this application we chose to use graph-cuts over other methods of medical image segmentation for the following reasons. The problem is one of object separation from background. The topology of the object to be isolated is simple and fixed. Most but not all of the object can be isolated based on contrast with the background. Only simple shape-prior information is needed - the heart is a compact blob. We wanted to avoid a shape-prior that would too tightly constrain the recoverable shapes. The solution should take less that 30 seconds on a CT volume with a standard PC. We prefer a solution that can avoid local minima and provide numerical robustness. The newly presented method offers the potential to give a detailed overview about the coronary status without any user interaction. The clinician can easily see if there is a suspicious coronary segment. Furthermore, it is possible to propagate the isolated heart mask to several heart phases to view the coronary tree at different time points during the cardiac cycle.
[3] Charles Florin, Romain Moreau-Gobard, and Jim Williams, “Automatic heart peripheral vessels segmentation based on a normal MIP ray casting technique,” in MICCAI, 2004, pp. 483–490.
Case 1
[4] Alejandro F. Frangi, Wiro J. Niessen, and Max A. Viergever, “Three-dimensional modeling for functional analysis of cardiac images: a review,” IEEE Trans. on Medical Imaging, vol. 20, no. 1, pp. 2–25, January 2001.
Case 2
[5] Steven C. Mitchell, Johan G. Bosch, Johan H. C. Reiber Boudewijn P. F. Lelieveldt, Rob J. van der Geest, and Milan Sonka, “3-D active appearance models: segmentation of cardiac MR and ultrasound images,” IEEE Trans. on Medical Imaging, vol. 21, no. 9, pp. 1167– 1178, September 2002. Case 7
[6] M. Sermesant, C. Forest, X. Pennec, H. Delingette, and N. Ayache, “Deformable biomechanical models: application to 4D cardiac image analysis,” Medical Image Analysis, vol. 7, no. 4, pp. 475–488, December 2003.
Case 12
Case 15
[7] Maria Lorenzo-Valdes, Gerardo I. Sanchez-Ortiz, Andrew G. Elkington, Raad H Mohiaddin, and Daniel Rueckert, “Segmentation of 4D cardiac MR images using a probabilistic atlas and the EM algorithm,” Medical Image Analysis, vol. 8, no. 3, pp. 255–265, September 2004.
Case 20
Fig. 4: Results of automatic heart isolation for 6 of the seventy patients on which the algorithm was tested.
[8] Ting Chen, Dimitri Metaxas, and Leon Axel, “3D cardiac anatomy reconstruction using high resolution CT data,” in MICCAI, 2004, pp. 411–418.
Based on the isolated heart, the clinician can intuitively work with the 3D data of the coronary tree e.g. for vessel segmentation purposes. The overall workflow for coronary diagnostic is strongly enhanced by this promising technique.
[9] Marcin Wierzbicki, Maria Drangova, Gerard Guiraudon, and Terry Peters, “Mapping template heart models to patient data using image registration,” in MICCAI, 2004, pp. 671–678. [10] Yuri Boykov and Marie-Pierre Jolly, “Interactive graph cuts for optimal boundary & region segmentation of objects in N-D images,” in ICCV, July 2001, vol. 1, pp. 7–14.
4.1. Acknowledgments We wish to thank Christina Bell of Siemens Medical Solutions CT for help with testing and Mattias Rasch of Siemens Corp. Research for help in realizing the product version.
[11] D Greig, B. Porteous, and A. Seheult, “Exact minimization a posteriori estimation for binary images,” Journal of the Royal Statistical Society, Series B, vol. 51, no. 2, pp. 271–279, 1989.
5. REFERENCES [1] M. Fiebich, C. M. Straus, V. Sehgal, B.C. Renger, K. Doi, and K. R. Hoffmann, “Automatic bone segmentation technique for CT angiographic studies,” J. Comput. Assist. Tomogr., vol. 23, no. 1, pp. 155–161, January 1999.
[12] Dzung L. Pham, Chenyang Xu, and Jerry L. Prince, “Current methods in medical image segmentation,” Annual Review of Biomedical Engineering, vol. 2, no. 1, pp. 315–337, August 2000.
[2] M. van Straten, H. W. Streekstra, C.B. Majoie, G. J. den Heeten, and C. A. Grimbergen, “Removal of bone in CT angiography of the cervical arteries by piecewise matched mask bone elimination,” Med. Phys., vol. 31, no. 10, pp. 2924–2933, October 2004.
[13] Nikos Paragios, “A level set approach for shape-drive segmentation and tracking of the left ventricle,” IEEE Trans. on Medical Imaging, vol. 22, no. 6, pp. 773–776, June 2003.
617