Automatic Image Tagging As A Random Walk With Priors On The Canonical Correlation Subspace Timothée Bailloeul and Caizhi Zhu
Yinghui Xu
Ricoh Software Research Center Beijing, Co Ltd. 28th floor, Tengda Plaza, no. 168, Xiwai street Haidian district, 100044 Beijing, China
Ricoh R&D Group, Advanced Technology R&D Center, 2nd Dpt., Kanagawa-Ken Yokohama-Shi, Tsuzuki-ku, Shinei-Cho, 16-1, Japan
[email protected]
[email protected]
ABSTRACT
the mass of accumulated data is meant to be useful, successful image indexing and retrieval systems have become a necessity. Querying databases by an exemplar image has been one of the first techniques to search digital photographs. In such scenario, images of the database which are visually similar to the query are returned. This procedure is inconvenient for two reasons: i) it constrains the user to always have an image at hand. ii) the contents of retrieved images are different from these of the query because of the semantic gap occurring in the image feature space. A more promising alternative consists in indexing images automatically with high-level information keywords prior to the retrieval task. This way, the user can retrieve more semantically consistent images upon text query, which is more effective and suitable.
In this paper, we present a graph-based scheme founded on the GCap method of Pan et al. [12] to perform automatic image annotation. Our approach, namely enhanced GCap (EGCap), takes advantage of the canonical correlation analysis technique (CCA) to shorten the semantic gap in the image space and define a new metric in the text space to correlate annotations. As a result, graph linkage errors at the image level are decreased and the consistency of tags output by the system is improved. Besides, we introduce graph link weighting techniques based on inverse document frequency and CCA metric which are proved to enhance the annotation quality. Simple and self-consistent, the present approach achieves image tagging in real time due to the lightweight Local Binary Pattern image features used, the absence of image segmentation, and the reduced size of feature vectors after CCA projection. We test the proposed approach against top-grade state-of-the-art techniques on Corel and Flickr databases, and show the effectiveness of our method in terms of per-word, per-image and processing time performance indicators.
There are basically two ways to carry out such computerized image annotation. The first, called text-based approach, consists in mining keywords from any kind of textual information attached to the image to be indexed. The text metadata used comprehends the image file name, caption, and text wrapping the picture when the latter is embedded in a Web page. While such technique has been widely adopted by major Web search engines, it has two limitations: i) it is prone to indexing errors as the text metadata is not necessarily related to the contents depicted on the image. ii) it is constrained to the processing of photos incorporated into electronic documents, such as Web pages, and cannot process standalone images. The shortcomings of the text-based procedure are addressed by the alternative image-based approach. The latter is based on Computer Vision and statistical Machine Learning techniques to discover the intricate relationships among words and image features given a training set of human-annotated images. The trained statistical model is then able to predict a set of relevant keywords related to an image unseen in the learning phase. For nearly a decade, computer scientists have achieved progresses in this field. However, automatic image annotation remains a challenging problem, and because of the moderate tagging accuracy and recall performance obtained, no fully operational system or product has emerged till now. For the past years, various approaches have been proposed, including methods based on machine bilingual translation [3], generative probabilistic models [1, 4], graph theory [8, 12] and multi-class classification [2]. In [8], a graph-based approach is disclosed where image visual content and text labels are incorporated by manifold ranking. A nearest spanning chain procedure is used to derive the similarity between images and annotations in an adaptive graph-like structure. After performing a
Categories and Subject Descriptors H.3.1 [Content Analysis and Indexing]: Indexing methods.
General Terms Algorithms, Experimentation, Performance.
Keywords image annotation, image retrieval, inverse document frequency, local binary pattern.
1. INTRODUCTION The rapid expansion of the Web and the growing number of digital imaging sensors embedded in consumer-level products are producing larger and larger image repositories. As
Permission to make digital or hard copies of all or part of this work for personal or classroom use is granted without fee provided that copies are not made or distributed for profit or commercial advantage and that copies bear this notice and the full citation on the first page. To copy otherwise, to republish, to post on servers or to redistribute to lists, requires prior specific permission and/or a fee. MIR’08, October 30–31, 2008, Vancouver, British Columbia, Canada. Copyright 2008 ACM 978-1-60558-312-9/08/10 ...$5.00.
75
random walk with restart on the graph, candidate labels are output and inconsistent ones are filtered out by a word correlation procedure based on WordNet and word co-occurrence. Recently, more efforts were dedicated to achieve automatic image annotation in real time. In [7], Li and Wang disclosed ALIPR1 which annotates Corel images in 1.4 s. Trained with 48,000 Corel images and a 332-word vocabulary, ALIPR was manually evaluated using 5,400 Flickr images. The accuracy of the first word predicted by ALIPR is 51% and 98% of the images could be annotated correctly with at least one word. In [10], Nakayama et al. disclosed one of the fastest tagging schemes of the moment. Implemented on an 8-core machine, their method achieves image annotation in 0.02 s and yields the best performance on the Corel5k data set designed in [3]. The main contribution of their approach is the pre-processing of image features by a subspace method which maximizes the correlation between image and text information contained in the training set. The reduced size of image features after subspace projection fastens the image tagging procedure which is similar to that of Feng et al. [4].
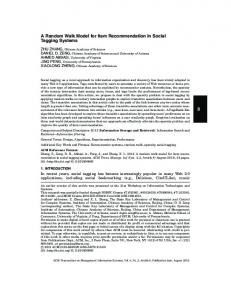
images in the graph. The advantage of CCA is twofold: i) in the CCA-projected image space, image features are maximally correlated with high-level annotations. It allows reducing the semantic gap in the image feature space and decreases errors in the “image-to-image” linkage (upper links of figure 1). ii) conversely, annotations are maximally correlated with image features in the CCA-projected text space. As a consequence, CCA allows creating “word-to-word” links connecting annotations based on visual impression (lower links of figure 1). Such relationships increase the consistency of words output by the tagging system and have been unexplored in GCap or other CCA-based approaches [5, 10]. Secondly, we investigate graph link weighting techniques based on inverse document frequency (IDF) and the distance in CCA-projected subspaces to improve the quality of annotations. IDF weighting operates at the “image-to-word” level of the graph (middle links of figure 1) and alleviates the bias towards popular tags learned in the training. The weighting with respect to CCA-based metrics aims at decreasing further the linkage errors occurring at the image or word level.
2. METHOD OVERVIEW The present method is based on the GCap scheme [12] which models relationships among images and words by connecting them in an undirected graph. Image nodes are linked to each other based on their similarity measured in the image feature space, while image and word nodes are linked thanks to the prior knowledge provided by the human-annotated images of the training set. To tag a new image, one appends it to the most similar images of the trained graph and perform a random walk with restart (RWR) to determine the most relevant word nodes related to the query.
Thirdly, we explore the benefit of the Local Binary Pattern (LBP) image features to represent photographs. These features are attractive as they compactly embed various sources of information such as contrast and color and have a low computational cost. LBP features of all training images are extracted first to compute the CCA projection model to allow the graph construction. The remainder of this paper is organized as follows. In sections 3 and 4, we recall the background of LBP image features and the CCA technique. In section 5, we outline the shortcomings of the GCap method [12] and detail the counter-measures based on the canonical correlation space and the weighting techniques. In section 6, we provide experimental results to assess the efficacy of the proposed scheme and conclude in section 7.
Our main contribution is to improve the construction of the graph-based training model. The schema of figure 1 summarizes the novelties disclosed in this paper. Image similarity measured in CCA image space & weighting w.r.t distance
Training images
k−NN links
I1
I2
I3
I4
I5
I6
3.
I8
I7
Image as LBP features
IDF to balance weights of popular and rare words W1
W2
W3
W4
W5
LBP IMAGE FEATURES
The LBP feature is a compact texture descriptor for which each comparison result between a center pixel and one of its surrounding neighbors will be encoded as a bit in a LBP code [9] (figure 2). LBP codes are computed for every pixel
W6
k−NN links
6
5
2
1
7
6
1
1
9
8
7
1
0
0
111 000 0 000 111 000 111 1
1
1
2
111 000 000 111
4
128 111 000 8 64 32 16
Annotations Word similarity measured in CCA text space & weighting w.r.t distance
Figure 2: LBP code computation for gray level image and an 8-neighbor window [9]. The 8-bit pattern is 11110001, and the corresponding LBP code: 1+16+32+64+128=241.
Figure 1: Illustration of the enhanced graph to perform the RWR on canonical correlation space.
and accumulated into a histogram to represent the whole image. Statistical analysis can also be used to generate even shorter or compacter LBP histograms, such as rotation invariance (RI), uniformity (U2), or the combination of both (RIU2). LBP is flexible as it can be enhanced by contrast, color or multi-scale information. In the proposed approach,
Firstly, we introduce the canonical correlation analysis (CCA) subspace technique to maximize the coherence between the visual features and text labels of the training 1
Automatic Linguistic Indexing of Pictures - Real-time
76
ˆ yy Wy = 1. It leads to the resolution of two symmetWyt C ric eigenproblems which can be resolved successively, or by resorting to the Singular Value Decomposition (SVD) technique. In the SVD-based approach we consider the following matrix:
we adopted the uniformed LBP (59 bins) to which contrast information - quantized into 5 levels - was added. Finally, we took advantage of color information by extracting the aforementioned LBP feature from three intra-channels (R,G,B) and three inter-channels (RG, RB, GB). The final LBP feature size is then p = 59 × 5 × 6 = 1770, which is high, but as we will see in the following, CCA can reduce it to a more reasonable size. According to our experience, the above LBP settings are a good balance between annotation performance and time complexity. As LBP extraction mainly requires addition operations, it can be achieved at a very high speed.
−1/2 ˆ −1/2 ˆ xx ˆ yy M=C Cxy C ∈ Rp×q
M can be decomposed by SVD as follows: M = UDm Vt
Founded by Hotelling in 1936 [6], the canonical correlation analysis (CCA) is a technique which maximizes the correlation between two linearly dependent signals while minimizing their sizes. CCA was first used for image annotation and retrieval by Hardoon et al. in [5].
4.1 Inputs of CCA Assume we are given a training set of N pairs of observations (xi , yi ), where xi ∈ Rp and yi ∈ Rq refer to the image and annotation feature vectors of the ith training sample respectively. Later on, we assume that all feature vectors corresponding to the training images are stored in the columns of the sample matrix X ∈ Rp×N = (x1 , . . . , xN ).
4.3
5.
RANDOM WALK WITH PRIORS ON CANONICAL CORRELATION SUBSPACE
5.1 Background and limitations of GCap method
4.2 CCA model calculation The goal of CCA is to find pairs of canonical directions Wx and Wy that maximize the correlation ρ between the ˜ and Wyt Y. ˜ The definition of the correlaprojections Wxt X tion is recalled in equation (2):
The training model in GCap [12] is represented by a 3layer undirected graph: i) the word layer whose nodes correspond to the keywords of the tagging vocabulary. ii) the image layer whose nodes relate to the training images. iii) the image region layer whose nodes embody the sub-areas of the training images which ideally correspond to the image objects. In the training phase, the image nodes are connected to their annotations by an “image-to-word” link. Each image is connected to its regions by “image-to-region” links that establish parent-to-child relationships between the image and its sub-areas. Finally, image regions are connected to each other across the whole data set based on their visual similarity: each region is linked to its kim nearest neighboring regions in the sense of a metric defined on the image feature space (“region-to-region” links).
(2)
ˆ yy Wy ˆ xx Wx Wyt C Wxt C
ˆ xx , C ˆ yy and C ˆ xy are the unbiased estimations of where C ˆ xx = the within-set and between-set covariance matrices: C 1 ˜ ˜t ˆ yy = 1 Y ˆ xy = 1 X ˜Y ˜ t ∈ Rq×q ; C ˜Y ˜t XX ∈ Rp×p ; C N −1
Outputs of CCA
Given two CCA projection matrices Wx ∈ Rp×m0x and Wy ∈ Rq×m0y , and some arbitrary image and annotation features x and y, the projection in the image CCA subspace is achieved as follows: xproj = Wxt x ˜ ∈ Rm0x , while in the CCA text space, it takes the form: yproj = Wyt y ˜ ∈ Rm0y .
Prior to the computation of the CCA projection model, one has to center the matrices X and Y and normalize them by the standard deviation across the samples as follows: ( ) ˜ ˆ z ) (ˆ ˆ z ) (ˆ Z= (z1 − m σz Ids )−1 , . . . , (zN − m σz Ids )−1 (1) ∑N s ˜ =X ˜ or Z ˜ = Y, ˜ m ˆ z = N1 where Z ˆz2 = i=1 zi ∈ R and σ ∑ N 2 s 1 ˆ z ) ∈ R with (z, s) = (x, p) or (z, s) = i=1 (zi − m N −1 (y, q), and Ids is the s × s identity matrix.
N −1
q×q
It is important to notice that the core computation of the CCA model - i.e. SVD in equation (3) and (4) - is independent from the number of training samples N which can be large if one considers the scale of image repositories on the Web. Instead, it only depends on the image and text feature sizes which are much smaller than N . In case of a large N , the bottleneck process in CCA is the computation ˆ xx , C ˆ yy and C ˆ xy which can of the covariance matrices C be carried out by parallel or grid computing to meet the requirements of Web-scale image collections.
The vector yi ∈ Rq refers to the caption of the ith image of the training set Imi . It is the output of a function mapping the caption of Imi to an indicator variable Gwk ∈ {0, 1} where wk is a word of the tagging vocabulary V and with Gwk = 1 if wk is an annotation of Imi , otherwise it equals ( )t 0. In such case, yi = Gw1 , . . . , Gwq where q denotes the size of V . All annotations vectors are stored in the columns of the sample matrix Y ∈ Rq×N = (y1 , . . . , yN ).
ˆ xy Wy Wxt C
(4)
where U ∈ R and V ∈ R are two orthonormal matrices( and Dm is a pseudo-diagonal matrix so that Dm = ) diag ρ21 , . . . , ρ2m ∈ Rp×q , with m = min (p, q). The diagonal elements ρ2j of Dm - which are referred to as singular values sorted in decreasing order - correspond to the squared correlation values of the canonical directions. The −1/2 ˆ xx CCA projection matrices are finally Wx = C U and −1/2 ˆ yy V. The canonical directions - or eigenvectors Wy = C - of both image and text spaces are stored as the columns of Wx and Wy respectively. As any subspace method, it is possible to only retain the canonical directions pertaining to the most significant m0 correlation values and consequently decrease the size of the projected features. p×p
4. CANONICAL CORRELATION ANALYSIS
ρ= √
(3)
N −1
∈ Rp×q . The maximization of ρ is realized by maximizing the coˆ xy Wy given the constraints Wxt C ˆ xx Wx = variance Wxt C
77
5.1.2
In the image annotation phase, an incoming test image is first appended to the training graph. This is realized by connecting each test image region to its kim nearest neighbors of the trained graph. Then, a random walk with restart (RWR) - beginning from the test image node - is performed to determine the most relevant words to annotate the test image. The RWR can be regarded as a Markov chain transition process biased towards the starting node, and is modeled by the following iterative equation: Un+1 = (1 − c)AUn + cV
Some word nodes might be connected to image nodes more often than others. Such terms relate to the most popular tags used in the training phase, and there is a natural bias towards them in the RWR process due to their prominence in the Markov transition matrix. This is an unwelcome effect as popular words would always be output by the tagging system, regardless the image to tag. Table 1 illustrates the frequency of words used in the training set of the Corel5k database described in section 6.1.1.
(5)
Popular words water sky tree people
where U is the Nnode -dimensional vector which represents the Markov transition state of all nodes of the graph (Nnode is the total number of nodes in the graph). A is the adjacency - or Markov transition - matrix which is populated with ones when a link is realized in the undirected graph. c is the restart probability and the Nnode -dimensional restart vector V is null, except at the entry of the test image where it is set to 1. In order to allow the convergence of equation (5) and ensure that all entries of U sum to one, the matrix A is first normalized. According to our experience and that of Tong et al. [14], the Laplacian normalization is the one that yields the best tagging results in the end. When the values of vector U have converged according to equation (5), the entries related to the word nodes are sorted by decreasing order, and the annotations corresponding to the top-n values are chosen to annotate the test image. In the following, we list the limitations of the scheme of Pan et al. [12].
Frequency 1004 883 854 670
Rare words jeep cougar race canoe
Frequency 1 1 1 1
Table 1: Frequency of popular and rare words used in Corel5k data set. Note the significant gap between the most popular words and the seldom used ones (1000:1). Balancing the link weight values between frequently and seldom used tags is a possible counter-measure to this problem.
5.2 Proposed counter-measures We address the aforementioned issues by resorting to the CCA technique to improve and simplify the construction of the graph which associates image and word nodes. The merit of introducing CCA in the graph lies in the two following aspects.
5.1.1 “Region-to-region” linkage errors The kim nearest image region nodes in the graph are connected based on visual similarity. However, whatever the region similarity, all “region-to-region” links have the same th constant weight. This is problematic as the kim neighbor, which could be somehow very different from the region query, would have the same influence as other nearer neighbors. If the “farthest” neighbor is very dissimilar to the query, an incorrect link would be made, which decreases the tagging quality in the end. As a result, only small values of kim can be used, which precludes from investigating longrange interactions at the region level. This fact is verified in [12] where the annotation accuracy starts to decline for values of kim superior to 3.
First, the distance in the CCA-projected image space will somehow tell us how visually and semantically similar image nodes are. Such characteristic - inherited from the high-level annotations of the training set - helps bridge the semantic gap and decreases linkage errors in the graph at the image level. Moreover, CCA enables the use of a Euclidean metric in the CCA-projected image space, which allows to fully take advantage of the speed capability of ONN search engines without lowering the accuracy of the linkage. Finally, as we deal with weakly3 tagged training images in this study, CCA best befits image and annotation information at a global level. Consequently, image features can be computed at the scale of the whole image and no segmentation is needed. This allows a significant cut in the computational workload and the simplification of the graph in which only image and word nodes are needed (the region nodes can be removed, see figure 1). As CCA is a subspace method, image features are also projected in a lower dimensional space. The population to be investigated in “image-to-image” linkage by the ONN search engine is then smaller and carried out in a low-dimensional space. It dramatically enhances the processing speed for training the graph and tagging new images.
The nearest neighbor search to connect regions is not scalable if a brute force approach is employed. As a consequence, it is desirable to resort to optimized nearest neighbor (ONN) search engines to fasten the process. In [11], the Approximate Nearest Neighbor (ANN2 ) engine based on kd-tree data structure is used. In a kd-tree, Ln norm must be used to partition the k-dimensional feature space into hyper-rectangles to optimize the search. However, such Ln metric is incompatible with the multi-form image features often used in automatic image annotation. For instance, in [3,11,12], color histograms, texture histograms and shape descriptors are merged together, which calls for more sophisticated pseudo-distances to compare images (entropy, chi-square, etc.). Since such pseudo-distances define manifolds that are inconsistent with kd-tree optimization, Ln norm must be used anyway to the detriment of the accuracy in the “region-to-region” linkage and the tagging quality. 2
Bias in “image-to-word” linkage
Second, the distance in the CCA-projected text space will somehow tell us how similar words are based on their 3
In “weak tagging” annotations are attached to an image without localization information. It is opposite to region labeling.
http://www.cs.umd.edu/˜mount/ANN/
78
CCA−projected image space
where dim ij is the Euclidean distance between image i and j measured in the CCA-projected image space of dimension m0x ; dtxt ij is the Euclidean distance between word i and j measured in the CCA-projected text space of dimension m0y ; α and β are parameters controlling the decrease rate of the functions.
Image feature space
I M A G E S T A G S
sea, water, ship, boat
sea, lighthouse, sky
To counter the bias of popular words learned in the training, we determine the weight between images and words by resorting to the Inverse Document Frequency (IDF) method. The latter sets a weight value to “image-to-word” links which is inversely proportional to number of times the considered word node is connected to image nodes. Consequently, in the graph building phase of the training, we set the weight between image i and word j as follows:
prop, jet, sky, plane
sea, water, waves
CCA−projected text space
Figure 3: Illustration of projections in CCA image and text spaces.
F reqmax − F reqj F reqmax − F reqmin (8) where γ is a parameter tuning the weight balance between popular and rare words, F reqmax is the occurrence frequency of the most popular word in the training set, F reqmin is the occurrence of the most seldom used word in the training set, and F reqj is the occurrence frequency of the j th word of the tagging vocabulary. Note that in [8], Liu et al. also used IDF to improve the quality of automatic image annotation. Unlike our proposal, the IDF technique in [8] does not intervene directly at the graph level to alleviate the bias towards high frequency tags in the RWR process. It is rather used with exogenous linguistic knowledge derived from WordNet [13] to filter out irrelevant tags from the outputs of a graphbased RWR procedure. As a result, it is a counter-measure to improve the consistency of the final output words, rather than a procedure to alleviate the problem of popular words learned in the training. wim−word (Imi , wordj ) = (1 − γ) + γ
visual impression. Akin to the “image-to-image” linkage procedure, we connect each word node of the graph to its ktxt nearest neighbor word nodes based on a metric defined on the CCA-projected text space. This way, we intend to reinforce the consistency among the words of the vocabulary to output annotations which are semantically more similar in the end. Such process is different from that of [8] where dictionary-based prior knowledge is used to increase the consistency of the tags. In synonymy hierarchy like in WordNet, only closely related terms can be correlated. As a result, the words “water” and “boat”, while being conceptually correlated, cannot be associated to each other using lexicon-based tools like WordNet. Instead, measuring the word similarity in the CCA-projected text space allows correlating concepts which are often depicted simultaneously on the training images. In table 2, we provide some examples of word correlation in the CCA space based on the Corel5k data set described in section 6.1.1. As such trainingQuery word boats leaf horizon plane
6.
Top-3 nearest neighbors sailboats, lighthouse, ships plants, branch, stems trail, peaks, lake prop, helicopter, eagle
6.1
Two image data sets were used to assess the image autotagging quality of the present scheme against these of the state-of-the-art. First, we employed the Corel5k database4 which is made of 5,000 color images annotated with 371 English keywords [3] (the image size is 768 × 512 pixels). Typically, 4,500 images are used for training, while 500 images are used for testing. According to the Corel5k protocol, the schemes will be evaluated based on the first 5 tags assigned to each test image. To evaluate per-word performance, the 260 keywords that are actually used in the ground truth of the testing set are considered. While Corel5k database has been the reference benchmark for computer scientists in the past years, it has the following limitations: i) images are taken by professional photographers, which is far from being the case in real world applications. ii) the visual and semantic information contained in the images is not diverse. iii) the most outstanding problem is that the testing set is very similar to the training set. This makes the performance evaluation over-optimistic and biased.
driven prior knowledge is already represented in the “imageto-word” relationships of the graph, its incorporation in the “word-to-word” linkage is intended to reinforce it. Figure 3 illustrates the benefits of CCA in both image and text spaces in order to narrow the semantic gap and construct a text metric to correlate annotations. In order to investigate longer interaction ranges at the image and word levels, i.e. higher values of kim and ktxt , we set the weight of “image-to-image” and “word-to-word” links as a decreasing function of the distance measured in the CCA-projected space: ( ) wim−im (i, j) = exp −dim (6) ij /α
4
wword−word (i, j) = exp −dtxt ij /β
)
Experimental protocol
6.1.1 Image database
Table 2: Examples of “word-to-word” relationships in the CCA-projected text space built from Corel5k data set.
(
EXPERIMENTAL RESULTS
This publication includes images from the Corel Stock Photo Library images which are protected by the copyright laws of the U.S., Canada and elsewhere. Used under license.
(7)
79
Because of the aforementioned issues, more and more researchers carry out experiments on more challenging and diverse photos such as these available on the Web [7]. As a result, we also built an image data set made of photos gathered from the Internet to evaluate the performance of our approach. Using the Flickr API, we downloaded 11,981 color photographs stored in Flickr’s repository in 2007. 8,979 images are used for training while 3,002 photos are employed for testing and the tagging vocabulary is made of 298 English words. Per-word performance is evaluated based on the 292 words used in the testing ground truth. Unlike the Corel5k database, Flickr12k has the following features: i) images are taken by average camera users, i.e. non-expert photographers. ii) the visual and semantic diversity of the images is high. iii) there are errors and inconsistencies in the annotation ground truth as the users are not experts. In the Flickr12k protocol, we decided to evaluate the proposed tagging scheme based on the first 15 tags assigned to each test image.
words were used in the testing phase and represents the number of terms effectively learned by the system. Finally, we also measure the processing time t which is needed to tag one image on the average over the testing set. The time t is reported in seconds on the basis of a one-core implementation. It covers all operations needed to tag an image, including the cost of feature extraction.
6.1.3
6.1.2 Performance indicators
6.2
In this article, traditional performance indicators are used. They are per-word precision&recall (eq. 9-10) and per-image precision&recall (eq. 11-12). pwprecision (w) = ImC (w) /ImAU T O (w)
(9)
pwrecall (w) = ImC (w) /ImH (w)
(10)
(11)
pirecall (Im) = W C (Im) /W H (Im)
(12)
where W C (Im) is the number of words correctly assigned to image Im by the system, W AU T O (Im) is the number of words assigned to image Im by the system, and W H (Im) is the number of human-produced annotations for image Im (ground truth). In case a word w is never used by the image tagging scheme to annotate test images, its per-word precision is not computable as the denominator of equation (9) is zero. By convention, we set the precision of the word to zero when such situation occurs. To derive the global per-word and per-image indicators, the individual scores are averaged over the whole tagging vocabulary and testing image set: P Wp/r =
q 1∑ pwprecision/recall (wi ) q i=1
The full configuration of EGCap (eq. (6-7-8)) allows improving performances compared to EGCap-LBP-CCA. The enhancement is however more subtle as it ranges from 4% to 12% regarding per-word and per-image scores. The most remarkable observation is the higher increase in per-word recall than in per-word precision. It would confirm that the proposed counter-measures not only enhance the accuracy by outputting more consistent tags, but also allow the use of more diverse words to annotate images (this fact is verified by the increase of nnzr ). Having a high per-word recall is especially interesting for the image search task as more relevant images would be returned upon keyword queries. Considering the P WF 1 measure, the full configuration of EGCap outperforms the scheme of Nakayama et al. [10] while having a similar processing time5 . The time complexity of the Proba CCA scheme is O (N × (m0x + q)) ' 410N according to the parameters used in [10]. The complexity of EGCap
(13)
where q is the size of tagging vocabulary. P Ip/r =
1 Ntest
N test ∑
piprecision/recall (Imj )
Results
In table 3, we compare the performance of the proposed scheme EGCap to that of the state-of-the-art on the Corel5k benchmark. We also provide results of EGCap with LBP features only, after CCA processing, and with all proposed novelties (CCA + eq. (6-7-8)). The baseline EGCap-LBP is similar to the GCap approach [12], except that there is no image segmentation and LBP features are used. We notice that CCA projection at the image level drastically improves performance indicators. Indeed, compared to EGCap-LBP, EGCap-LBP-CCA enhances by 40% to 50% per-word indicators, while it improves per-image scores by 26% (relative increase). EGCap-LBP-CCA outperforms state-of-the-art methods, except that of Nakayama et al. (Proba CCA, [10]) for which results are similar. The number of words learned by EGCap-LBP-CCA increased by 22 while it is lower than that of SML. Note that the processing speed of EGCapCCA is higher than that of EGCap-LBP. This is due to the smaller size of image feature vectors after CCA projection (m0x = 60), which alleviates the computational burden in the NN search to append test images.
where ImC (w) is the number of images correctly annotated with word w by the system, ImAU T O (w) is the number of images annotated with word w by the system, and ImH (w) is the number of human-annotated images with word w (ground truth). piprecision (Im) = W C (Im) /W AU T O (Im)
Cross-validation for parameter tuning
In order to tune the parameters of the proposed scheme - namely c, kim , ktxt , α, β, γ, m0x , and m0y - we carried out a 5-fold cross-validation procedure on the training set of Corel5k and Flickr12k databases. Given a training set, we selected 5 different validation sets made of 450 images each. Optimal parameters are the ones that maximize P WF 1 + P IF 1 on the average computed over the 5 validation subsets. Once the optimal parameters are obtained, they are used to run the tagging scheme on the testing set to get the final performance values. Such procedure is similar to that used by Nakayama et al. [10].
(14)
j=1
where Ntest is the number of images in the testing set. The following F1 measures are also used to tune parameters: 2P Wp P Wr 2P Ip P Ir P WF 1 = P Wp +P and P IF 1 = P Ip +P . Wr Ir
5
EGCap was implemented in C++ on a 2.33 GHz CPU machine with 2 Go RAM (the ANN engine was used to fasten the “image-to-image” linkage)
We define nnzr as the number of words with non-zero recall. Such performance indicator nnzr indicates how many
80
is in O (2 × N × niter × (¯ n + kim + 1)) ' 640N , where niter is the number of iterations needed for the RWR to converge (20) and n ¯ is the average number of tags per training image (4 in Corel5k). We notice that the time complexity ratio between Proba CCA and EGCap corresponds to the difference in processing time reported in table 3. Besides, EGCap can achieve faster tagging speed if kim is reduced. In table 4, we compare the baseline of EGCap to its full configuration on the Flickr12k data set. As observed on Corel5k, the meaMethod
Ref.
P Wp
P Wr
P Ip
P Ir
nnzr
t in s
eq.
0.29
0.37
0.41
0.58
144
0.21
LBP + CCA
0.27
0.33
0.39
0.56
132
0.21
EGCap
LBP
0.18
0.23
0.31
0.44
110
0.27
Proba CCA
[10]
0.30
0.32
-
-
-
0.16
AGAnn
[8]
0.24
0.29
-
-
-
-
SML
[2]
0.23
0.29
-
-
137
1620
GCap
[12]
-
-
0.37
-
-
-
a
EGCap
be filtered out and more consistent labels belonging to the snowscape&animal topics were proposed by the most complete version of EGCap. In column four, we acknowledge that the tags of the full EGCap which do not match the ground truth are more relevant than these of EGCap-LBP and EGCap-LBP-CCA. In column five, there is a significant improvement between the baseline EGCap-LBP and the full version of EGCap where the top-3 suggested words are the same as these of the ground truth. Note that there is no significant difference with EGCap-CCA in this case, except that the latter output “tree” which seems less relevant than “frozen” regarding the information depicted on the image. In figure 5, we illustrate examples of annotations on Flickr images. In column two, we observe that the full version of EGCap output tags related to flowers and colors, while these of the baseline scheme are all irrelevant. In column three, the irrelevant tag “water” could be moved to a lower position in the ranking order of the keywords while “street” could be successfully predicted. In column four, we show that paintings can also be handled by EGCap as the full version of the system could predict keywords consistent with the depicted contents, even if they do not match the ground truth (e.g. “graffiti, “portrait”).
(6-7-8) b
EGCap
c
a
c = 0.12, kim = 11, ktxt = 2, α = 0.6, β = 0.05, γ = 10, m0x = 60, m0y = 39.
7.
b
In this paper, we presented a simple and self-consistent graph-based method to achieve automatic image annotation. Based on the scheme of Pan et al. [12], EGCap takes advantage of the canonical correlation analysis (CCA) technique to shorten the semantic gap occurring in the image space, and define a metric in the text space to correlate words directly in the graph. The combination of the enhanced graph with some link weighting techniques dependent on IDF and CCA metric was shown to effectively improve the tagging quality. The use of lightweight LBP features, the absence of segmentation and the reduced size of feature vectors after CCA projection allowed to perform image auto-tagging in real time. Experimental results on Corel5k showed that EGCap reached top-level performance results with a processing speed similar to that of the fastest scheme of the moment. Future works will be dedicated to the evaluation of EGCap for the image retrieval task and the incorporation of less empirical link weighting functions.
c
c = 0.14, kim = 4, m0x = 60. c = 0.19, kim = 6.
Table 3: Performance results on Corel5k - EGCap vs. state-of-the-art. Number of training images N = 4500, vocabulary size q = 371. sures we proposed to enhance GCap are effective to improve the tagging quality. Note that the processing time is higher as there are more training image nodes in the graph. Besides, Flickr images are in general larger than these of Corel, which increases the feature extraction time. Method a
EGCap
b
EGCap
Ref.
P Wp
P Wr
P Ip
P Ir
nnzr
t in s
eq. (6-7-8)
0.32
0.23
0.35
0.37
250
0.43
LBP
0.27
0.11
0.29
0.29
182
0.47
CONCLUSION
a
c = 0.26, kim = 14, ktxt = 2, α = 0.6, β = 0.05, γ = 10, m0x = 60, m0y = 39.
8.
b
The authors would like to thank Tanakawho, Michael Cameron and Suzanne Limbert for providing the Flickr images displayed in figure 5.
c = 0.19, kim = 6.
Table 4: Performance results of EGCap on Flickr12k. Number of training images N = 8979, vocabulary size q = 298.
9.
ACKNOWLEDGMENTS
REFERENCES
[1] D. Blei and M. Jordan. Modeling annotated data. In Proc. SIGIR’03, 2003. [2] G. Carneiro, A. B. Chan, P. J. Moreno, and N. Vasconcelos. Supervised learning of semantic classes for image annotation and retrieval. IEEE Trans. Pattern Anal. Mach. Intell., 29(3):394–410, 2007. [3] P. Duygulu, K. Barnard, J. de Freitas, and D. A. Forsyth. Object recognition as machine translation: Learning a lexicon for a fixed image vocabulary. In Proc. European Conference in Computer Vision (ECCV’02), 2002.
6.3 Examples of image annotation In figure 4, we illustrate the benefits of EGCap on a few images extracted from Corel5k. In the second column, we notice that the joint use of IDF and “word-to-word” linkage is effective to lower the rank of the mistaken tag “water” which belongs to the most popular words learned in the training phase. Instead, the more relevant and correct tag “fox” is output. In column three, whatever the EGCap configuration used, only the tag “snow” is correct. However, note that irrelevant terms like “water”, “sky”, “grass” could
81
Ground truth
fox, snow, tree, wood
lynx, snow
buildings, clothes, shops, street
frost, fruit, ice
EGCap: LBP
festival, street, people, school, arctic
frost, tree, sky, grass, water
street, buildings, shops, people, tree
leaf, tracks, fruit, plants, cars
EGCap: LBP + CCA
water, rocks, grass, birds, tree
head, dog, snow, wolf, water
street, buildings, cars, mast, sign
fruit, frost, ice, snow, tree
EGCap: eq. (6-7-8)
birds, den, fox, water, tree
snow, head, bear, polar, tree
street, buildings, sign, cars, shops
frost, fruit, ice, frozen, snow
Figure 4: Examples of annotations output by EGCap on images extracted from the testing set of Corel5k database. The top-5 auto-tags are displayed; these matching the ground truth are in bold.
Ground truth
closeup, macro, color, collage, yellow
graffiti, street, art, streetart, Atlanta
drawing, painting, wood, city, art
EGCap: LBP
woman, water, white, summer, street
water, girl, art, white, summer
water, white, UK, summer, street
EGCap: eq. (6-7-8)
flower, macro, color, nature, green
art, city, water, street, white
art, family, portrait, city, graffiti
Figure 5: Examples of annotations output by EGCap on images extracted from the testing set of Flickr12k database. The top-5 auto-tags are displayed; these matching the ground truth are in bold. [4] S. L. Feng, R. Manmatha, and V. Lavrenko. Multiple Bernoulli relevance models for image and video annotation. In Proc. IEEE Computer Society Conference on Computer Vision and Pattern Recognition (CVPR’04), 2004. [5] D. Hardoon, C. Saunders, S. Szedmak, and J. Shawe-Taylor. A correlation approach for automatic image annotation. In X. Li, O. Zaiane, and Z. Li, editors, Proc. of Second International Conference on Advanced Data Mining and Applications, ADMA, pages 681–692, China, 2006. [6] H. Hotelling. Relations between two sets of variants. Biometrika, 28:321–377, 1936. [7] J. Li and J. Z. Wang. Real-time computerized annotation of pictures. IEEE Trans. Pattern Anal. Mach. Intell., 30(6):985–1002, 2008. [8] J. Liu, M. Li, W.-Y. Ma, Q. Liu, and H. Lu. An adaptive graph model for automatic image annotation. In MIR’06: Proceedings of the 8th ACM International Workshop on Multimedia Information Retrieval, pages 61–70. ACM, 2006. [9] T. M¨ aenp¨ a¨ a. The local binary pattern approach to texture analysis - extensions and applications. PhD thesis, Infotech Oulu and Department of Electrical and Information Engineering, University of Oulu, 2003. [10] H. Nakayama, T. Harada, Y. Kuniyoshi, and N. Otsu. Ultra high speed image annotation/retrieval method by learning the conceptual relationship between
[11]
[12]
[13]
[14]
82
images and labels. In IEICE tech. report, volume 107 of PRMU2007-147, pages 65–70, December 2007. J.-Y. Pan, H. Yang, C. Faloutsos, and P. Duygulu. Knowledge Discovery and Data Mining: Challenges and Realities with Real World Data, chapter Cross-modal Correlation Mining Using Graph Algorithms, page 274. Information Science Reference, June 2006. J.-Y. Pan, H.-J. Yang, C. Faloutsos, and P. Duygulu. GCap: Graph-based automatic image captioning. In Proc. of the 4th International Workshop on Multimedia Data and Document Engineering (MDDE), in conjunction with Computer Vision Pattern Recognition Conference (CVPR’04), 2004. M. Pucher. Performance evaluation of wordnet-based semantic relatedness measures for word prediction in conversational speech. In Proc. of Sixth International Workshop on Computational Semantics, Tilburg, Netherland, 2005. H. Tong, C. Faloutsos, and J.-Y. Pan. Fast random walk with restart and its applications. In Proc. of the Sixth International Conference on Data Mining, ICDM’06, pages 613–622, Washington, DC, USA, 2006. IEEE Computer Society.