Automatic Interconnection Rectification for SoC Design. Verification Based on the Port Order Fault Model. Chun-Yao Wang, Shing-Wu Tung, and Jing-Yang Jou.
104
IEEE TRANSACTIONS ON COMPUTER-AIDED DESIGN OF INTEGRATED CIRCUITS AND SYSTEMS, VOL. 22, NO. 1, JANUARY 2003
[16] K. J. Nowka and T. Galambos, “Circuit design techniques for a Gigaherz integer microprocessor,” in Proc. IEEE/ACM Int. Conf. Computer Design, 1998, pp. 11–16. [17] K. L. Shepard and V. Narayanan, “Noise in deep submicron digital design,” in Proc. IEEE/ACM Int. Conf. Computer-Aided Design, 1996, pp. 524–531. [18] J. Silverman, N. Aoki, D. Boerstler, J. L. Burns, S. Dhong, A. Essbaum, U. Ghoshal, D. H. P. Hofstee, K. T. Lee, D. Meltzer, N. Hung, K. Nowka, S. Posluszny, O. Takahashi, I. Vo, and B. Zoric, “A 1.0-GHz single-issue 64-bit PowerPC integer processor,” IEEE J. Solid-State Circuits, vol. 33, pp. 1600–1608, Nov. 1998. [19] K. Venkat, L. Chen, I. Lin, P. Mistry, P. Madhani, and K. Sato, “Timing verification of dynamic circuits,” IEEE J. Solid-State Circuits, vol. 31, pp. 452–455, Mar. 1996. [20] G. Yee and C. Sechen, “Clock-delayed domino for adder and combinational logic design,” in Proc. IEEE/ACM Int. Conf. Computer Design, Oct. 1996, pp. 332–337. , “Dynamic logic synthesis,” in Proc. IEEE Custom Integrated Cir[21] cuits Conf., May 1997, pp. 345–348. [22] K. Yun and A. E. Dooply, “Optimal evaluation clocking of self-resetting domino pipelines,” in Proc. IEEE. Conf. Advanced Research VLSI, 1999, pp. 121–124. [23] M. Zhao and S. S. Sapatnekar, “Timing-driven partitioning and timing optimization of mixed static-domino implementations,” IEEE Trans. Computer-Aided Design, vol. 19, pp. 1322–1336, Nov. 2000.
Automatic Interconnection Rectification for SoC Design Verification Based on the Port Order Fault Model Chun-Yao Wang, Shing-Wu Tung, and Jing-Yang Jou
Abstract—Embedded cores are being increasingly used in large system-on-a-chip (SoC) designs. The high complexity of SoC designs lead the design verification to be a challenge for system integrators. This paper presents an automatic interconnection rectification (AIR) technique based on the port order fault model to detect, diagnose, and correct the misplacements of interconnection that occurred in the integration of a SoC design automatically. The experiments are conducted on combinational and sequential benchmarks. Experimental results show that the AIR can correct the misplaced interconnection exactly within reasonable efforts and, therefore, accelerates the integration verification of SoC designs. Index Terms—Automatic interconnection rectification (AIR), characteristic vector (CV), correction, detection, diagnosis, port order fault (POF), system-on-a-chip (SoC), undetected port sequence (UPS), verification.
I. INTRODUCTION Spurred by process technology leading to the availability of more than one million gates per chip and more stringent requirements upon time-to-market and performance constraints, system-level integration and platform-based design [1] are evolving as a new paradigm in system designs. A multitude of components that are needed to implement the required functionality make it hard for a company to design and manufacture an entire system in time and within reasonable
Manuscript received March 18, 2002; revised June 20, 2002. This work was supported in part by the R.O.C. National Science Council under Grant NSC89-2215-E-009-073. This paper was recommended by Associate Editor K. Chakrabarty. The authors are with the Department of Electronics Engineering, National Chiao Tung University, Hsinchu 300, Taiwan, R.O.C. (e-mail: {wcyao; swtung; jyjou}@eda.ee.nctu.edu.tw). Digital Object Identifier 10.1109/TCAD.2002.805723
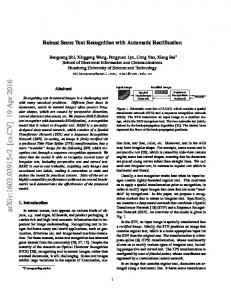
Fig. 1.
Reconvergent paths model for both verification and testing.
cost. Hence, design reuse and reusable building blocks (cores) trading is becoming popular in the system-on-a-chip (SoC) era. However, present design methodologies are not enough to deal with cores which come from different design groups and are mixed and matched to create a new system design. In particular, verifying whether a design satisfies all requirements is one of the most difficult tasks. Verification is a process used to demonstrate the functional correctness of a design. Testing is a process that verifies whether the design was manufactured correctly. Fig. 1 shows the reconvergent paths model for both verification and testing [2]. The purpose of the verification is to ensure that a design meets its functional intent. But during testing, the finished silicon is reconciled with the netlist that was submitted for manufacturing. Therefore, when a design is claimed to be fully tested, i.e., 100% fault coverage, under a fault model, such as stuck at fault (SAF) model, that means it is manufactured correctly. However, designers still cannot guarantee that the chip satisfies the design specification if they do not verify it properly before manufacturing. The chip may be manufactured correctly but designed incorrectly. Thus, designers offer about 70% of their efforts to verification. But design verification is still on the critical path of the design flow [2]. Usage of cores divides the IC design community into two groups: core providers and system integrators. In traditional system-on-board (SoB) design, the components that go from provider to system integrator are ICs, which are designed, verified, manufactured, and tested. The system integrator verifies the design by using these components as fault-free building blocks. SoB verification is limited to detecting faults in the interconnection among the components. Similarly, in SoC design, the components are cores. The system integrator verifies the design by using the cores as design error free building blocks. SoC verification focuses on the interaction among these pre-verified cores. This higher level of abstraction decreases the complexity of design verification on a system chip and reduces the time spent on design verification of the entire system. The focus of core-based design verification should be on how the cores communicate with each other [3]. However, before the interface verification, the interconnection between the cores in an SoC have to be verified first. This is because the SoC integrator has to connect a large number of ports (hundreds or even thousands of ports) in an SoC. The likelihood of interconnection misplacements between the cores is high. Furthermore, the correct interconnection between the cores is the minimum requirement to verify the interface protocols. If the interconnections between the cores are misplaced, the process of the verification on the interface between the cores will be in vain. Thus, the interconnection verification can be conducted as the first step to the interface verification between the cores in an SoC design. Fig. 2(a) and (b) shows the schemes to demonstrate the processes of interconnection testing and interconnection verification, respectively. In the interconnection testing, the test engineers focus on the success of implementation of interconnected wires between the block1 and
0278-0070/03$17.00 © 2003 IEEE
IEEE TRANSACTIONS ON COMPUTER-AIDED DESIGN OF INTEGRATED CIRCUITS AND SYSTEMS, VOL. 22, NO. 1, JANUARY 2003
(a)
105
(b)
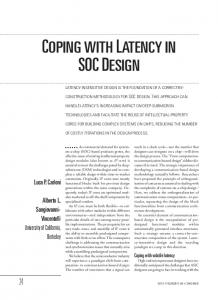
Fig. 2. Schemes of (a) interconnection testing and (b) interconnection verification.
block2. The testing patterns and corresponding responses are applied and observed at the ends of the interconnects to check whether the interconnects are manufactured correctly. On the other hand, in the interconnection verification, the system integrators verify whether the interconnection between the block1 and block2 are located in the correct ports. The verification patterns and corresponding responses are applied and observed in primary inputs (PIs) and primary outputs (POs) of the integrated design instead. By creating the testbenches at a higher level, a connectivity-based design fault model, port order fault (POF), is proposed [4] and the corresponding automatic verification pattern generation (AVPG) is developed [5], [6]. The AVPG algorithms are effective in generating the verification pattern set for detecting the misplacements of interconnection in an SoC design. However, the diagnosis and correction issues on the misplaced interconnection are even more important for SoC verification. Thus, in this paper, we present an automatic interconnection rectification (AIR) algorithm, which not only detects the erroneous interconnection among the cores, but also diagnoses and corrects them automatically during the integration of an SoC design. Traditional diagnosis and correction algorithms in the logic level can be divided into two categories with respect to the underlying techniques: those based on symbolic techniques [7]–[11] and those based on simulation techniques [12]–[15]. The approaches based on symbolic techniques can return valid correction and handle circuits with multiple errors well, however, they are not applicable to circuits that have no efficient ordered binary decision diagram (OBDD) [16] representation. Thus, to verify the interconnection among the IP cores with all description levels (soft, firm, and hard cores) embedded into a system, the AIR algorithm has to deal with IP cores that are described in different levels, for example, logic level, register transfer (RT) level, or even behavioral level. Consequently, the symbolic approach is inadequate to this application and the simulation-based AIR algorithm is presented. On the other hand, the simulation-based design error diagnosis and correction techniques in the logic level locate the design errors from the erroneous POs by backtracking processes via the sensitized paths. However, without knowing the internal structure of IP cores, the backtracking methods are not applicable to the AIR algorithm. The only information obtained from the IP cores is the functional outputs by the patterns simulation, or the simulation model. Thus, the AIR simulates the design with the valid verification patterns, which are generated by AVPG [5], [6]. Then it compares the simulation results in POs with the expected ones to detect the possibly misplaced ports. Finally, the identified misplaced ports are switched to rectify the interconnection. In [15], Pomeranz et al. proposed an error correction algorithm for macro-based designs, which considered two error classes, macro errors and interconnection errors. This approach can identify the macro errors and the interconnection errors in the macro-based designs by using the error counts technique. However, for interconnection errors, it cannot
indicate the correct interconnection for further correction. In the AIR algorithm, since the IP cores are assumed to be preverified, it does not consider the macro errors. For the interconnection errors, though, it not only detects, but also diagnoses and corrects the erroneous interconnection among the cores automatically during the integration of an SoC design. The AIR is integrated into the SIS [17] environment. Experiments are conducted on combinational and sequential benchmarks, such as ISCAS-85, ISCAS-89, MCNC, and ITC-99 benchmarks. Experimental results show that the AIR can exactly rectify the misplaced interconnection in an SoC design. The remainder of this paper is organized as follows. The port order fault (POF) model and some relevant definitions are introduced in Section II. The AIR algorithm is presented in Section III. Section IV presents experimental results. Section V concludes the paper. II. PRELIMINARY The POF model belongs to the group of pin-faults models [18], which assumes that a faulty cell has at least two I/O ports misplaced. It also assumes that the components are fault free and only the interconnection among the components could be faulty. There are three types of POFs [4]. Definition 1: The type-I POF is at least one output misplaced with an input. The type-II POF is at least two inputs misplaced. The type-III POF is at least two outputs misplaced. Example 1: A fault-free 4-bit adder is shown in Fig. 3(a). The function of the adder is fC out; S (3 : 0)g = A(3 : 0)+B(3 : 0)+Cin. An example of the type-I POF is shown in Fig. 3(b). Input B0 is misplaced with output S0. Fig. 3(c) shows an example of the type-II POF. Input A(3 : 0) are misplaced. Fig. 3(d) shows an example of the type-III POF. Output S(3 : 0) are misplaced. It has been proven that the type-II POF dominates the other two types of POFs [5]. Hence, in this paper, the AIR focuses on the type-II POF solely. Definition 2: A port sequence is an input port numbers permutation that indicates the relative positions among these input ports. Definition 3: The fault-free port sequence (FFPS) is a port sequence where none of the input ports is misplaced. For an N -input core, the input ports are numbered from 1 to N . The number of the input port numbers permutation is N ! and these N ! permutations represent the N ! port sequences of the core. Except for the FFPS, the remaining (N ! 0 1) port sequences represent the core with some particular POFs and are called faulty port sequences (FPSs). In this paper, the POFs and the FPSs are used exchangeably. Example 2: Given a 4-input core, the input ports are numbered from 1 to 4. Any input port numbers permutation is a port sequence of the core. It has 4! port sequences totally. The only one FFPS is 1234, the remaining (4! 0 1) port sequences are FPSs. The FPS 1423 represents the port 4 of the prior core IP1 is connected to the location of port 2
106
Fig. 3.
IEEE TRANSACTIONS ON COMPUTER-AIDED DESIGN OF INTEGRATED CIRCUITS AND SYSTEMS, VOL. 22, NO. 1, JANUARY 2003
(a)
(b)
(c)
(d)
POF model examples.
(a)
(b)
Fig. 4. Schematic representation of (a) FFPS 1234 and (b) FPS 1423.
of IP2, the port 2 of IP1 is connected to the location of port 3 of IP2 and the port 3 of IP1 is connected to the location of port 4 of IP2. The schematic representations of FFPS 1234 and FPS 1423 are shown in Fig. 4(a) and (b), respectively. The undetected port sequences (UPSs) representation used in the AVPG [5], [6] is to implicitly represent the UPSs remained in the fault set. Since it is also used in the AIR algorithm, we introduce it here briefly. The detailed description can be found in [5]. We use Example 3 to demonstrate this implicit UPSs representation. Example 3: Given an 8-input core, the input ports are numbered from 1 to 8. The UPSs representation (12345678) represents the UPSs that were caused by all possible misplacements among the port numbers in the same group, i.e., port 1 to port 8. The number of undetected POFs is 8! 0 1 and the 1 in the 8! 0 1 accounts for the fault-free port sequence. The UPSs representation (125)(4)(3678) indicates the UPSs that were caused by all possible misplacements among the port numbers 1, 2, and 5 and/or all possible misplacements among the port numbers 3, 6, 7, and 8. The number of the undetected POFs is 3!21!24!01. Please note that the port number 4 is the only one element in the second group. It means that the port sequences whose port number 4 was in the wrong position are not represented by this UPSs representation. The order of the groups in the UPSs representation is irrelevant, as is the order of the numbers in each UPSs group. For example, the UPSs (125)(4)(3678) can also be expressed as (4)(215)(8763). The UPS representation (1)(2)(3)(4)(5)(6)(7)(8) has eight groups and each group has only one element, therefore, no misplacement could have occurred in each group. The number of the undetected POFs is 1! 2 1! 2 1! 2 1! 2 1! 2 1! 2 1! 2 1! 0 1 = 0. Hence, (1)(2)(3)(4)(5)(6)(7)(8) represents 8! 0 1 POFs are all detected. If the UPSs representation is induced from (12345678) to (1)(2)(3)(4)(5)(6)(7)(8), all POFs are detected.
Fig. 5. Abbreviations and the corresponding full titles.
For better representation, Fig. 5 lists the abbreviations and the corresponding full titles of the terminologies used in the paper. III. AIR ALGORITHM A. AIR Overview The input to the AIR is the simulation model of an IP core, which is given by the core providers and is used for verifying the functionality of the core without revealing the design expertise. The four stages of AIR are pattern generation, fault detection, fault diagnosis, and fault correction as shown in Fig. 6. The general steps of each stage are also shown in this figure. In addition to these four stages, an instantaneous UPSs representation is associated with the AIR. This UPSs representation can indicate the currently remaining UPSs and guides the generation of further verification patterns. If the UPS is empty, the AIR is terminated and the interconnection in the integrated design is correct. Definition 4: The initial UPSs are denoted as 50 , the remaining UPSs after the verification patterns set Pi is applied to verify the interconnection are denoted as 5i . In the pattern generation stage, when a pattern set Pi is selected as the verification pattern set, some FPSs will be detected by Pi and the
IEEE TRANSACTIONS ON COMPUTER-AIDED DESIGN OF INTEGRATED CIRCUITS AND SYSTEMS, VOL. 22, NO. 1, JANUARY 2003
Fig. 6.
Fig. 7.
107
AIR flow.
Relationship of
Finally, in the fault correction stage, the identified misplaced ports are exchanged. The intention of the fault diagnosis and correction stages is to rectify the FPS � to �0 that 2 UPSs 5i . However, the diagnosis and correction stages usually cannot accomplish it in one iteration. Thus, the corrected FPS �0 has to be verified (detection, diagnosis, and correction) by Pi again until the fault effect disappears after the fault detection stage. At this time, the corrected FPS �0 2 UPSs 5i . These iterative procedures are presented with bold lines in the AIR flow as shown in Fig. 6. If the corrected FPS �0 is not the FFPS yet, it will be detected and corrected by the other verification patterns Pk , where k > i, in the subsequent iterations. Please note that since the FPS � will be corrected to one that 2 UPSs 5i and UPSs 5i will be reduced to 5t = FFPS eventually, we can claim that the FPS � will be rectified to the FFPS at the end of AIR.
( ) and remaining UPSs 5 .
, FPSs
corresponding UPSs will be reduced from 5i01 to 5i . Then the pattern generation stage generates further verification patterns in the next iteration according to the remaining UPSs 5i . Thus, each Pi corresponds to a set of FPSs and is responsible for detecting them. The FPSs which are detected by Pi are denoted as FPSs(Pi ). The relationship of Pi , FPSs(Pi ) and the remaining UPSs 5i is shown in Fig. 7. In Fig. 7, the initial UPSs are denoted as 50 and we assume the pattern set Pi01 is generated before Pi . After P1 is generated and applied, the remaining UPSs are 51 . After the last pattern set Pt is generated and applied, the remaining UPSs is 5t and it is the FFPS. The union of FPSs(Pi ) satisfies the following identity:
t i=1
F P Ss (Pi ) [ F F P S = 9
(1)
where 9 is the universal set of N ! port sequences. Equation (1) presents that N ! 0 1 FPSs are composed of FPSs(Pi ) disjointedly. The port sequence � of the real interconnection of the integrated design is one of N ! port sequences. If the integrated design is qualified by applying all verification pattern sets in the fault detection stage, the interconnection is the FFPS. However, if the integrated design is qualified by Pj but failed by Pi , where j < i, in the fault detection stage, then the port sequence � 2 FPSs(Pi ). At this time, the fault diagnosis stage is conducted to identify the misplaced ports.
B. Pattern Generation Definition 5: For an N -input combinational core, the exhaustive pattern set is defined as 8N . The size of 8N is the number of patterns in 8N , is denoted as j8N j and j8N j equals 2N . Definition 6: The set that consists of all patterns with m 1s and N , where m 2 [0; 1; 2; . . . ; N 0 1; N ]. (N 0 m) 0s is denoted as 2m N N and is denoted as j2Nm j The size of 2m is the number of patterns in 2m
and j2N m j equals
N N where m m
= N !=(m!(N 0 m)!).
The following paragraphs are going to introduce the three steps in the pattern generation stage: fault activation, fault propagation, and UPSs calculation. a) Fault Activation: Fault activation is the most important procedure in the pattern generation stage. If the fault effect is not activated, it surely cannot be propagated out. To activate a POF, the logic assignments of the corresponding input ports cannot all be the same. For example, to activate the FPS 1243, the assignments of port 3 and port 4 have to be different, either port 3 is assigned 0, port 4 is assigned 1, or vice versa. All N ! 0 1 POFs have to be activated in the pattern generation stage. The following theorem states the completeness of the POF activation. N can activate all (N ! 0 1) POFs where Theorem 1: 2m m 2 [1; 2; . . . ; N 0 2; N 0 1]. Proof: Please refer to [5].
108
IEEE TRANSACTIONS ON COMPUTER-AIDED DESIGN OF INTEGRATED CIRCUITS AND SYSTEMS, VOL. 22, NO. 1, JANUARY 2003
Fig. 8. Simulation outputs of applying
2.
b) Fault Propagation: The simulation results of the applied patterns are observed to determine which activated POFs are propagated to POs. The fault effects are propagated to POs if there exists different responses among these input patterns. c) UPSs Calculation: If the verification pattern set Pi is generated, we have to figure out the remaining UPSs 5i to guide the generation of further verification patterns. The detailed description of this step is presented within the following example. We use an example to demonstrate the details of pattern generation stage (fault activation, fault propagation, and UPSs calculation). This example will be used to demonstrate the fault detection, fault diagnosis, and fault correction stages as well as in the subsequent sections. Given an 8-input core, according to the UPSs representation, the initial UPSs 50 are (12345678). The simulation results of 281 are shown in Fig. 8 and are represented in symbolic output representation. The simulation results depend on the functionality of the core. The patterns with the same output are grouped into one set. 218 patterns can be grouped into two sets, S 1 and S 2, as shown in Fig. 8 (fault activated and propagated). When we select the smaller set S 1 as the verification pattern set P1 , the corresponding remaining UPSs 51 have to be derived as well. The following paragraphs describe how to calculate the remaining UPSs 5i when Pi is selected. Definition 7: Given a set of patterns S with the same length, we count the number of digits 1 in the same bit position to form a vector with the same length. This vector is called the characteristic vector (CV) of S and is denoted as CV S [19]. Definition 8: Given two pattern sets S 0 and S , if the patterns in S 0 and S are all identical, we said S 0 = S , otherwise S 0 6= S . If the corresponding bits in CV S 0 and CV S are all the same, we said CV S 0 = CV S , otherwise CV S 0 6= CV S . Lemma 1: Assume a set of n-bit patterns S 0 � 2N m . If the pattern set S 0 turns to the pattern set S after applying a FPS �, then CV S is a permutation of CV S 0 by the FPS �. N Theorem 2: A pattern set S 0 , which consists of all patterns 2 2m with same outputs, turns to another pattern set S after a FPS �. If CV S 0 6= CV S , the FPS � will be detected by S 0 . Proof: Please refer to [5]. Lemma 2: Given a set of n-bit patterns S 0 , assume S 0 turns to the pattern set S after applying a FPS �; CV S will be equal to CV S 0 if and only if the FPS � only switches the ports with the same digits in CV S 0 . Example 4: Given a pattern set S 0 with 4 bits and CV S 0 is 1010. The 1st and 3rd digits of CV S 0 are both 1. The 2nd and 4th digits of CV S 0 are both 0. If the FPS � only switches the ports between port 1 and port 3 or between port 2 and port 4, CV S 0 remains intact. On the contrary, to keep CV S 0 being intact, the � can only switch port 1 with port 3 or switch port 2 with port 4.
In Fig. 8, we selected S 1 as the verification pattern set P1 and according to Theorem 2, any port misplacement which changes CV S 1 will be detected by S 1 patterns. Thus, the port misplacements that cannot change CV S 1 are regarded as the remaining UPSs 51 . According to Lemma 2, the port misplacements with the same digits in CV S 1 cannot change CV S 1. Thus, the port misplacements among the same digits in CV S 1 are UPSs 51 and can be expressed as (1)(2345678) in the implicit UPSs representation. This result is stated in Corollary 1. Corollary 1: If a pattern set S is selected as the verification pattern set Pi , UPSs 5i can be obtained by applying the same grouping result of CV S over UPSs 5i01 . When S 1 is selected as the verification pattern set P1 . The grouping result of CV S 1 is (1)(0000000). Therefore, according to Corollary 1, we can figure out UPSs 51 by the same grouping of CV S 1 over 50 = (12345678) directly and 51 become (1)(2345678). These results are also shown in Fig. 8. Since the grouping result of CV S 2 is the same as that of CV S 1 and cannot reduce UPSs 51 , S 2 is not selected as the verification pattern set. In this iteration, the remaining UPSs are reduced from (12345678) to (1)(2345678) when P1 is generated. This means that if the port sequence � of the real interconnection in the integrated design 2 = UPSs (1)(2345678), when applying P1 into the integrated design, the port sequence � will be detected. The system integrators do not know how cores are connected exactly in the actual integrated design. However, to demonstrate the interconnection detection, diagnosis and correction procedures, we assume the FPS � of this example is given as 83762451. This FPS will be corrected to the FFPS 12345678 at the end of the AIR algorithm to demonstrate the success of the AIR algorithm. C. Fault Detection We apply P1 {10000000} into the design with the FPS � 83762451 and find that the corresponding output of P1 is B0 as shown in the first row of Fig. 9(a). Since the fault-free output is A0, the fault effect appears and � is detected by P1 . D. Fault Diagnosis We apply P1 into the integrated design and realize by observing the unexpected output B0 that the real applied input is not P1 . Since there are seven patterns that produce B0 output, we do not know exactly what the actual applied pattern is. Nevertheless, we know the actual applied pattern produces A0 output instead. We simulate 218 patterns with the FPS 83 762 451 and observe the outputs until the output is A0. These results are shown in Fig. 9(a). From Fig. 9(a), we find that when the last pattern {00000001} is applied into the integrated design,
IEEE TRANSACTIONS ON COMPUTER-AIDED DESIGN OF INTEGRATED CIRCUITS AND SYSTEMS, VOL. 22, NO. 1, JANUARY 2003
109
Proof: CV values of correct ports in an FPS are the same as that of FFPS and they will not be identified as the possible faulty ports in the fault diagnosis stage. Thus, they will be remained intact in the fault correction stage. Q.E.D. Lemma 3: There exists a finite sequence of 2-switches to convert the FFPS into an FPS �. Lemma 4: Assume a port sequence �1 turns to another port sequence �2 after applying a finite sequence of 2-switches, then the �2 will turn back to �1 after applying the reversed order of the same sequence of 2-switches. Definition 10: Given a set of n-bit patterns S 0 , when a 2-switch is applied on S 0 and CV S 0 is invariant, the 2-switch is called a CV invariant fault of S 0 (CVIF(S 0 )). Otherwise, it is called a CV variant fault of S 0 (CVVF(S 0 )). Theorem 4: Given a set of n-bit patterns S 0 and a FPS �, there exists a finite sequence of 2_switches, 2 switch1 � 2 switchl , to convert the FFPS into � and this sequence of 2_switches must be in one of the following three categories: I) II)
2 switch1 � 2 switch are all CVIFs(S ) 2 switch1 � 2 switch are CVIFs(S ) and 2 switch +1 � 2 switch are CVVFs(S ) where 1 � i � l01 2 switch1 � 2 switch are all CVVFs(S ).
Fig. 9. Rectification processes of
Fig. 10.
2.
One correction operation of the FPS 83762451.
the output becomes A0. This result implies that the FPS � turns the pattern {00000001} to {10000000}. We put the pattern {00000001} into S 10 and assume S 1 is {10000000}. Then we calculate CV S 10 = 00000001 and CV S 1 = 10000000. Afterward, the misplaced ports can be identified by comparing CV S 10 and CV S 1. E. Fault Correction Definition 9: The exchange of two ports is defined as a 2_switch. The exchange of port x and port y is denoted as 2 switch(x; y ). Comparing CV S 10 and CV S 1, we observe that the first and eighth digits of CV S 10 and CV S 1 are different. Thus, we switch port 1 with port 8 to let CV S 1 be the same as CV S 10 . Then the corrected FPS becomes 13 762 458 and is shown in Fig. 9(b). This correction operation in the actual integration verification process is also shown in Fig. 10. The following lemmas and theorem state the convergency of fault correction procedure, i.e., the fault correction stage will correct the misplaced ports within finite iterations. Theorem 3: The correct ports in an FPS � will not be rectified to faulty ones in the fault correction stage.
0
i
i
III)
0
l
0
l
l
0
Proof: We assume the pattern set S 0 turns to the pattern set S after applying a FPS �. According to Lemma 1, CV S is a permutation of CV S 0 , hence, CV S 0 and CV S could be equal or not. If CV S 0 = CV S , (I): According to Lemmas 2 and 3, � is a finite sequence of CVIFs(S 0 ). Thus, 2 switch1 � 2 switchl are all CVIFs(S 0 ). If CV S 0 6= CV S , (II): According to Lemmas 2 and 3, there exists a finite sequence of CVVFs(S 0 ) �1 that switches CV S 0 to CV S . According to Lemma 4, the reversed order of �1 applied on CV S can turn CV S to be equal to CV S 0 . At this time, the situation is the same as (I), the remaining possible 2_switches are a finite sequence of CVIFs(S 0 ) �2. The concatenation of �2 and �1 is a finite sequence of 2_switches which constructs �, where 2 switch1 � 2 switchi are CVIFs(S 0 ) and 2 switchi+1 � 2 switchl are CVVFs(S 0 ), 1 � i � l 0 1. (III): Similar as (II). However, if �2 is empty, then 2 switch1 � Q.E.D. 2 switchl is a finite sequence of CVVFs(S 0 ). In this example, the 2_switch(1,8) is a CVVF(S 10 ). Therefore, according to Theorem 4, the corrected FPS �0 is a sequence of CVIFs(S 10 ). Theorem 4 guarantees that the CVIF(S 10 ) are the only possible faults which we have to deal with in the succeeding iteration. Since each Pi corresponds to a set of FPSs, FPSs(Pi ) and is responsible for detecting them. If the corrected FPS �0 2 = FPSs(Pi ), Pi is not able to detect and correct any other faulty ports in �0 . At this time, further verification pattern set Pk , where k > i, are generated to detect and correct the other faulty ports in �0 . However, how can we know the corrected FPS �0 2 5i and cannot be corrected by Pi anymore? The following corollary states the condition that has to be satisfied so that the corrected FPS �0 2 = FPSs(Pi ) (or 2 UPSs 5i ). Corollary 2: If the actual outputs are consistent with the expected ones when applying Pi into the integrated design with a corrected FPS �0 , then the corrected FPS �0 2 UPSs 5i . Therefore, according to Corollary 2, we apply P1 into the integrated design again with the corrected FPS �0 13 762 458 to see whether the �0 can be further corrected by P1 . In Fig. 9(c), we find that the outputs of P1 in the integrated design with the �0 13 762 458 is A0, which is the same as the expected one, Thus, �0 2 UPSs 51 (1)(2345678). At this time, we move to the next iteration to generate further verification pattern sets Pk (k > 1) to detect and correct the remaining faulty ports.
110
Fig. 11.
IEEE TRANSACTIONS ON COMPUTER-AIDED DESIGN OF INTEGRATED CIRCUITS AND SYSTEMS, VOL. 22, NO. 1, JANUARY 2003
Simulation outputs of applying
2.
(a)
(a)
(b)
(b)
(c)
Fig. 12.
Rectification processes of
2
(1/2).
F. Succeeding Iterations in the AIR Definition 11: A single element group (SEG) is a group that contains only one port number in the UPSs representation. A multiple element group (MEG) is a group that contains more than one port numbers in the UPSs representation. The group (1) in UPSs 51 = (1)(2345678) is an SEG and the group (2345678) in 51 is an MEG. The physical meaning of the SEG is that the remaining undetected port sequences are all irrelevant to the port in the SEG and further pattern generation does not have to activate any POFs related to the port in the SEG. Therefore, when we search 287 for further verification patterns, we find that the pattern {01111111} cannot activate any remaining POFs in 51 . This is because the logic assignments in the ports 2 � 8 of pattern {01111111} are all the same. Therefore, we exclude it from 278 to minimize the number of simulation patterns. The other patterns in 278 and their simulation outputs are shown in Fig. 11. We put an X in the output of the pattern {01111111} to indicate the exclusion of this pattern from 278 simulation. The remaining patterns in 278 are grouped into two groups, S 3 = f10111111; 11011111g and S 4 = f11101111; 11110111; 11111011; 11111101; 11111110g,
(c)
Fig. 13.
Rectification processes of
2
(2/2).
according to their outputs. These groups are sorted by size in ascending order. To select a group as the verification pattern set, we always choose the group with the smallest size if it indeed can detect new FPS. Thus, in this example, S 3 is selected as the verification pattern set P2 . After the selection of S 3, we find CV S 3[1 : 8] = 21122222. Since 51 are (1)(2345678), the POFs related to the port in the SEG side are all detected, therefore, we only consider CV S 3[2 : 8] when analyzing the remaining UPSs. The grouping result of CV S 3[2 : 8] is (11)(22222). Thus, according to Corollary 1, 52 becomes (1)(23)(45678). When P2 is generated, we have to apply it to the integrated design to verify the interconnection immediately. The outputs of P2 with the FPS 13762458 differ from the expected ones as shown in the first row of Fig. 12(a). Thus, the FPS 13762458 is detected by P2 . Now, we correct the faulty ports of �0 in the same way as mentioned in the previous paragraphs. In Fig. 12(a), we simulate the integrated design with FPS 13762458 and find that the patterns {11011111, 11111101} of 278 produce A1 output. Let these patterns be in S 30 and compare CV S 30 and CV S 3 as shown in Fig. 12(b). We can easily identify that ports 2 and 7 are
IEEE TRANSACTIONS ON COMPUTER-AIDED DESIGN OF INTEGRATED CIRCUITS AND SYSTEMS, VOL. 22, NO. 1, JANUARY 2003
Fig. 14.
Simulation outputs of applying
111
2.
misplaced. After the 2_switch(2, 7), the FPS becomes 15 762 438 and, according to Theorem 4, CVVF(S30 ) are corrected. The remaining possible faulty ports are CVIF(S30 ) and they can be expressed as [124568][37]. This representation means the port numbers in the same bracket are possibly mutually misplaced ports. We apply P2 to the integrated design again with the corrected FPS 15762438 and show the outputs in Fig. 12(c). Since they are different from the expected ones, the FPS 15762438 has to be further corrected. In Fig. 13(a), we simulate the integrated design with FPS 15762438 and find that the patterns {11110111, 11111101} of 287 produce A1 output. Let these patterns be in S50 and we rename S3 as S5 for clearance of explanation. We compare CV S50 and CV S5 as shown in Fig. 13(b) and find that there are two choices to correct the misplaced ports, either port 2 with port 5 and port 3 with port 7, or port 2 with port 7 and port 3 with port 5. According to the result of last iteration, CVIF(S30 ) = [124568][37] are possibly mutually misplaced ports. We find that port 2 and port 5 are in the same bracket as well as ports 3 and 7. Thus, we switch port 2 with port 5 and port 3 with port 7 as shown in Fig. 13(b). Now, the FPS becomes 12365478. Fig. 13(c) shows the outputs of P2 with the corrected FPS 12365478. Since the outputs are identical, according to Corollary 2, the corrected FPS 2 52 (1)(23)(45678). For S4 in Fig. 11, since it has no contribution in reducing the size of UPSs 52 further, it is not selected as the verification pattern set.
Fig. 15. Fault free for P3 verification.
Thereafter, the verification pattern search for 52 (1)(23)(45678) is continued. 52 have three groups that are numbered from G1 to G3, i.e., G1 is (1), G2 is (23) and G3 is (45678). G1 is an SEG and G2 � G3 are MEGs. Please note that if 52 = (1)(23)(45678) can be reduced to 5t = (1)(2)(3)(4)(5)(6)(7)(8),the remaining POFs are all detected. Then 228 are simulated. The patterns in 228 have two 1s and six 0s. These two 1s in each pattern can be placed in the SEGs, the MEGs, or both. The SEG and MEG groups are placed side by side and all combinations of 228 patterns are listed in Fig. 14. In Y1, the MEG side assignments are 217 , therefore, all remaining POFs are activated according to Theorem 1. The outputs of Y1 are not all the same, thus, the activated fault effects are propagated. The smaller pattern set S6 is selected as P3 and UPSs 53 become (1)(2)(3)(45678). We apply P3 into the integrated design with FPS 12365478 and observe that the corresponding output is the same as A2 as shown in Fig. 15. Thus, FPS 12365478 2 53 .
112
IEEE TRANSACTIONS ON COMPUTER-AIDED DESIGN OF INTEGRATED CIRCUITS AND SYSTEMS, VOL. 22, NO. 1, JANUARY 2003
Y2 does not activate any undetected POF, therefore, we have no need to simulate it. Since G2 = (23) is grouped into two SEGs in 53 , Y3 and Y4 have to be analyzed separately. For Y3, the outputs are all A3, thus, the activated fault effects of G3 = (45678), are not propagated to POs. For Y4, the outputs are all A4, thus, the activated fault effects of G3 are not propagated to POs, either. For Y5, we group these patterns into three groups S 8 � S 10 according to their outputs. S 10 is selected as P4 and 54 become (1)(2)(3)(48)(5)(67). We apply P4 into the integrated design with FPS 12365478, the outputs of P4 are shown in the last two rows of Fig. 16(a). Since the outputs are not all C5, the FPS 12365478 is detected by P4 . In Fig. 16(a), we simulate the integrated design with FPS 12365478 and find that the patterns {00011000, 00001010} of Y5 produce C5 output. Let these patterns in S 100 and compare CV S 100 with CV S 10 as shown in Fig. 16(b). We can identify that ports 4 and 6 are misplaced. After the 2_switch(4, 6), the FPS becomes 12345678 and it is the FFPS. However, we do not know the FPS has been rectified to the FFPS already in practical verification process. Thus, the AIR processes are continued. We apply P4 into the integrated design again with the FPS 12345678 and their outputs are shown in Fig. 16(c). Since the outputs are identical, according to Corollary 2, the corrected FPS 12345678 2 54 (1)(2)(3)(48)(5)(67). When S 8 is selected as P5 , 55 becomes (1)(2)(3)(4)(5)(6)(7)(8). Similarly, we apply P5 into the integrated design and observe that the outputs are the same as A5 as shown in Fig. 17. Thus, the FPS 12345678 2 55 and is the FFPS. Since 55 is the empty UPS, the AIR is terminated. Now, the original FPS 83762451 is corrected as the FFPS 12345678 as desired at the end of AIR algorithm. This result demonstrates that the AIR algorithm can rectify the misplaced interconnection to the correct interconnection in the integrated design. From the description above, we know that if the pattern generation stage can generate the verification pattern sets P1 � Pt with the UPSs 5t = FFPS, then the other stages of AIR can rectify the faulty interconnection to the fault-free one. Thus, the success of AIR strongly depends on the pattern generation stage. Since the pattern generation stage will search all 2N m , for m = 1; 2; . . . ; N 0 1 if necessary, it is a complete algorithm. This complete pattern generation algorithm leads the AIR algorithm to be complete as well.
(a)
(b)
(c)
2.
Fig. 16.
Rectification processes of
Fig. 17.
Fault free for P5 verification.
G. Sequential AIR The development of the sequential AIR is based on the same assumption as the combinational AIR, i.e., the circuit under verification (CUV) is preverified and fault free. The fault occurs only at the interconnection between the cores. For the testability concern, most sequential cores are designed with scan chains. Thus, we assume here that the sequential cores in the experiments are scan-testable. These sequential cores can be set in arbitrary state and therefore they can be seen as combinational ones. Consequently, the AIR algorithm used in the combinational cores is applicable to the sequential ones. The only difference is that the sequential cores have to be set to a state by sequential AIR before evaluating outputs. The sequential AIR sets the simulation model of a sequential core N . If the outputs of the selected 2m N to a state Si and simulates one 2m N are all the same, it chooses another m for 2m simulation, otherwise, N (for m = 1 � N 0 1) are the valid patterns are generated. If all 2m simulated in state Si and the POF coverage is not 100% yet, sequential N AIR sets another state Sj , where Sj 6= Si and repeats the same 2m simulation to conduct the pattern generation and so on [5]. When the valid patterns are generated with state Si , they are applied into the design with state Si to verify and rectify the misplaced interconnection just as the combinational AIR did mentioned in Sections III-C–III-F. The sequential AIR will set the sequential core to every possible state to generate the verification patterns until the POF coverage is 100%.
H. Heuristic AIR Definition 12: An untestable POF is a POF which cannot be detected after applying 8N . The untestable POF is harmless for the integrated design, therefore, they do not have to be corrected in the AIR. The possibility of existing untestable POFs in the CUV makes the pattern generation stage very time consuming. Therefore, a heuristic pattern generation algorithm is proposed to replace the complete one in the AIR to trade off between the performance and the execution time. Here we only address the heuristic combinational AIR. This is because the combinational AIR is the basis of the sequential AIR. We review Fig. 14, which shows the outputs of 282 simulation in the complete pattern generation algorithm. In this figure, the pattern sets Y1, Y3 � Y5 are generated and simulated. However, according to Theorem 1, any one of them can activate all remaining POFs and has the possibility to reduce the size of the remaining UPSs. Hence, the heuristic approach is to arbitrarily simulate one of them in one iteration instead of all pattern sets. For example, it can only simulate Y1 or Y3. If the generated patterns are valid, the correction processes are conducted. Otherwise, the pattern generation stage proceeds to the next 2mN . This heuristic algorithm also sets an iteration counter to bound the processing time.
IEEE TRANSACTIONS ON COMPUTER-AIDED DESIGN OF INTEGRATED CIRCUITS AND SYSTEMS, VOL. 22, NO. 1, JANUARY 2003
TABLE I EXPERIMENTAL RESULTS OF THE HEURISTIC AIR COMBINATIONAL BENCHMARKS
ON
TABLE II EXPERIMENTAL RESULTS OF THE HEURISTIC AIR SEQUENTIAL BENCHMARKS
113
ON
IV. EXPERIMENTAL RESULTS The heuristic AIR has been integrated into the SIS [17] environment which was developed at the University of California at Berkeley. Experiments are conducted over a set of ISCAS-85, ISCAS-89, MCNC, and ITC-99 benchmarks. These benchmarks are in Berkeley Logic Interchange Format (BLIF) which is a netlist level design description. However, we only use the simulation information to conduct the experiments and, therefore, arbitrary level of design description can be used for conducting POF verification. The simulation information of the BLIF benchmarks imitate the simulation model of IP cores. The functionalities of these benchmarks include ALU (c5315), multiplier (c6288), processors (b14, b15), and some ASIC designs, thus, the experiments can represent the realistic SoC design appropriately to some degree. Table I summarizes the experimental results of the heuristic AIR on combinational benchmarks. The first three columns show the parameters of each benchmark, including name, jPIj and the gate counts (gcs). The jPIj represents the number of inputs and the size of the POFs set is jPIj! 0 1. The gcs indicates the scale of a benchmark. The column a=b presents “number of corrected ports/number of faulty ports”. These faulty ports in the experiments are caused by the blind connection and the guided connection, respectively. To imitate the actual interconnection faults in the integration, the FPS in the experiment is generated as follows. For the blind connection, that means all ports are possibly misplaced, therefore, for each port i, i from 1 to N , we assign a reasonable random number (2 [1 � N ]) to it. If the number has been assigned to port j , where 1 � j < i, we generate another random number to the port i until it is not repeated. This process is similar to the real interconnection process with blindness and therefore the number of faulty ports is nearly the same as jPIj. For the guided connection, we assume only about 20% ports within two ports tolerance are possibly misplaced. Then these possibly misplaced ports adopt the same FPS generation procedure used in the blind connection to obtain the FPSs. Since the FPSs in the blind connection and guided connection experiments are generated randomly, the generated FPSs quantify the inject out of order permutations. The iteration bound in the experiment was set to 100. The CPU time is measured on an Ultra Sparc II workstation in second. The AIR algorithm will be terminated automatically if the iteration counter is over
the bound or the remaining UPS becomes empty. Please note that since we are greatly concerned about how many faulty ports are injected and corrected rather than the number of the generated verification patterns in the experiments, we do not report the number of the verification patterns in the experimental results. According to Table I, the faulty ports of each benchmark in the blind connection and guided connection are all corrected by the AIR (a = b) and the processing time of most benchmarks is acceptable. Meanwhile, the CPU time of blind connection is longer than that of guided connection as expected. For c7552 and des benchmarks in the blind connection, however, the CPU time is much longer than that of the other benchmarks. This is because the c7552 and des experiments have hundreds of faulty ports. These large amount of faulty ports involve more diagnosis and correction operations in the experiments and spend much time. Furthermore, a benchmark with more gate counts also consumes longer simulation time in the experiments and degrades the AIR performance. Nevertheless, this timing cost can be alleviated if the number of faulty ports is decreased or the untestable POFs are specified/given. Table II summarizes the experimental results of the heuristic AIR on sequential benchmarks. The fourth column lists the number of flipflops in a benchmark. Table II also demonstrates that the faulty ports in each benchmark except s420, s5378, and s13207 are all corrected within acceptable CPU time. These uncorrected faulty ports in s420, s5378, and s13207 are caused by the tradeoff between the performance and execution time in the heuristic pattern generation stage.
114
IEEE TRANSACTIONS ON COMPUTER-AIDED DESIGN OF INTEGRATED CIRCUITS AND SYSTEMS, VOL. 22, NO. 1, JANUARY 2003
V. CONCLUSIONS In the SoC era, the embedded cores are mixed and integrated to create a system chip. System designers integrate those cores manually and have the possibility of incorrect integration due to the misplaced I/O ports. Furthermore, without the knowledge of the internal structures of the embedded cores, system designers have a difficult time trying to locate the position of the erroneous interconnection. The AIR technique provides a solution to integrate the cores with correct interconnection automatically. Therefore, this technique can reduce the time on design verification in core-based design methodology.
REFERENCES [1] H. Chang, L. Cooke, M. Hunt, G. Martin, A. McNelly, and L. Todd, Surviving the SoC Revolution—A Guide to Platform-Based Design. Norwell, MA: Kluwer, 1999. [2] J. Bergeron, Writing Testbenches-Functional Verification of HDL Model. Norwell, MA: Kluwer, 2000. [3] J. A. Rowson and A. Sangiovanni-Vincentelli, “Interface-based design,” in Proc. Design Automation Conf., June 1997, pp. 178–183. [4] S.-W. Tung and J.-Y. Jou, “A logic fault model for library coherence checking,” J. Inform. Sci. Eng., vol. 14, no. 3, pp. 567–586, Sept. 1998. [5] C.-Y. Wang, S.-W. Tung, and J.-Y. Jou, “On automatic verification pattern generation for SoC with port order fault model,” IEEE Trans. Computer-Aided Design, vol. 21, pp. 466–479, Apr. 2002. , “An improved AVPG algorithm for SoC design verification using [6] port order fault model,” in Proc. Asian Test Symp., Nov. 2001, pp. 431–436. [7] S.-Y. Huang, K.-C. Chen, and K.-T. Cheng, “Incremental logic rectification,” in Proc. VLSI Test Symp., 1997, pp. 143–149.
[8] M. Fujita, Y. Tamiya, Y. Kukimoto, and K.-C. Chen, “Application of Boolean unification to combinational synthesis,” in Proc. IEEE/ACM Int. Conf. Computer-Aided Design, 1991, pp. 510–513. [9] P.-Y. Chung, Y.-M. Wang, and I. N. Hajj, “Logic design error diagnosis and correction,” IEEE Trans. VLSI Syst., vol. 2, pp. 320–332, Sept. 1994. [10] P.-Y. Chung and I. N. Hajj, “Diagnosis and correction of multiple design errors in digital circuits,” IEEE Trans. VLSI Syst., vol. 5, pp. 233–237, June 1997. [11] S.-Y. Huang, K.-C. Chen, and K.-T. Cheng, “Error correction based on verification techniques,” in Proc. ACM/IEEE Design Automation Conf., 1996, pp. 258–261. [12] A. Veneris and I. N. Hajj, “Design error diagnosis and correction via test vector simulation,” IEEE Trans. Computer-Aided Design, vol. 18, pp. 1803–1816, Dec. 1999. [13] S.-Y. Huang, K.-C. Chen, and K.-T. Cheng, “Errortracer: Design error diagnosis based on fault simulation techniques,” IEEE Trans. ComputerAided Design, vol. 18, pp. 1341–1352, Sept. 1999. [14] S.-Y. Huang, K.-C. Chen, K.-T. Cheng, and J. Y. J. Lu, “Fault simulation based design error diagnosis for sequential circuits,” in Proc. ACM/IEEE Design Automation Conf., 1998, pp. 632–637. [15] I. Pomeranz and S. M. Reddy, “On error correction in macro-based circuits,” IEEE Trans. Computer-Aided Design, vol. 16, pp. 1088–1100, Oct. 1997. [16] R. E. Bryant, “Graph-based algorithms for Boolean function manipulation,” IEEE Trans. Computer, vol. C-35, pp. 677–691, Aug. 1986. [17] E. M. Sentovich, K. T. Singh, C. Moon, H. Savoj, R. K. Brayton, and A. Sangiovanni-Vincentelli, “Sequential circuit design using synthesis and optimization,” in Proc. IEEE Int. Conf. Comput. Design, Oct. 1992, pp. 328–333. [18] M. Abramovici, M. A. Breuer, and A. D. Friedman, Digital Systems Testing and Testable Design. Rockville, MD: Computer Science, 1990, p. 95. [19] D. I. Cheng and M. Marek-Sadowska, “Verifying equivalence of functions with unknown input correspondence,” in Proc. European Conf. Design Automation With the European Event in ASIC Design, Feb. 1993, pp. 81–85.