Valuable medical information can be achieved by analyzing shape and appearance of human chromosomes. Karyotype, an image of collection of a11 23 pairs ...
Automatic Landmark Detection on Chromosomes’ Images for Feature Extraction Purposes Mehdi Moradi Electrical and Computer Engineering Department, Faculty of Engineering, University of Tehran, Tehran, Iran and
S. Kamaledin Setarehdan Control and Intelligent Processing Center of Excellence, Department of Electrical and Computer Engineering, Faculty of Engineering, University Of Tehran, Tehran, Iran and
S.R Ghaffari Cancer Institute, School of Medicine, University of Tehran, Iran
Abstract Valuable medical information can be achieved by analyzing shape and appearance of human chromosomes. Karyotype, an image of collection of a11 23 pairs of human chromosomes, is usually used for this purpose. Making a Karyotype is hard and time consuming, encouraging experts in the image processing and machine vision field to work towards an automatic karyotyping method. The first step in automation of this process is to define the geometric (morphologic) and intensity based features of the chromosome originating mostly from its banding pattern. As part of a complete project, which is defined to develop a new knowledge based classification technique for chromosomes, a number of new features in addition to the commonly used geometric and intensity based features, are intmduccd in this paper. Some of the features are computed using the so-called Medial Axis Transform (MAT). For an accurate determination of most of these features it is necessary, however, 10 identify some key points or landmarks in the image (mostly OVEI the MAT). This paper describes novel algorithms developed to locate such landmarks as centromere, end points of chromosome and two points defined as branching points on the chromosome axis. The algorithms have been tested an the real images supplied by the cytogenetic laboratory of Cancer Institute, University of Tehran. The automatically defined positions of the landmarks have been compared to those manually identified by an expert. In most of the cases the results were in complete agreement.
Keywords: Chromosome Classification, Medial Axis Transformation, Landmarks, Centromere, Morphologic Features 1. Introduction
Human chromosome analysis is an essential task in cytogenetics, especially in prenatal screening, genetic syndrome diagnosis, and cancer pathology research [I]. Cells used for chromosome analysis are taken mostly from amniotic fluid or blood samples. Karyotyping is usually done in the metaphase
567
stage of the cell division. That is because in metaphase the chromatin is condensed into the chromosomes and they can be easily observed with the light microscope. Efforts have been made in the past 3 decades to solve the problem of automatic karyotyping. Taking all possible appearances of non-rigid chromosome into consideration, complexity of classification ascends to an unlimited level. This complexity has been the main cause for limited success of all previously suggested methods. Several different classifiers have been tested on chromosomes including distance and statistical classifiers [21, nearest neighborhood classifiers [31, and furry classifiers [41, over the past few years. But they all showed a poor performance compared to the ability of a human expert in solving the Same problems. It may partly be due to the inadequate usage and modeling of the expert knowledge and/or due to the attempt to represent a complex problem with natural diversities in a predefined mathematical framework. Since our ultimate goal is to model the ability of an expert human operator in classifying the chromosomes, we concentrated on those descriptive features of the chromosomes that are usually used by the experts. In our study, it was observed that a human expert ability in effective classification of the chromosomes are mostly due to the visible information that he or she gets from the band pattern of a chromosome and then processing i t in a fuzzy manner. In fact, at first glance, even an untrained person can distinguish some characteristic bands on each chromosome. In addition to the band pattern and the relative positions of the dark and bright bands to each other, the length and the centromeric index of a chromosome are of a great importance for a human expert in the chromosome classification problem. Therefore, for automation of the Karyotyping, these features must be extracted first from the chromosome images by means of the image processing techniques. For an automatic determination of these features, on the other hand, it is necessary to locate some important key points or landmarks over the chromosome image. In this paper, we describe novel image processing algorithms and methods for automatic locating the important landmarks that is a necessary step for automatic feature extraction. In order
Proceedings of the 3rd International Symposium on Image and Signal Processing and Analysis (2003)
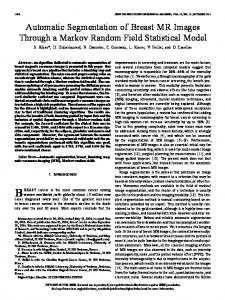
to identify those important features, which are usually used by expen operators. our cytogeneticist expen colleague has been asked to provide us the four most important (visibly the most appreciable) bands for each of the chromosomes in group E only (chromosomes numbered 16, 17, and 18) as a smaller problem to start with. She was also asked to determine the geometrical positions, widths, and gray levels of each band together with the total length and the centromeric index of each of these chromosomes. Therefore. a feature vector of length 14 for each chromosome is defined at the end. The important landmarks to be located on a chromosome image. which then allows us to automatically determine the elements of the above mentioned feature vectors, include the centromere of the chromosome (the narrowest pan of the chromosome), the medial axes of the chromosome, the end points and branching points of the medial axis. A typical chromosome number 16 and the binary image of the medial axis extracted by the Medial Axis Transform (MAT) together with the landmarks are shown in figure 1.
typical chromosome 16 and its centromere, Right: the binary image of lhinned medial axis of ihe same chromosome, Landmarks are named as a, b, e, d(end points) and e, f (branching points) figure 1. Left: a
2. Medial Axis Transformation
Firct introduced by Ulum [6], the medial axis transformation is a morphological transformation, mainly used to extract the skeleton of an object. Medial axis is deiined as the set of the centers of the maximal inscribed circles contained in the given domain. MAT is defined as the set of all the pairs of the medial axis point and the radius of the corresponding inscribed circle. In digital images, the above definition does not work. It has been shown [7] that the MAT of region R with border U is as follows: For each pointp in R, wefind its closet neighbor in B. If p has more than one such neighbor, it is said to belong to the medialaxis of R Closest depends on the definition of a distance.
This method does not guarantee a connected and one pixel wide axis. A thinning process is performed to obtain aone pixel wide medial axis.
3. Landmarks a n d Their Applications in Feature Extraction Process As mentioned above we are looking for some characteristic bands along the chromosome. A band is defined as that part of a chromosome clearly distinguishable from its adjacent segments by appearing darker or brighter with one or more banding techniques. The chromosomes are visualized as consisting of a continuous series of bright and dark bands. The curvature of chromosome does not obey any mle, therefore to define a band it is necessary to find the curvature of its medial axis at the point and consider the band in the direction perpendicular to the axis. As it is seen in figl, a chromosome has a rectangle like appearance with curved borders. The medial axis of such an object is consisted of three parts as shown in figure I: a central section and two end sections. Each end section consists of two branches directing to the upper-left or upper-right (lower-left or lower-right) vertices. In these end sections, the directions of bands can be approximated along the lines perpendicular to median of the triangle whose vertices are two endpoints of the chromosome and the branching point on the corresponding side. It is clear from this explanation that we need the coordinates of the end points and also the branching points. As the medial axis is not a connected line, and the upper and lower part of the chromosome may ,be bent, we need B method to detect these points automatically. The length of the chromosome also can be approximated with the sum of the lengths of lines fitted to the curve of the central section of the chromosome added to the length of medians of upper and lower triangles aforementioned. Having the centromere, the length of the shon and the long arms are also computed and CI is obtained. It is worth mentioning that all length measures should be normalized with respect to the same measure in all chromosomes the same picture. Only after normalization the lengths measures of chromosomes obtained in different slides can be compared (because of different zooming processes during photography). Normalization is also needed on intensity levels of chromosomes because of different lightning conditions during photography. In this article our purpase is to explain about methods for automatic detection of landmarks needed for feature extraction in our project. The result of classification based on these methods is to be clarified in our next articles.
Proc. ISPAO3
568
x;:
Figure 3. Different eases possible for deviation of upper part of chromosome In o u r algorithm. a) stat=l and slpsl save UEPl as a n endpoint and go to 10 7- If stael and slpcs2 save UEPl as an endpoint and go to 11 8- If slue0 and s l p 0 save UEPI as an endpoint andgo to 10 9- If stat=O and slp