version 9.1â, Ontario. Canada: Richmond Hill. [6] Magowe, M, & Carr, J. R. (1999). Relationship between lineaments and ground water Occurrence in western.
International Journal of Science and Research (IJSR) ISSN (Online): 2319-7064 Index Copernicus Value (2013): 6.14 | Impact Factor (2013): 4.438
Automatic Mapping of Lineaments Using Shaded Relief Images Derived from Digital Elevation Model (DEM) in Kirkuk Northeast Iraq Shaheen Alhirmizy Department of applied Geology, College of Science, Kirkuk University, Assayada, Kirkuk, Iraq
Abstract: The area of this study is one of the important places in Iraq, which contains many important oil fields. Shaded relief images created from digital elevation models (DEMs) are helpful in identifying lineaments in different distinct relief and topography. Combining four shaded relief images into a final image leads to enhancing lineaments within the four sun azimuth directions(Anwar Abdullah, 2010) the method can enhance lineaments at different orientations by simulating topographic illumination under varied light directions. Combining four shaded relief images into a final image leads to enhancing lineaments within the four sun azimuth directions. Two shaded relief images with multi-directional light were created, the first image with the four azimuth angles of the light sources that are 0°, 45°, 90° and 135°, and the second image with the four azimuth angles of the light sources that are 180°, 225°, 270°,and 315°. Both images have been used for automatic lineament extraction using PCI Geomatica2013 software. The extracted lineaments of the first image show that the most automatic lineaments represent positive lineaments; and the automatic lineaments of second image represent negative lineaments of the study area. The term “lineament” is one of the most commonly used terms in geology. A lineament is any extensive linear surface on a planet, as a fault line or fracture line. Hobbs (1904) first used the term lineament to define a significant line of landscape of Basement rocks. O’Leary et al. (1976) described the term lineament as a mappable, simple or composite linear feature of a surface whose parts are aligned in a rectilinear or slightly curvilinear relationship and which differs from the pattern of adjacent features and presumably reflects some sub-surface phenomenon
1.
Introduction
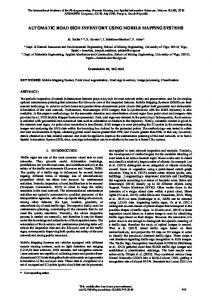
Relief shading gives a DEM a more “3D” look. In the popular (ESRI ArcGIS), there is a function to apply “z” amplification to the hill shade effect, Shaded relief is a method for representing topography on maps in a natural, aesthetic, and intuitive manner. Relief shading methods include a manual method and an automatic one. With the former, the production time is long, and the cartographers must have good abilities of map interpretation color controlling and artistic decoration. So, generally only professional cartographer can do it, and once the product is completed, it can't be modified and adjusted any more. In contrast with the manual one, automatic relief shading has many merits: user can select and change the position of supposed light according to his own feeling, and change the contrast of brightness, etc. In order to enhance the feeling of three-dimensional, the vertical proportion may be magnified properly, and the relief stereo-appearance is more visible. But, for a complicated terrain region, a good relief map only with a single light source usually can’t acquire perfect impression Figure 1: Location Map of Study Area
2. Materials and Methods
3. Geological Setting of Study Area
Study area The study area is situated in the northeast of Iraq fig (1) about km from Baghdad between 43.277110 dd and 44.732945 dd and longitude 35.863705 dd and 34.695015 dd
The study area is located in unstable shelf represented rangehigh-folds, sulaimanya – zakho belt and therange of the lowfolds, chamchumal-erbil, himreen-makhul. (AlKadhimi et al. 1999) There are some anticlines in the study area like qara chuk, baihasan, jambur and Kirkuk baba Dom the trend of baba Dom NW-SE, there are three reverse faults. The following
Paper ID: SUB154653
Volume 4 Issue 5, May 2015 www.ijsr.net Licensed Under Creative Commons Attribution CC BY
2228
International Journal of Science and Research (IJSR) ISSN (Online): 2319-7064 Index Copernicus Value (2013): 6.14 | Impact Factor (2013): 4.438 formations are exposed in the studied area fig (2)from MidMiocene_Pleistocene: 1) Alfatha (Lower fares) formation (Middle Miocene) is a mixed clastic-carbonate-evaporate unit, which exposed in the Foothill (Low Folded) Zone in the northern and other area of Iraq. 2) Injana measured near injana at jabal hemrin 120 km NE Baghdad its 620 m thick . The basal unit comprises thinbedded calcareous sandstone, and red and green mudstone, with one thine gypsum 20 cm thick and a purple siltstone horizon with glass shared. The age of formation is late Miocene. 3) Mukdadiya (LOWER Bachtiari) formation comprises up to 2000 M of fining upwards cycles of gravely sandstone, sandstone and red mudstone. The sandstones are often strongly cross-bedded and associated with channel lags and clay balls. 4) Bai Hasanformation (Upper Bachtiari) conglomeratic fanciesit consist of sandstone with rounded and rode-like Calcite cemented concretion. 5) Quaternary sediments: the foothill zone, in Kirkuk Embayment is characterized by long anticlines with Miocene cores flanked by very broad and shallow synclines Exposing Mio-Pliocene molasse along their flanks. The iner parts of synclines contain Quaternary deposits, referred to here as Polygenetic Synclinal Fill. The thickness of this Quaternary veneer is variable but is >120M in some water wells. These synclines often have a central river system that cuts across, or flows parallel to, their axes .in some synclines, the rivers are braided (often shallow and dry) the beds of this rivers are often gravel-dominated .some synclines contain meandering rivers with finer sediments .the catchment of the synclinal rivers is from flanking anticlines but the main river catchments may extended far beyond the foothill zone. Slope sediments have formed along the flank of the structures.
Paper ID: SUB154653
Figure 2: Geological Map of Kirkuk
4. Data Processing A DEM can be obtained from various sources SRTM (90 x 90m global DEM), ASTER (Advanced Spaceborne Thermal Emission and Reflection Radiometer), 30 x 30 m or manually by interpolation. In the present study, we used SRTM (90 x 90m global DEM). Using ArcGIS 10.2 Shaded relief images were derived from a digital elevation model (DEM) with a resolution of 90 meters are used for linear extractions. Eight shaded relief images were generated. The first step is the production of eight separate shaded relief images with light sources coming from eight different directions. The first shaded relief image created had a solar azimuth (sun angle) of 0°, and a solar elevation of 30°. An ambient light setting of0.20 was used, which produces a good contrast. The other seven shaded relief images were created with seven contrasting illumination directions 45°, 90°,135°, 180°, 225°,270° ,and 315° (Fig. 3). The second step is to combine four shaded relief image to produce one shaded relief image, for this purpose, the combinations of the four shaded relief maps are computed by using GIS overlay technique, where the first four shaded relief images are overlaid to produce one image with multi - illumination directions (0°,45°,90°,and135°) and the second overlay is to produce one image with multi illumination directions (180°, 225°,270°, and 315°) ( Fig. 4A and 4-B). Finally, those two images have been used for automatic lineaments extraction over the study area
Volume 4 Issue 5, May 2015 www.ijsr.net Licensed Under Creative Commons Attribution CC BY
2229
International Journal of Science and Research (IJSR) ISSN (Online): 2319-7064 Index Copernicus Value (2013): 6.14 | Impact Factor (2013): 4.438
Figure 3: Eight shaded relief images derived from DEM with illumination directions( sun azimuth),0°,45°,90°,135°, 180°,225°, 270° ,and 315° and a solar elevation of 30°. An ambient light setting of 0.20.
Figure 4): Two shaded relief images created by combining different shaded relief images. A: Combining four shaded relief images with sun angle of 0°,45°,90° and 135°.And B: Combining four shaded relief images with sun angle of 180°,225°,270° and 315°
5. Lineament Extraction The lineament extraction algorithm of PCI Geomatica software consists of edge detection, thresholding and curve extraction steps (PCI Geomatica, 2013). These steps were carried out over two shaded relief images under the default parameters of the software as
Paper ID: SUB154653
Name
Description
Values
RAD
Radius of filter in pixels
12
GTHR
Threshold for edge gradient
90
LTHR
Threshold for curve length
30
FTHR
Threshold for line fitting error
10
ATHR
Threshold for angular difference
30
DTHR
Threshold for linking distance
20
Volume 4 Issue 5, May 2015 www.ijsr.net Licensed Under Creative Commons Attribution CC BY
2230
International Journal of Science and Research (IJSR) ISSN (Online): 2319-7064 Index Copernicus Value (2013): 6.14 | Impact Factor (2013): 4.438
6. Results and Discussion The directional analysis of the automatically extracted lineament maps has been done and the major trends of lineaments in the study area are NE-SW Figure (5). The automatic lineament extraction method approach does not discriminate man made features and non-geological features during the analysis. This is could lead to an increase the total number and total length of the lineaments. The extracted lineaments of shaded relief image with sun angle of 0°, 45°, 90°, and 135° are mostly resemble a positive system lines in the area The most important feature in the area is the presence of topographic relief pattern. It is clearly to issue that, there is good relationship between these lineament and topographic relief pattern distribution On the other hand, the extracted lineaments of shaded relief image with sun angle of 180°, 225°, 270°, and 315° are mostly resemble a
negative system lines in the area. The most important feature in the area is the presence of drainage lines patterns the structural control pattern of the drainage system in the area. It is observed from the results that the drainage pattern is most likely structurally controlled. It is therefore deduced that both the groundwater and surface water flow directions generally follow the structural strike orientation of the lineaments in the it was known that lineaments could be useful as secondary porosity that increase recharging wells conduit development in an area. And according to (MAGOWE M.CARR JR, 1999) Higher fracture densities correlate positively with higher well yields and Regression analysis identifies statistically significant correlation between distance to lineament intersections and median well yield
Figure 5: A: Rose Diagram for Automatic lineament map of combining four shaded relief images with sun angle of 0°, 45°, 90° and 135B: Rose Diagram for Automatic lineament map of combining four shaded relief images with sun angle of 180°, 225°, 270° and 315°
Paper ID: SUB154653
Volume 4 Issue 5, May 2015 www.ijsr.net Licensed Under Creative Commons Attribution CC BY
2231
International Journal of Science and Research (IJSR) ISSN (Online): 2319-7064 Index Copernicus Value (2013): 6.14 | Impact Factor (2013): 4.438
Figure (6): Automatic lineament maps of shaded relief images. A: Automatic lineament map of combining four shaded relief images with sun angle of 0°,45°,90° and 135°. And B: Automatic lineament map of combining four shaded relief images with sun angle of 180°,225°, 270° and 315°
Figure 7 A: Lineament density map of lineaments extracted from shaded relief image with sun angle of 0°, 45°,90° and 135° and B: Lineament density map of lineaments extracted from shaded relief image with sun angle of 180°, 225°, 270° and 315°
Paper ID: SUB154653
Volume 4 Issue 5, May 2015 www.ijsr.net Licensed Under Creative Commons Attribution CC BY
2232
International Journal of Science and Research (IJSR) ISSN (Online): 2319-7064 Index Copernicus Value (2013): 6.14 | Impact Factor (2013): 4.438
7. Conclusions detecting lineaments for the first time in the study area in in the field The important of this paper is in using automatic extraction for ground water exploration by classifying these lineaments into positive and negative according to its relation within drainage pattern According to Edet et al. (1998), the zones of relatively high lineament density are identified as zones of high degree of rock fracturing, which are prerequisite for groundwater The Ground water, in the study area is found within two main hydrogeological basins, affected by structural conditions such as folds and faults. The first basin is within Bai Hassanand Mukdadiya formations, it is located northeast of Baba Dom, which extends from northwest to southeast, whereas the second basin is within Quaternary sediments and Bai Hassan Formation, it is located southwest of Baba Dom.(Quays J. Saud:2008)
[7] Al-Kadhimi, J.A.M, Sissakian, V.K., Fatah, A.S., and Deikran, D.B., 1996. Tectonic Map of Iraq, scale 1: 1000 000, 2nd edit., GEOSURV, Baghdad, Iraq. [8] Relief shading website (www.reliefshading.com)..
After doing a series of data processing from DEM of study area, the following results have been drawn: 1) The lineament maps fig (6)show that the area has numerous long and short fractures. 2) The automatic lineament extraction method can be useful for ground water Exploration. 3) A comparison of Figures shows that the lineament major trend are correlated with high density variation zones of the study area. This can be an indication of the direction of groundwater movement in the studied area from NETO SW. 4) Modification of geological map of study area after Sissakian (1997) by overlaying the extracted lineaments on the geological map. 5) Creating two lineament density maps fig (7) of study area that shows distance between any positions on the map to the nearest lineament.
References [1] Anudu GK, Onuba LN, Ufondu LS (2011). Geoelectric sounding for groundwater exploration in the crystalline basement terrain around Onipe and adjoining areas, southwestern Nigeria. J. Appl. Technol. Environ. Sanit. 1(4):343-354 [2] Abdullah, A., J.M. Akhir and I. Abdullah, 2010, Automatic Mapping of Lineaments Using Shaded Relief Images Derived from Digital Elevation Model (DEMs) in the Maran - Sungi Lembing Area, Malaysia, The Electronic Journal of Geotechnical Engineering, 15: 949-957. [3] Quays, Saud, 2009, hydrogeological and hydrochemical study OfKirkuk governorate, northern Iraq,Iraqi mining and geology magazine VOL5.PP3-13... [4] Jassim, S.Z. and J.C. Goff, 2006. Geology of Iraq. Dolin, Prague and Moravian Museum, Brno, Czech Republic, PP197 [5] PCI Geomatica (2001) “PCI Geomatica user’s guide version 9.1”, Ontario. Canada: Richmond Hill [6] Magowe, M, & Carr, J. R. (1999). Relationship between lineaments and ground water Occurrence in western Botswana. Ground Water 37 (2), 282-286.
Paper ID: SUB154653
Volume 4 Issue 5, May 2015 www.ijsr.net Licensed Under Creative Commons Attribution CC BY
2233