1. INTRODUCTION. Off-line signature verification by means of an automatic sys- .... have been digitized with a scanner at 600 dpi (dots per inch). The resulting ...
AUTOMATIC MEASURES FOR PREDICTING PERFORMANCE IN OFF-LINE SIGNATURE F. Alonso-Fernandeza , M.C. Fairhurstb , J. Fierreza and J. Ortega-Garciaa . a
Biometric Recognition Group - ATVS, Escuela Politecnica Superior - Universidad Autonoma de Madrid Avda. Francisco Tomas y Valiente, 11 - Campus de Cantoblanco - 28049 Madrid, Spain {fernando.alonso, julian.fierrez, javier.ortega}@uam.es b
Department of Electronics, University of Kent, Canterbury, Kent CT2 7NT, UK {M.C.Fairhurst}@kent.ac.uk ABSTRACT
Performance in terms of accuracy is one of the most important goal of a biometric system. Hence, having a measure which is able to predict the performance with respect to a particular sample of interest is specially useful, and can be exploited in a number of ways. In this paper, we present two automatic measures for predicting the performance in off-line signature verification. Results obtained on a sub-corpus of the MCYT signature database confirms a relationship between the proposed measures and system error rates measured in terms of Equal Error Rate (EER), False Acceptance Rate (FAR) and False Rejection Rate (FRR). 1
that sample. There are numerous roles of a quality measure in the context of biometric systems [4]: i) quality algorithms may be used as a monitoring tool [6]; ii) quality of enrolment templates and/or samples acquired during an access transaction can be controlled by acquiring until satisfaction (recapture); and iii) some of the steps of the recognition system can be adjusted based on the estimated quality (quality-based adaptation [7]). In this paper, we present two automatic measures that are used to predict the performance in off-line signature verification. Our goal is to determine how the proposed measures affect system error rates. Reported results show a dependence between the performance and the value of the measures.
Index Terms— Biometrics, document image processing, pattern recognition, handwriting recognition 1. INTRODUCTION Off-line signature verification by means of an automatic system is a long-established pattern classification problem, where only the image of a signature is available for recognition [1]. The importance of signature verification arises from the fact that it has long been accepted in government, legal, and commercial transactions as an acceptable method of verification [2]. As a result, a number of strategies have been proposed for signature verification [3]. It is worth noting that even professional forensic examiners perform at about 70% of correct classification rate, and thus this is a challenging research area. It is generally accepted that biometric sample quality is a scalar that is related to the performance of a biometric matcher [4, 5]. In other words, the “quality” of a biometric sample is a prediction of the recognition performance associated with 1 This work has been carried out while F. A.-F. was guest scientist at the University of Kent. This work has been supported by Spanish MCYT TIC2003-08382-C05-01, by Spanish MCYT TEC2006-13141-C03-03 and by European Commission IST-2002-507634 Biosecure NoE projects. Author F. A.-F. thanks Consejeria de Educacion de la Comunidad de Madrid and Fondo Social Europeo for supporting his PhD studies. The author J. F. is supported by a Marie Curie Fellowship from the European Commission.
1-4244-1437-7/07/$20.00 ©2007 IEEE
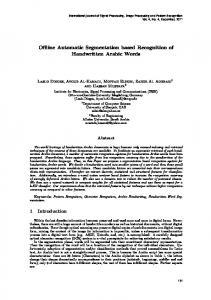
2. OFF-LINE SIGNATURE IMAGE MEASURES We propose two automatic measures: the first measures the area of a signature where slants with different directions intersect, while the second measures the intra-variability of a given set of signatures. We first preprocess input signature images by performing the following steps: binarization by global thresholding of the histogram [8], morphological closing operation of the binarized image, segmentation of the signature outer traces, and normalization of the image size to a fixed width while maintaining the aspect ratio. Segmentation of the outer traces is done because signature boundary normally corresponds to flourish, which has high intra-user variability, whereas normalization of the image size is aimed to make the proportions of different realizations of an individual to be the same. Next, slant directions of the signature strokes and those of the envelopes of the dilated signature images are extracted. For slant direction extraction, the preprocessed signature image is eroded with 32 structuring elements like the ones presented in the middle row of Fig. 1, each one having a different orientation regularly distributed between 0 and 360 degrees [9], thus generating 32 eroded images. A slant direction feature sub-vector of 32 components is then generated,
I - 369
ICIP 2007
Fig. 1. Example of two eroded images (bottom row) of a given signature image (top row). The middle row shows the two structuring elements used for the erosion. The dotted circle denotes a region of the signature having various strokes crossing in several directions. In this region, no predominant slant direction exists. Signature 1
signature 1 signature 2 20
15
10
5
0
5
10
15
20
Number of erosions
25
30
Cumulative number of pixels (%)
Cumulative histogram
25
Number of pixels (%)
Signature 2
Cumulative histogram
100
generated as explained above, a small degree of overlap is expected among them (i.e. any pixel should be marked in as few eroded images as possible). However, there may be regions of the signature having various strokes crossing with several directions. In these regions, no predominant slant direction exists or, in other words, any estimation of a dominant slant direction will be unreliable. As a result, pixels of these regions will be marked in many of the eroded images, as can be seen in Fig. 1. For each pixel of the signature, we count the number of eroded images in which it is marked and then, we plot the histogram and the cumulative histogram for all the pixels of the image (Fig. 2). We can see from Fig. 2 that the histogram of signature 1 is concentrated in low values, whereas it is displaced to higher values for signature 2. This is because signature 2 exhibits many regions having various strokes crossing with several directions. We measure the size of these regions by computing the x-axis point in which the cumulative histogram reaches a certain value (in our experiments, this value is set to 50%, as seen in Fig. 2). The higher the value this point has, the larger is the area of the signature with no predominant slant direction. For now on, this measure will be denoted as Slant Measure.
90 80
2.2. Variability Measure
70 60 50 40 30 20 10 0
5
10
15
20
Number of erosions
25
30
Fig. 2. Histogram (left bottom) and cumulative histogram (right bottom) of the number of eroded images in which a pixel is marked for the two example signatures shown. where each component is computed as the signature pixel count in each eroded image. For envelope direction extraction, the preprocessed signature image is successively dilated 5 times with each one of 6 linear structuring elements, whose orientation is also regularly distributed, thus generating 5 × 6 dilated images. An envelope direction feature sub-vector of 5 × 6 components is then generated, where each component is computed as the signature pixel count in the difference image between successive dilations. The preprocessed signature is finally parameterized as a vector o with 62 components by concatenating the slant and envelope feature sub-vectors. For additional details of these steps, including the structuring elements used for erosion and dilation, we refer the reader to [9] and the references therein. 2.1. Slant Measure The area of a signature where slants with different directions intersect is measured as follows. Given the 32 eroded images
The intra-variability of a given set of K signatures of a client is computed as follows. We first extract an statistical model λ = (μ, σ) of the client which is estimated by using the set of K signatures, parameterized as {o1 , ..., oK }. The parameters μ and σ denote mean and standard deviation vectors of the K vectors {o1 , ..., oK }. We then compute the Mahalanobis distance [10] of each signature oi (i = 1, ..., K) to the statistical model λ, resulting in K distances di (i = 1, ..., K). The variability is finally computed as var(d�1 , ..., d�K ), where d�i = di /E(d1 , ..., dK ). The operators E(.) and var(.) are the statistical mean and variance, respectively. Before distances di are used, they are normalized by E(d1 , ..., dK ), so that we compensate for the displacements of the user-dependent matching score distributions commonly found in signature verification [11, 7]. In the rest of the paper, this measure will be denoted as Variability Measure. 3. EXPERIMENTAL FRAMEWORK 3.1. Database and protocol We have used for the experiments a subcorpus of the larger MCYT database [12]. MCYT includes fingerprint and on-line signature data of 330 contributors from 4 different Spanish sites. In the case of the signature data, skilled forgeries are also available. Imitators are provided the signature images of the client to be forged and, after an initial training period, they are asked to imitate the shape with natural dynamics. Signature data of the MCYT database were acquired using an inking pen and paper templates over a pen tablet (each
I - 370
90 80 70 60 50 40 30
5TR sign 10TR sign
20 10 0
2
4
6
8
10
12
Measure value
14
16
18
Cumulative distrib. function (%)
Cumulative distrib function (%)
Slant measure
100
100
Intra-variability of the signatures of the enrolment set Variability measure
90
TR sign
point EER
5
FA=10
80 70 60 50
FR=10
40 30
EER
20 10 0 0
10 0.1
0.2
0.3
Measure value
0.4
FA=10
0.5
FR=10
Fig. 3. Cumulative distribution function of the two proposed measures in the database used for our experiments. signature is written within a 1.75 × 3.75 cm2 frame). Paper templates of 75 signers (and their associated skilled forgeries) have been digitized with a scanner at 600 dpi (dots per inch). The resulting subcorpus comprises 2, 250 signature images, with 15 genuine signatures and 15 forgeries per user (contributed by 3 different user-specific forgers). Two examples can be seen in Fig. 2. The experimental protocol is as follows. The training set of each user comprises either 5 or 10 genuine signatures (depending on the experiment under consideration). For each client, we compute its statistical model λ = (μ, σ) using the training set. Given a test signature of the client, the similarity score s between the model λ and the parameterized test signature o is computed as the inverse of the Mahalanobis distance. Genuine test scores are computed by using the remaining genuine signatures. For a specific target user, casual impostor test scores are computed by using the genuine samples available from all the remaining targets. Real impostor test scores are computed by using the skilled forgeries of each target. As a result, we have 75 × 10 = 750 or 75 × 5 = 375 client similarity scores, 75 × 15 = 1, 125 impostor scores from skilled forgeries, and 75×74×10 = 55, 500 or 75×74×5 = 27, 750 impostor scores from random forgeries. In order to have an indication of the level of performance with an ideal score alignment between targets, results here are based on using a posteriori user-dependent score normalization [7]. Information from both client and impostor score variability is used as s� = s − sp (client, impostor), where s� is the normalized matching score and sp (client, impostor) is the target-dependent decision threshold at a selected point p obtained from the histograms of client and impostor test scores. In the work reported here, we record verification results at three points: EER, FAR=10% and FRR=10%. For additional information on a posteriori user-dependent score normalization techniques, we refer the reader to [7]. 3.2. Results and discussion In order to evaluate the performance based on the proposed measures, a ranking of signers is carried out. For the measure
TR sign
point EER
5
FA=10 FR=10 EER
10
FA=10 FR=10
Skilled forgeries I (low var) II (med) 24.13 24.8 (+1.47%) (+4.29%) FR=43.2 FR=46 (+4.17%) (+10.92%) FA=40 FA=42 (-0.99%) (+3.96%) 22.67 20 (+2.44%) (-9.63%) FR=32.8 FR=34.4 (-13.98%) (-9.78%) FA=40.27 FA=35.6 (+4.87%) (-7.29%)
III (high) 22.4 (-5.8%) FR=35.2 (-15.12%) FA=39.33 (-2.65%) 22.67 (+2.44%) FR=47.6 (+24.84%) FA=40 (+4.17%)
Overall 23.78
Random forgeries I (low var) II (med) 10.01 10.2 (+2.25) (+4.19) FR=13.2 FR=14.8 (-3.86) (+7.79) FA=15.24 FA=16.77 (-1.1) (+8.83) 6.69 5.85 (-7.85) (-19.42) FR=6.4 FR=4.8 (+2.07) (-23.45) FA=12.89 FA=7.47 (+24.9) (-27.62)
III (high) 9.34 (-4.6) FR=13.2 (-3.86) FA=14.4 (-6.55) 8.92 (+22.87) FR=7.6 (+21.21) FA=10.68 (+3.49)
Overall 9.79
41.47 40.4 22.13 38.13 38.4
13.73 15.41 7.26 6.27 10.32
Table 1. System performance based on the intra-variability of the signatures of the enrolment set of a client. Results are given in %. For each level of variability, the relative gain/loss of performance with respect to the overall results is given (in brackets).
that computes the area where slants with different directions intersects, the ranking is based on the average measure of the set of enrolment signatures. For the measure that computes the intra-variability of a set of signatures, the ranking is based on the intra-variability of the signatures of the enrolment set. Fig. 3 depicts the cumulative distribution function of the two measures for all the users of the database. In Fig. 4, we can see the verification performance results as we reject users with the largest area with no predominant slant direction (from right to left in the x−axis). It is observed that, in general, the performance improves as we consider signers with lowest Slant Measure (i.e. smaller area with no predominant slant direction). This is particularly evident for the case of random forgeries. For instance, if we reject users with a Slant Measure higher than 4.5, both FAR and FRR are reduced by around 50% for random forgeries. It is also worth noting that we obtain better performance by considering more signatures for enrolment. Table 1 shows the verification performance results in relation to the intra-variability of the signatures of the enrolment set. Users are classified into three equal-sized disjoint groups, from I (low variability) to III (high variability), based on the Variability Measure, resulting in 25 users per group. It is observed that, in general, high variability results in improved performance when we have few signatures for enrolment. On
I - 371
FA (%)
EER (%) 30
FR (%)
45
45
40
40
25
35
35 20
5TR sign−skilled
30
30
25
10TR sign−skilled 15
25
5TR sign−random
20
10TR sign−random
20
10
15
15 5 0 4.5
10
10 5
5.5
6
Measure value
6.5
7
5 4.5
5 5
5.5
6
Measure value
6.5
7
0 4.5
5
5.5
6
Measure value
6.5
7
Fig. 4. System performance based on the Slant Measure. the other hand, if we increase the number of signatures used for enrolment, better error rates are obtained with a less variable set. An explanation is as follows. Having a small and low variable set does not account for enough discriminative information relating to the user. On the other hand, a small and variable set accounts for potential variations in the genuine samples, thus resulting in a richer modeling of the user identity. When using a small enrolment set, the discriminative capability comes from its variability. By contrast, a bigger enrolment set contains more discriminative information of the user by itself and, in this case, variability is a source of uncertainty, rather than a source of discriminative information. However, a certain amount of variability is also desirable, as shown by the fact that low variability (group I) does not result in the best performance. 4. CONCLUSIONS Two automatic measures for off-line signature images are presented: one that measures the area of the signature where slants with different direction intersect (i.e. no predominant direction can be found), and one that measures the intravariability of a set of signatures. Both measures are used to predict the performance in automatic off-line signature verification. We observe that the performance of our system is improved as users with the largest area with no predominant direction are rejected (see results in Fig. 4). We also obtained some experimental findings using the proposed variability measure. With more signatures in the enrolment set, less variability is desirable. A scalar measure which predicts the performance of biometric matchers with a particular sample of interest can be used in several ways. For instance, the steps of the recognition system can be adjusted based on the computed measure [13]. Results in other biometric traits [14] showed that exploiting differences in performance of several matchers with respect to a quality measure can be used to improve verification rates. Future work will include the evaluation of other approaches for off-line signature recognition [3] based on the proposed measures, and their incorporation in a multibiomet-
ric fusion scheme. In several off-line signature verification scenarios, it is feasible to combine automatic measures with human assessed measures [15], and will be another source of future work. 5. REFERENCES [1] R. Plamondon and G. Lorette, “Automatic signature verification and writer identification - the state of the art,” Pattern Recognition, vol. 22, no. 2, pp. 107–131, 1989. [2] A.K. Jain, A. Ross, and S. Prabhakar, “An introduction to biometric recognition,” IEEE Trans. on Circuits and Systems for Video Technology, vol. 14, no. 1, pp. 4–20, January 2004. [3] G. Dimauro, S. Impedovo, M.G. Lucchese, R. Modugno, and G. Pirlo, “Recent advancements in automatic signature verification,” Proc. IWFHR, pp. 179–184, 2004. [4] P. Grother and E. Tabassi, “Performance of biometric quality measures,” IEEE Trans. on PAMI, vol. 29, pp. 531–543, 2007. [5] R. Youmaran and A. Adler, “Measuring biometric sample quality in terms of biometric information,” Proc. Biometrics Symposium, 2006. [6] T. Ko and R. Krishnan, “Monitoring and reporting of fingerprint image quality and match accuracy for a large user application,” Proc. AIPR, pp. 159–164, 2004. [7] J. Fierrez-Aguilar et al., “Target dependent score normalization techniques and their application to signature verification,” IEEE Trans. SMC-C, Special Issue on Biometric Systems, vol. 35, no. 3, 2005. [8] N. Otsu, “A threshold selection method for gray-level histograms,” IEEE Trans. SMC, vol. 9, pp. 62–66, Dec. 1979. [9] J. Fierrez-Aguilar et al., “An off-line signature verification system based on fusion of local and global information,” in Proc. BIOAW, LNCS-3087, pp. 295–306, 2004. [10] S. Theodoridis and K. Koutroumbas, Pattern Recognition, Academic Press, 2003. [11] A. Kholmatov and B. Yanikoglu, “Identity authentication using improved online signature verification method,” Patt. Recogn. Letters, vol. 26, no. 15, pp. 2400–2408, 2005. [12] J. Ortega-Garcia et al., “MCYT baseline corpus: a bimodal biometric database,” IEE Proc. VISP, vol. 150, no. 6, pp. 395–401, Dec. 2003. [13] J. Fierrez-Aguilar, J. Ortega-Garcia, J. Gonzalez-Rodriguez, and J. Bigun, “Discriminative multimodal biometric authentication based on quality measures,” Patt. Recogn., vol. 38, no. 5, pp. 777–779, 2005. [14] J. Fierrez-Aguilar, Y. Chen, J. Ortega-Garcia, and A.K. Jain, “Incorporating image quality in multi-algorithm fingerprint verification,” Proc. ICB, LNCS-3832, pp. 213–220, 2006. [15] M.C. Fairhurst and E. Kaplani, “Perceptual analysis of handwritten signatures for biometric authentication,” IEE Proc. Vis. Image Signal Process, vol. 150, pp. 389–394, 2003.
I - 372