http://www.chembur.com/carnatic/. [5]. Varadarangan, 2000. Shruthi Lakshna Prakashini. [6]. Sridhar, R. and Geetha, T.V. 2006. Swara identification of Carnatic ...
Special Issue of International Journal of Computer Applications (0975 – 8887) International Conference on Electronic Design and Signal Processing (ICEDSP) 2012
Automatic Music Note Transcription System using Artificial Neural Networks Ramya S.
T.K. Padmashree
Assistant Prof-Senior Scale E & C Dept , MIT,
Associate Prof-Senior Scale E & C Dept, MIT,
Manipal.
Manipal.
ABSTRACT In this work, we propose a method to identify and transcript the note of a Carnatic music signal. The main motive behind note transcription is that, it can be used as a good basis for music note information retrieval of Carnatic music songs or Film songs based on Carnatic music. The input monophonic music signal is analysed and made to pass through a signal frequency extracting algorithm. The frequency components of the signal are then mapped into the swara sequence, which could be used to determine the Raga of the particular song and can be used in Carnatic music training institutes to verify the correctness of the Carnatic music note.
General Terms Artificial Neural Network, Note Identification, Digital Signal Processing.
Keywords Audio signal Processing;Autocorrelation; Carnatic music;Probalistic Neural Network; Pitch; Swara; Shruthi.
1. INTRODUCTION One of the God's gifts to mankind is the spiritual elevation that comes as a response to sound & rhythm. This is the basis for nadopasana which holds that music is divine. Music can thus be defined as an art form that arranges sounds in a fashion that follows certain natural principles and provides that special inner feeling of happiness and contentment. Its common elements are pitch (which governs melody and harmony), rhythm and the sonic qualities of timbre and texture. Carnatic music is a traditional music of South India. It is one of two main sub-genres of Indian classical music that evolved from ancient Hindu traditions; the other sub-genre being Hindustani music, which emerged as a distinct form due to Persian and Islamic influences in North India. Offline Carnatic music note identification involves the recognition of vocal musical patterns in digital form. Western music is often based on a pattern of flat notes; on the contrary, here the notes are performed using various modulations and based on relative positioning based on shruthi [1]. This is a challenging computational problem mainly due to the vast differences associated with the vocal patterns of different individuals. Music note transcription can be thought of as part of Multimedia information retrieval.A lot of work has been done in the other components of multimedia like text, video and the one that is yet to be fully developed is audio. Audio processing involves processing speech and music. In this paper we discuss music processing which could be used as the basis of music information retrieval using music
characteristics. Music note transcription is the need of the hour due to the availability of large amount of music on the Internet. Disasters one can expect are time consumption due to huge data set and prerequisite knowledge of Carnatic music note. This is the motivation to build automated Carnatic music note transcription system to manage this disaster. This paper is organized as follows: Section 2 discusses about the Characteristics of Carnatic music, Section 3 discusses on Existing work in note identification, Section 4 discusses on the proposed System Architecture, Section 5 discusses on Results and Evaluation and Section 6 concludes the paper.
2. OVERVIEW OF CARNATIC MUSIC The origin of Carnatic music can be traced back to the age of Vedas. Bharata's Natya Shastra, from around the 5th century A.D., and Saranga Deva's Sangita Ratnakara [1], from the early 13th century A.D., are considered to be the earliest recorded documents available on the theory and performance of Indian classical music. Carnatic music is based on a 22 scale note (swara). But in all its practical aspects and purposes, not more than 16 notes are generally used. A unique combination of these notes evolves separate ragas. The features and the constraints of a raga is clearly defined in the arrangement of the notes in its Arohana (ascending notes) and Avarohana (descending notes). Thus, in Carnatic music, the raga connotes a mood or a route in which the music is supposed to travel.
1.1 Swara The basic unit of music is the swara (note) which simply indicates the position in the audible spectrum occupied by a particular sound or the pitch of the sound. Carnatic music has seven swaras known as Saptha swaras. They are Shadjamam (Sa), Rishabam (Ri), Gandharam (Ga), Madhyamam (Ma), Panchamam (Pa), Dhaivatham (Dha), Nishadam (Ni). Of these, Sa and Pa do not admit variations and are called achala (fixed) swaras [2]. The other five (Ri, Ga, Ma, Dha and Ni) admit varieties and indicated by index numbers 1,2 and 3 leading to the total of 16 notes. Among these notes, Ri3, Ga1, Da3, Ni1 are rarely used. Thus we have 12 notes which are commonly used [2].
1.2 Sthayi (Octave) It is a set of seven swaras which can be rendered with melody. It is range of swaras from Lower Sa to Higher Sa. Carnatic music has 3 set of sthayis, Mandra (Lower) sthayi, Madhya (Middle) sthayi and Tara (Upper) sthayi [2].
11
Special Issue of International Journal of Computer Applications (0975 – 8887) International Conference on Electronic Design and Signal Processing (ICEDSP) 2012
1.3 Shruthi It is the lowest sound in the middle octave (lower Sa). Indian music is based on relative positioning [2] and thus, notes are not of fixed pitch. This is known as just tempered scale. The note Sa is analogous to the note C. Once the Sa has been set to that pitch and all other swaras occupy corresponding position or sthanas [3], [4]. So it is known as Aadhara shadja .Table 1 gives the relation between shruthi and different notes in Fraction and cents [5].
testing. These are analyzed using Speech Processing techniques. Note Identification is done using Neural Network methodologies. Figure 1 shows the block diagram of Automatic Carnatic music Note Transcription system.
Table 1: Relation between Shruthi and different notes No
Swara
1 2 3 4 5 6 7 8 9 10 11 12
Sa(Shruthi) Ri1 Ri2 Ga2 Ga3 Ma1 Ma2 Pa Dha1 Dha2 Ni2 Ni3
Relative value 1 256/243 9/8 32/27 81/64 4/3 729/512 3/2 128/81 27/16 16/9 243/128
Fraction
Cents
1 1.053 1.125 1.185 1.265 1.333 1.423 1.5 1.58 1.68 1.777 1.898
0 90 204 294 408 498 612 702 792 906 996 1110
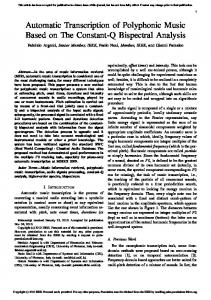
Fig 1: Block diagram of Note Transcription system Speech refers to the processes associated with the production and perception of sounds used in spoken language. The classification of sounds is determined by the manner and point of articulation. Important factor is its fundamental frequency (Pitch) and formants [12], [13]. A formant is an acoustic resonance of the human vocal tract and measured by a peak in the frequency spectrum of the sound. The peaks are called formants F1, F2, F3 etc [12]. Figure 2 shows spectugram and pitch contour of the 12 note when swaras uttered.
Cent calculation : Example: Note Pa has relative value 3/2 with shruthi. Now Log (3/2) = 0.176, and multiply by 3986 we will get 702.
3. LITERATURE REVIEW Literature work in Carnatic music retrieval is on a slow pace compared to Western music. Some work is being done in Swara identification [6] and Singer identification [7] of Carnatic music. In Hindustani music work has been done in identifying the Raga of Hindustani music [8]. In [8] the authors have created a HMM based on which they have identified two ragas of Hindustani music. The fundamental difference between Hindustani Raga pattern and Carnatic Raga pattern is that in Hindustani we have R1, R2 as against R1, R2, R3 in Carnatic. Similarly G, D, N all has three distinct frequencies in Carnatic music as compared to two frequencies in Hindustani [9]. This reduces the confusion in identifying the distinct frequencies in Hindustani music as compared to Carnatic music. On the western music aspect, melody retrieval is being performed by researchers. The one proposed by [10] is based on identifying the change in frequency in the given query. The query is received in the form a humming tune and based on the rise and fall in the pitch of the received query, the melody pattern that matches with the query’s rise and fall of pitch is retrieved. In the work proposed by [11] for melody retrieval the authors have identified melody based on features like distance measures and gestalt principles. The approach we have followed is based on low level signal features and we have identified the notes using probabilistic neural network.
4. METHODS AND MATERIALS The monophonic musical notes are recorded with sampling rate 44100Hz, and saved in .wav format. Swara samples of 75 each for 12 notes were recorded. Among these, 25 were rendered in akara, 25 samples with Swara and 25 as Sahithya .Out of 75 samples,50 are used for training, 25 are used for
Fig 2: Spectugram and pitch contour of Sa Ri1 ga3 ma1 pa da1 ni3 Table 2 and Table 3 shows analysis of Fundamental frequency F0 and formant F1, F2 of some of the notes Table 2. Fo,F1, F2 for Musical Note ‘Sa’ (Shruthi or Adhara shadja) Frequency in Hz F0 F1
1 190.04 342.14
Samples 2 3 1a 190.04 186.8 186.98 378.82 366.82 367.5
2a 191 404
3a 192 388
F2
902.59
890.08
994
993
956
957.8
Table 3. Fo,F1, F2 Musical note Ni3 Frequency in Hz F0 F1 F2
1
2
3
1a
355.4 356 355.3 355.8 368 483 552 370 842 1051 613 907
2a
3a
354.8 365.2 839
355 484 1050
12
Special Issue of International Journal of Computer Applications (0975 – 8887) International Conference on Electronic Design and Signal Processing (ICEDSP) 2012 Samples 1a, 2a, 3a are notes when hummed in akara. From Table 2 and Table 3 we can infer that the formant F1, F2 values are varying with different phonic letter but fundamental frequencies are almost same. Fundamental frequency of musical note is found to be more dominating factor in case of Carnatic music. Here autocorrelation method is used for calculating the fundamental frequency [14].
Since the musical clip may contain unvoiced signal also, another output neuron is added to recognize it. Thus we have 13 output neurons. The output of Note Identification gives array of note classes representing each note. These note classes are given as the input to note merger module which merges the successive, same notes and then transcription of note is displayed using Note transcription system.
4.1 De-noising Module
5. RESULTS
The audio file is read in a 2-D array and is passed through denoising module to remove the noise. Savitzky-Golay FIR smoothing filter (also called least-squares smoothing filters) was used which "smooth out" a noisy signal whose bandwidth (without noise) is large.
A data base of musical notes of the musician having same shruthi is constructed. The fundamental frequency of the sample calculated using auto-correlation and given as the input to the neural network. Using MATLAB the musical clip is read, de-noised and displayed as shown in figure 4.
4.2 Auto- correlation module The de-noised data is windowed using suitable window size and window type. Here we used 40ms window size with 75% overlapping. The windowed data is given to the autocorrelation module to determine its fundamental frequency. The process is applied to the whole signal to get array of fundamental frequency. This array is then fed to the Note Identification module.
4.2 Note Identification module Note identification is done using Artificial Neural Network trained on Carnatic music Note Identification. Neural Network is inspired by biological nervous systems. It is a system composed of many simple processing elements, operating in parallel with each other. It can acquire, store, and utilize experiential knowledge [15], [16]. Here Probabilistic Neural Network (PNN) was used.
Fig 4: Display of Musical Clip Figure 5 shows screen shot of Automatic Note Transcription System showing the fundamental frequency and formant frequencies of one note.
4.2.1 Probabilistic Neural Networks Probabilistic neural networks can be used for classification problems [16], [17].. When an input is presented, the first layer computes distances from the input vector to the training input vectors, and produces a vector whose elements indicate how close the input is to a training input. From the experiment, it is found that there is a variation of ±5Hz of the calculated frequencies [18]. This is taken care in first layer of the neurons by using Radial Basis function as shown in Figure 3.
Fig 5: Screen shot of Note Transcription System. For the given note sample, calculated fundamental frequency is 297.77. For the shruthi of 190Hz, this frequency is in the range of ±5 of 300.2(190*1.58 = 300.2 from table 1). It is correctly identified as Dha1 in Automatic Note Transcription System as shown in Figure 6.
Fig 3. Radial basis function The second layer sums these contributions for each class of inputs to produce as its net output a vector of probabilities. Finally, a compete transfer function on the output of the second layer produces a 1 for the corresponding largest element and 0’s elsewhere [19]. Shruthi and fundamental frequency of each window is given as the input to PNN network. Output contains 12 neurons representing each note and ± 5 class variations were used.
Fig 6: Output of PNN Autocorrelation is performed for whole musical clip, which results in the array of fundamental frequency (F0 [ ]) as shown in figure 6. The wavy structure in figure 7 indicates that each note is rendered with modulation.
13
Special Issue of International Journal of Computer Applications (0975 – 8887) International Conference on Electronic Design and Signal Processing (ICEDSP) 2012
Musical Note
Fig 7: Display of array of fundamental frequency (F0[] ) Array of fundamental frequency is given as the input to the Note Identification module which will result into array of note classes as shown in figure 7.The wavy structures in figure 6 is converted into identified note class as shown in y axis of figure 8.
Fig 8: Display of Array of Note classes The successive common notes are merged in Note Merger module. Thus it gives the duration of each note leading to the segmentation of musical clip as shown in figure 9.
Table 4. Classification Results Number of Number Percentage of Test
of
correct
Samples
success
classification %
Sa
25
24
96
Ri1
25
23
92
Ri2
25
24
96
Ga2
25
23
92
Ga3
25
24
96
Ma1
25
24
96
Ma2
25
23
92
Pa
25
24
96
Da1
25
23
92
Da2
25
24
96
Ni2
25
24
96
Ni3
25
24
96
6. CONCLUSION A DSP and Neural network based system for the automated note transcription system for Carnatic music is developed and tested. The system shows above 90% accuracy. It is GUI based so it is easy for the user to operate and results of any steps can be visualized and Note Transcription for the given musical clips can be obtained. Summary of the Raga Identification can be viewed with its sampling frequency, shruthi, length of the musical clip, time duration. It can be worked on for Polyphonic music. The work can be extended for Raga Identification.Using note transcription system, a search engine can be built to search, music based on content rather than text. It can also be used in Carnatic music training institutes to verify the correctness of the Carnatic music note. In this system shruthi is kept constant and it can be experimented with other Shruthis.
Fig 9: Output of Note Merger (Vocal Music clip)
Fig 10: Output of Note Merger (Keyboard) Figure 10 shows the output of Note Merger module for the music recorded for keyboard, which shows clear segmentation of notes. Thus comparing Figure 8 and 9, it concludes that vocal music contains complex mixture of frequency than keyboard music sample. Then identified notes are sent to Note Transcription Module, which displays the note content in the given musical clip as shown in figure 11.
Fig 11: Output of Note Transcription System Table 4 provide the results of other notes used for classification
7.
REFERENCES
[1]
Sriram, P. 1990 . A Karnatic Music primer.
[2]
K. Balasubramanian,“Combinatorial Enumeration of Ragas (Scales Of Integer Sequences) of Indian Music”, Journal of Integer Sequences, Vol. 5 (2002), Article 02.2.6.
[3]
Sambamurthy, 1982. South Indian Music, vol. 4.
[4]
Carnatic Music Origin & http://www.chembur.com/carnatic/.
[5]
Varadarangan, 2000. Shruthi Lakshna Prakashini.
[6]
Sridhar, R. and Geetha, T.V. 2006. Swara identification of Carnatic music. In Proceedings of the IEEE Conference on Information Tecnology.
[7]
Sridhar, R. and Geetha, T.V. 2008. Music Information Retrieval of Carnatic Songs Based on Carnatic Music
Development,
14
Special Issue of International Journal of Computer Applications (0975 – 8887) International Conference on Electronic Design and Signal Processing (ICEDSP) 2012 Singer Identification. In Proceedings of the IEEE conference on Computer and Electrical Engineering.
[14]
Rabiner,L.R., and Schafer, Processing of Speech Signals.
[8]
Pandey, G. ,Mishra, C., Ipe, P. 2003. Tansen: A System for Automatic Raga identification. In Proceedings of the 1st Indian International Conference on Artificial Intelligence, Hyderabad,1350-1363.
[15]
Berthold, M., Thiel, K., 2007. Artificial Neural Networks: Local Basis Function Networks: RBF, PNN Neuro-Fuzzy / Fuzzy-Neuro, VL 7.
[16]
[9]
Vir, R. 1999. Theory of Indian Music.
Jang, J. R., Sun, C. and Mizutani, E., 1997. Neuro-Fuzzy and Soft Computing: A Computational Approach to Learning and Machine Intelligence.
[17]
Nikola, K., Kasabov, 1998. Foundations of Neural Networks, Fuzzy Systems, and Knowledge Engineering.
[18]
Ramya, L., Padmashri,T.K ,2009. Carnatic Music Note Identification using DSP and Neural Networks. In Proceedings of Int. Conf .Electronic Design and Signal Processing, MIT , Manipal.
[19]
H.Demuth and M. Beale. Neural Network TOOLBOX User’s Guide. For use with MATLAB. The Math Works lne.. (1998)
[10]
Rao, P. and Anand Raju, 2002. Building a melody retrieval system. In Proceedings of the National Conference on Communications, IIT Bombay.
[11]
Maarten G. 2005, Melody retrieval based on the Implication Realization model. MIREX 2005
[12]
Kent,R. and Read, C. 1995. The Acoustic analysis of Speech.
[13]
Furui, and Sadaoki, 2000. Digital Speech Processing, Synthesis, and Recognition.
R.W.
1978.
Digital
15