transmissions, the authors propose an objective picture quality measurement method for coded pictures that uses embedded invisible marker signals and does ...
Automatic objective picture quality measurement method using invisible marker signals as Reduced References Osamu Sugimoto, Ryoichi Kawada, Masahiro Wada and Shuichi Matsumoto Visual Communications Laboratory, KDDI R&D Laboratories Inc. 2-1-15 Ohara, Kamifukuoka-City, Saitama, 356-8502 Japan ABSTRACT To automate the operation and monitoring of digital video transmissions, the authors propose an objective picture quality measurement method for coded pictures that uses embedded invisible marker signals and does not require reference pictures. The authors previously proposed a method for estimating PSNR by using the rate of false detection of binary information expressed by the marker signals. This paper proposes another method for estimating PSNR. This method is based on direct measurement of the magnitude of the marker signal degradation instead of the false detection rate of the embedded information. Since the theoretical model shows that the PSNR of the decoded pictures can be approximately calculated by measuring the degradation of only one amplitude component of the spread spectrum, the marker is embedded into the amplitude component of the spread spectrum domain and is detected from the decoded pictures to calculate the degradation. The proposed method can be applied to various types of video transmissions because this method is valid regardless of the kind of pictures, bitrates, or number of tandem codec connection stages. Furthermore, the proposed method is also applicable to high quality video transmissions because the degradation caused by embedding markers is negligibly small. Keywords: Objective Picture Quality Measurement, Automatic Picture Quality Measurement, PSNR estimation, Invisible Marker, Spread Spectrum 1. INTRODUCTION The rapid spread of digital broadcasting has made it essential to develop technology that supports the operation and monitoring of video transmission. One of the most essential points where digital transmissions differ from analog video transmission is that digital transmission includes compression coding such as MPEG-2 in its transmission process so that the bandwidth required for transmission is greatly reduced. However digital transmissions also cause picture quality degradation due to lossy compression and the degradation depends on original picture characteristics such as motion quickness and fineness. This is different from analog video transmissions where the degradation is constant due to transmission line conditions. Methods for evaluating picture quality degradation due to compression coding are therefore needed. To meet this demand, a subjective assessment method by humans has been standardized by ITUR[1]. However, subjective assessment [2][3] is not practical for picture quality monitoring because the operator has to watch the decoded picture at all times, placing a tremendous burden on the operator. New technologies for automatically evaluating the degree of
degradation have therefore been studied by ITU and Video Quality Experts Group (VQEG). Methods not relying on reference pictures are in particular demand because the original picture cannot be obtained at the receiver side in actual video transmissions. Two methods typically used to meet these demands are the No Reference (NR) and Reduced Reference (RR) methods. The NR method does not require any reference pictures and evaluates picture quality only by means of the decoded picture. The RR method extracts feature information from the original pictures and transmits the information by a lower bandwidth circuit to compare the feature information of the decoded pictures. However, the NR method has problems in improving the estimation accuracy because it cannot refer to the original picture. The RR method, although superior to the NR method in terms of estimation accuracy, requires an additional circuit to transmit the feature information and has the problem that transmission of reference information will cause a certain amount of delay in detecting the trouble. These methods therefore require further technical improvements. The authors therefore previously proposed a method for estimating the PSNR by making use of invisible markers embedded in the coded pictures[4]. This method estimates the PSNR of the decoded pictures according to the false detection rate of embedded binary information. This paper proposes a different method for estimating the PSNR based on directly measuring the marker signal degradation. In this proposed method, reference information can be derived without delay because the invisible markers, embedded into the original pictures prior to encoding, are detected from the decoded picture and the PSNR can also be estimated with high accuracy by using this reference information. In this paper, the authors first show the theoretical background of PSNR estimation by measuring the degradation of invisible markers. A method of embedding and detecting markers is then described in detail. Finally, computer simulations are conducted to show that highly accurate PSNR estimation is actually possible and the degradation caused by the markers is quite small. 2. THEORETICAL BACKGROUND This section describes a theoretical model of PSNR estimation by measuring the marker degradation. Note that we treat MSE, which is equivalent to PSNR, as an index of picture quality degradation. 2.1 Preconditions In the proposed method, we assume the following two conditions; The proposed method estimates the MSE of the decoded
pictures by comparing the frequency component of the original and the decoded picture. The comparison of the frequency component is done for every pixel block. These conditions are required because many current compression coding methods process the image signal by pixel blocks and so improved accuracy of detecting coding distortion can be achieved. 2.2 Theoretical model of MSE estimation Let x(b)(n) and x’ (b)(n) denote the pixel value of the original and decoded picture of block (b) respectively. Then, the MSE of the decoded picture can be expressed as follows: MSE =
∑ ∑ [x
N b −1 Np −1
(b )
( n) − x ( b ) ' ( n)
b =0 n= 0
] /( N 2
p
(1)
Nb )
where N b shows the number of blocks in the frame and N p shows the number of pixels in a block, respectively. Next, let s(b)PN(n) denote the PN sequence of the block and spread the spectrum of x(b)(n) and x’ (b)(n) . Then MSE can be written as:
MSE =
N b −1 N p −1
∑ ∑ [x
(b )
(n) ⋅ s PN (n) − x '
(b)
(n) ⋅ s PN (n)
b=0 k =0
] /(N 2
p
Nb )
(2) From Parseval’s equation, Eq.(2) can be can be modified as follows:
MSE =
N b −1 N p −1
∑∑ X
(b) SS
[k ] − X ' SS (b ) [k ]
b=0 k =0
=
Nb
Np
∑∑ E
(b ) SS
2
[k ]
b =0 k =0
2
/ ( N p Nb )
/(N p Nb )
(3)
where X SS( b ) [k] and X’ SS( b ) [k] respectively denote the spread spectrum of x(b)(n) and x’ (b)(n), and E SS( b ) [k] can be expressed as E SS( b ) [k]= X’ SS( b ) [k] - X’ SS( b ) [k]. Since Eq.(3) shows X’ SS( b ) [k] can be obtained from the decoded picture, this demonstrates that the MSE can be calculated by transmitting frequency components of the spread spectrum of the original pictures to the decoder side. However, in the RR method, not all the frequency components can be transmitted because of bandwidth restrictions on the circuit that transmits reference information. The proposed method is therefore assumed to transmit only one component. When we denote k0 as the frequency component to be transmitted, the power of the frequency component k0 can be expressed as follows: 2
E SS ( b ) [k0 ] =
N p −1
∑E
(b) SS
2
[ k ] / N p + D (b ) [ k 0 ]
(4)
k =0
In the above equation, if the spectrum of the original picture is spread uniformly, we can obtain D ( b ) [k] = 0. However, the actual value of |E SS( b ) [k]|2 is dispersed somewhat from the mean value of the power in the block since the frequency components are randomized by the spread spectrum. The following equation is therefore derived by substituting Eq.(4) into Eq.(3):
MSE =
N b −1
∑ E b=0
(b ) SS
[k 0 ] − D (b ) [ k0 ] / N b 2
=
N b −1
∑
2
(b )
E SS [ k 0 ]
b=0
/ Nb −
N b −1
∑D
(b )
b =0
[ k 0 ]/ N b
(5)
As a further characteristic of the spread spectrum, if we assume that the dispersion of D ( b ) [k0] is balanced between the blocks in the frame, as D (b ) [k 0 ] ≈ 0 , then the MSE can be
∑ b
approximated by the following. Nb
~ MSE •|
∑E
(b) SS
2
[k0 ]
b =0
/ Nb
(6)
Eq.(6) shows that the MSE can be estimated by transmitting just one frequency component using the characteristics of the spread spectrum. Finally, by applying X SS( b ) [k]=A[k]e jθ [k] and X’ SS( b ) [k] =A’ [k]e jθ [k], Eq.(6) can be expressed as follows:
MSE =
Nb
∑ ( A[k ] − A'[k ])e 0
jθ [ k0 ]
0
b=0
=
Nb
2
/ Nb
∑ A[k ] − A'[k ] / N 2
0
0
b
(7)
b =0
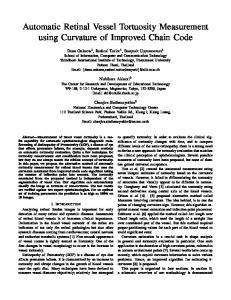
In the above equation, phase components of X SS( b ) [k] and X’ SS( b ) [k] are assumed to be unchanged because the orthogonal transform currently used for compression coding method does not affect the phase component of the image signals. Eq.(7) implies that the estimated MSE can ultimately be expressed by the difference in the amplitude component in the spread spectrum. This theoretical model indicates that the invisible marker should be embedded into the amplitude component of the spread spectrum so as to express the difference versus the amplitude component of the original picture. 3. PSNR ESTIMATION BY USE OF INVISIBLE MARKERS 3.1 Configuration This section proposes a method for embedding and detecting invisible markers. The configuration of the proposed method is shown in Figure 1. This figure assumes video transmission between two different locations. This system consists of a tandem connection of codecs with the addition of marker embedding and marker detection processing. In this configuration, the embedding and detection of the markers is isolated from the codecs so that generic codecs can be used. Since the marker detectors branch away from the mainstream of the video transmission, this method has the advantage that they do not affect the picture quality and transmission delay of the mainstream. 3.2 How to embed the markers Marker signals are embedded as binary information into pictures according to a data hiding method using the spread spectrum. In other words, marker signals have ‘0’ or ‘1’ information when they are embedded. Figure 2 shows the process for embedding the markers. The markers are embedded by means of the following procedure. 1 Generate a binary sequence for data hiding. This sequence is compared with sequences detected from the markers at the receiver side and used for calculating the marker
signal degradation. Arbitrary sequences can be used for the sequence, however these sequences must be shared between transmission and receiver side, so simple sequences are preferred.
When the quantized level of A is even, in other words, int( A/M ) = 2m (m: integer), the embedding is performed as follows: 1 A' = M (2m + ) 2 ¨ when bit=1 if A < M ( 2m + 1 ) : 2 ¨ when bit=0
Embeds invisible marker
input
ENC
DEC
ENC
(to bottom
Marker detector
(from top
)
DEC
Picture quality
DEC
ENC
)
otherwise:
where bit represents the embedded bit. Similarly, when the quantized level of A is odd, or in other words, int( A/M ) = 2m+1, the embedding is performed as follows; ¨ when bit=1 A' = M (2 m + 3 )
Output image
n
• ~
Marker detector
Marker detector
Picture quality
Picture quality
2 ¨ when bit=0 if A < M (2 m + 3 ) : 2
Figure 1 Configuration of the proposed system
otherwise: x ( b )( n )
FFT
Q
Embeds invisible marker
IQ
PN sequence
PN sequence
s (n )
s (n )
PN
PN
Spread Spectrum
Inverse Spread Spectrum Embedded binary information(0,1)
Figure 2 Marker Embedding Detected as bit=1
Detected as bit=0
800
600 embedded bit=1
Amplitude of original picture
A
1000
X SS [ k 0]
embedded bit=0 Amplitude of embedded picture
embedded=700
embedded=900
A'
X ' SS [ k 0]
Figure 3 Example of marker embedding (A=850, M=200, embedded bit=0). 2
Separate each input picture into blocks, spread the spectrum by multiplying by the PN sequence sPN(n) and calculate the spread spectrum XSS( b ) [k] according to the following equation: X ( b) SS[k ] = F{x ( b ) (n) × sPN(n)} ,
Obtain a spatial domain signal by using Inverse Fourier transformation and Inverse spread spectrum.
5
Repeat the above procedure for all blocks in the frame.
3.3 How to detect the markers A procedure similar to that used on the transmitter side is applied on the receiver side to detect the markers and the marker degradation is calculated. Figure 4 shows the procedure for detecting the marker. The markers are detected by the following procedure; 1 Separate the received picture into blocks and then calculate the spread spectrum XSS’’( b ) [k].
x' ' ( b )( n) (b)
The amplitude of a frequency component k0 in XSS [k], A=| XSS( b ) [k0]|, is manipulated so as to represent the binary information. Detection of the binary information on the receiver side is performed by checking the parity of the level value obtained by quantizing A by the step size M. After obtaining the parity, the following equations are applied to classify the bit. int ( A / M ) = 2m → bit = 0 int ( A / M ) = 2m + 1 → bit = 1
4
(8)
where F stands for Fourier transformation. 3
Since this change in the amplitude is caused by marker embedding, the difference of the amplitude, | A - A ’ |, corresponds to the amplitude component of the marker signal. This amplitude component will vary when the step size M is changed. Thus, M is the intensity of the marker embedding.
Detected as bit=1
original=850
1 A' = M (2m + ) 2 5 A' = M (2m + ) 2
An example of marker embedding is shown in Figure 3. In this figure, there are repetitive regions of bit=0 and bit=1 with period M. If the amplitude of the original picture (A=850) is in the same region as the embedded bit, A’ will be placed at the central point of the region (A ’ = 900). On the other hand, if A is placed in a region different from the embedded bit, then A’ will be placed at the central point of the adjacent region (A ’ = 700).
x ' ( b )( n )
IFFT
1 A' = M ( 2 m − ) 2 3 A' = M ( 2 m + ) 2
(9)
FFT PN sequence
Q
Marker Detection and Calculate Degradation
sPN (n ) Spread Spectrum
Figure 4 Marker detection
Marker Degradation
A bit=1
bit=0
850 M=200, embedded bit=0 bit=1
original=850
600
800
A
1000
X SS [ k 0]
(Original Picture)
Marker embedding Embedded A’=900
A'
Received A’’=820
M
200
X ' SS [ k 0]
(Original picture after Embedding Marker)
Transmission
Received A’’=1090 A ' ' Err (b)=80
Detected as bit=0 (True)
X ' ' SS [ k 0]
(Decoded Picture)
Err (b)=190
Detected as bit=1 (False)
Figure 5 Example of marker detection (embedded amplitude=900, M=200, embedded bit=0) 2.
Detect the markers by applying Eq. (9) to the amplitude level A’’ = | XSS’’( b ) [k0]| .
3.
Estimate the marker degradation according to the result of the marker detection. An example of the calculation of the marker degradation is shown in Figure 5. In this figure, there are examples of true detection and false detection. In the case of true detection, both the current (A’’ =820) and previous (A’=900) amplitude can be derived, the marker degradation calculated and the value found to be 80. In the case of false detection, only the current amplitude (A’=1090) can be derived, so the previous position of the marker is estimated by the following procedure. When a false marker is detected, the previous amplitude is assumed to be at the center position of the nearest adjacent region. In this figure, the previous amplitude is determined to be 900 and the marker degradation will be 190.
4
Repeat the above procedure for all blocks in the frame and calculate the mean square value of Err(b)
σe = 2
∑ [Err ]
N b -1
( b)
2
/( N p N b )
(10)
b= 0
Estimate the PSNR by using the correlation between 2 σ e and PSNR.
In the next section, the correlation between σ e 2 and the PSNR is derived by computer simulations. This correlation does not depend on the kind of picture, bitrates, or the number of tandem connection stages. 4. COMPUTER SIMULATION EXPERIMENTS 4.1 Experimental conditions Computer simulations were conducted to derive relationship between marker degradation and PSNR.
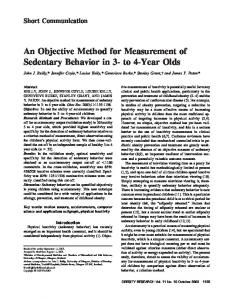
4.2 Relationship between marker degradation and PSNR Figure 6-8 shows the relationship between marker degradation 2 σ e and PSNR for each blocksize. In this figure, there are four different points for one kind of picture. Each point represents the result of four different bitrates, and the smaller the marker degradation the point has, the higher the bitrate at which the picture is coded. The vertical and horizontal axes represent the average value of marker degradation and PSNR in 30 frames. From this figure, it is proven that there is a strong correlation between marker degradation and the PSNR, and the regression curve can be derived with mean absolute error (MAE) 1.52dB in the case of a blocksize of 16x16. This regression curve expresses the approximation value of the PSNR derived from the marker degradation, and this can be used independently of the bitrates and kind of pictures. Therefore, once this regression curve is derived, the PSNR can be estimated only by calculating marker degradation. The relationship between blocksize and estimation accuracy is shown in Table 2. From this table, estimation accuracy can be improved by employing a smaller blocksize. This is considered to be because the number of blocks in the frame increases by reduction of blocksize and thus the second term in Eq.(5) that represents estimation error decreases. As for the degradation of the original pictures, the PSNR of the original picture after embedding the markers is over 49.5dB for all blocksizes, which is much smaller than the degradation caused by MPEG-2 coding. Thus, it can be said Table 1 Experimental conditions Test Sequences
where σ e 2 represents the degradation of the marker and the number of blocks in the frame, respectively. 5
2 TM5 codec with the bitrate 10,20,30,40Mbps and the PSNR of the decoded pictures was estimated. The number of frames in each test sequence was 30 and the parameters for MPEG-2 coding were N=15 and M =3. Three kinds of blocksizes that correspond to the major processing unit in MPEG-2 were examined and the marker intensity M was changed according to the blocksize.
Format Codec Bitrate Num. of stages of tandem conndection Blocksize Marker intensity
Table 1 shows the conditions of the experiment. In this experiment, six NTSC test sequences were coded by a MPEG-
3 stages 16x16, 16x8, 8x8 250 (16x16), 125 (16x8), 63 (8x8)
Table 2 Estimation accuracy and degradation of the original picture by blocksize Blocksize
the
Cheerleaders, Flamingoes, Green Leaves, Marching in, Mobile and Calendar, Soccer 704(H)x480(V), 4:2:2 , 30fps MPEG-2 Test Model 5 10,20,30,40 bps
16x16 16x8 8x8
Estimation accuracy [dB] Degradation of the MAE variance original pictures [dB] 1.52 3.41 49.59 1.21 2.21 49.56 1.02 1.67 49.50
45
40
40
PSNR [dB]
PSNR [dB]
45
35
Cheerleaders Flamingoes Green Leaves Marching in Mobile and Calendar Soccer
30
35 C heerleaders Flam ingoes G reen Leaves M arching in M obile and C alendar Soccer
30
25
25 0
20
40
60
marker signal degradation
80
0
20
e2
Figure 6 Relationship between σe2 and PSNR (Single codec connection, Blocksize: 16x16)
40
60
marker signal degradation
Figure 8 Relationship between connection, Blocksize: 8x8)
σe2
80 e2
and PSNR (Single codec
45 45
40
PSNR [dB]
PSNR [dB]
40
35
Cheerleaders Flamingoes Green Leaves Marching in Mobile and Calendar Soccer
30
35
1st stage 2nd stage 3rd stage
30
25 0
20
40
marker signal degradation
60
80 e2
Figure 7 Relationship between σe2 and PSNR (Single codec connection, Blocksize: 16x8)
25 0
20
40
60
marker signal degradation
80
100
e2
Figure 9 Relationship between σe2 and PSNR (Tandem codec connection, Blocksize: 8x8) that the degradation caused by the markers is quite small and is not perceivable by the human eye. 4.3 Estimation accuracy in the case of tandem connection Figure 9 shows the relationship between marker degradation and the PSNR of each link point of the tandem connection in the case of a blocksize of 8x8. This figure confirms that a common regression curve can be used for each stage in the tandem connection, and the regression curve can still be used independently of the kind of pictures and bitrates. 5. CONCLUSIONS A method for estimating the PSNR of coded pictures by use of embedded invisible markers without reference pictures is proposed. To estimate the PSNR of the decoded pictures, the proposed method directly detects the magnitude of degradation of marker signals which are embedded prior to compression coding. This method can be used regardless of the kind of pictures, bitrates or number of stages of tandem connections. Moreover, this method can be applied to video transmission that requires high quality, such as contributions and primary
distributions between broadcasting stations, since the degradation caused by marker embedding is negligibly small and not perceivable by human eye. REFERENCES [1] Recommendation ITU-R BT.500-8, “Methodology for the Subjective Assessment of Quality of Television Pictures”, 1998 [2] T.Hamada et al, “Picture Quality Assessment System by Three-Layered Bottom-Up Noise Weighting Considering Human Visual Perception”, SMPTE Journal, vol.108, No.1, Jan. 1999 [3] A.M.Rohaly et al, “Video Quality Experts Group: Current Results and Future Directions,” VCIP 2000, Jun. 2000 [4] O.Sugimoto et al, “Objective Measurement Scheme for Perceived Picture Quality Degradation Caused by MPEG Encoding without any Reference Pictures,” VCIP 2001, Proc. SPIE vol.4310-98, Jan. 2001