J Neurophysiol 112: 2332–2348, 2014. First published July 9, 2014; doi:10.1152/jn.00007.2014.
Innovative Methodology
Automatic parameter estimation of multicompartmental neuron models via minimization of trace error with control adjustment Ted Brookings, Marie L. Goeritz, and Eve Marder Volen Center and Department of Biology, Brandeis University, Waltham, Massachusetts Submitted 6 January 2014; accepted in final form 7 July 2014
Brookings T, Goeritz ML, Marder E. Automatic parameter estimation of multicompartmental neuron models via minimization of trace error with control adjustment. J Neurophysiol 112: 2332–2348, 2014. First published July 9, 2014; doi:10.1152/jn.00007.2014.—We describe a new technique to fit conductance-based neuron models to intracellular voltage traces from isolated biological neurons. The biological neurons are recorded in current-clamp with pink (1/f) noise injected to perturb the activity of the neuron. The new algorithm finds a set of parameters that allows a multicompartmental model neuron to match the recorded voltage trace. Attempting to match a recorded voltage trace directly has a well-known problem: mismatch in the timing of action potentials between biological and model neuron is inevitable and results in poor phenomenological match between the model and data. Our approach avoids this by applying a weak control adjustment to the model to promote alignment during the fitting procedure. This approach is closely related to the control theoretic concept of a Luenberger observer. We tested this approach on synthetic data and on data recorded from an anterior gastric receptor neuron from the stomatogastric ganglion of the crab Cancer borealis. To test the flexibility of this approach, the synthetic data were constructed with conductance models that were different from the ones used in the fitting model. For both synthetic and biological data, the resultant models had good spike-timing accuracy. conductance-based models; stomatogastric ganglion; genetic algorithms NEURON MODELS PROVIDE a theoretical sandbox for exploring and testing ideas about how neurons and networks function. Many problems in neuroscience benefit from studying models because it is easy to make controlled changes to their dynamics and to assess the consequences of these changes for neuronal or network performance. However, any such analysis is likely to depend on the starting model that is used. For this reason, considerable effort has been expended in developing neuron models that faithfully reproduce neuronal properties of interest. Simple phenomenological models of neuron activity are highly successful at predicting spike times and even voltage waveforms (Badel et al. 2008; Gerstner and Naud 2009; Jolivet et al. 2008a,b). Conductance-based models typically have many parameters that must be chosen appropriately. This makes their construction difficult; however, for some problems, construction of conductance-based models is still desirable because they address particular problems relevant to how real neurons depend on the number and distribution of their currents and synaptic inputs for their characteristic electrophysiological behavior.
Address for reprint requests and other correspondence: T. Brookings, MS 013 Brandeis Univ., PO Box 549110, Waltham, MA 02454-9110 (e-mail:
[email protected]). 2332
A variety of approaches have been developed to address the difficulties facing the construction of conductance-based models (Roth and Bahl 2009; Van Geit et al. 2008). One approach is to produce a database by creating a base model and altering the maximal conductances (Cummins et al. 2013; Marder and Taylor 2011) either randomly (Taylor et al. 2009) or on a grid (Prinz et al. 2003). Such databases can be generated relatively quickly, and then relationships between activity and parameter space can be investigated in depth afterward. Typically, analysis is constrained to neuron models that meet minimal standards of plausibility defined by comparisons with specific measurements made from biological systems (Taylor et al. 2009). Nonetheless, for some purposes, it is useful to create a single model for which activity closely mimics the behavior of a specific individual neuron of interest rather than neurons of a particular cell type. Such a model would seemingly be more likely to predict or recapitulate the response of a specific individual neuron to acute manipulations such as application of a neurotoxin or other blocking agent. For example, if one wished to carry out dynamic-clamp experiments to study the effects of varying a single parameter, it would be useful also to have a model of that same biological neuron. Moreover, if one wished to study the variability of individual neurons, it would be helpful to have a model for each example from which one could “read out” a variety of membrane parameters. To fit a model to an individual neuron, seemingly the simplest approach would be to minimize root-mean-square (RMS) voltage difference between a model and a target trace. Unfortunately, the highly sensitive nature of neuron dynamics causes minor disagreements between model and neuron to result in differences in spike times and thus large voltage differences. To address this issue, modelers typically try to fit multiple features of the voltage trace, such as spike rate, height, or width or bursting properties. More complex features can also be used. One can temporally align traces by spike time and compute RMS voltage difference in a narrow window about spikes (Weaver and Wearne 2008). Alternatively, one can attempt to match spike shape as visualized on a plot of membrane potential vs. its rate of change, a technique referred to as phase plane trajectory density method (LeMasson and Maex 2000; Van Geit et al. 2007). Modelers typically use multiple features because it is difficult to find any single feature that encapsulates all of the interesting aspects of a neuron model. Typically, features are weighted heuristically to emphasize the features of greatest interest and summed. This poses the problem of choosing how to weight the various features and requires refitting if the particular choice of weights was not fruitful. A more sophisticated approach is to use multiobjective optimization (Druck-
0022-3077/14 Copyright © 2014 the American Physiological Society
www.jn.org
Innovative Methodology ESTIMATING PARAMETERS IN NEURONAL MODELS
mann et al. 2007, 2008) where multiple features are simultaneously optimized and a model is only considered to be superior to another if it is superior in all features. This effectively allows the scientist to choose different weighting schemes after the fact and to investigate immediately the implicit tradeoffs. However, any feature-based method requires that the features of interest be well-defined, which places constraints on the current-clamp protocols that can be used to perturb target cells: one cannot meaningfully fit the interspike interval in recordings where the injected current is noisy enough to preclude regular spiking. Similarly, the phase plane trajectory (Van Geit et al. 2007) can be disturbed by injected noise, especially in a neuron with a spike initiation zone far from the source of current injection. Thus there is a tension between use of feature-based methods and the principle that the essential dynamics of a neuron (or model) is best probed with current injections that have wide dynamic range (Hobbs and Hooper 2008). Furthermore, it is difficult to choose and to weight a combination of features that fully encapsulate the activity of a neuron. When feature-based methods are inappropriate for a modeler’s goals, there are techniques that can be used to overcome the spike alignment problem and to fit a model directly to a single voltage trace. One approach is to assume that membrane potential is measured everywhere in the cell: either the cell is nearly isopotential and can be approximated by a model with one compartment (Haufler et al. 2007) or the recordings employed highly accurate voltage-sensitive dyes or some other technology (Bush et al. 2005; Huys et al. 2006). Then, instead of simulating the neuron model, one replays the recorded voltage and measures the error in the membrane potential equation that is induced by a given set of model parameters (i.e., the disagreement between the voltage derivative observed from the trace and the derivative demanded by the membrane potential equation). Minimizing the error in the membrane potential equation yields the best parameters to match the recorded voltage trace. Spike alignment is no longer a difficulty because the voltage trace is replayed into the neuron model rather than generated by it. This approach solves the spike alignment problem and has the additional feature of being linear in the maximal conductances, allowing for very fast solution (assuming the channel dynamics are known). There are no limits on the injected current waveform because no features are being extracted. Any model with zero error will be perfect, and presumably minimizing model error will produce a model that is very good. Unfortunately, it is currently impractical to obtain accurate neuron membrane potential everywhere at high precision, and neuroscientists are frequently interested in cells that are not isopotential. In this study, we use a Luenberger observer (Abarbanel 2009; Abarbanel et al. 2009), a control theoretic technique designed to estimate the hidden state variables of a system or to synchronize and to compare systems with different dynamics. Conceptually, we apply a control adjustment to force a candidate model to align nearly with a target trace. By minimizing RMS error in the presence of this control adjustment, we obtain the final parameters of the model. To generate the target trace, we perturb the target neuron in current-clamp with pink (1/f) noise injections. Here, we describe in detail the steps
2333
necessary to implement this approach practically. We then test the effectiveness with synthetic data as well as data recorded from a neuron from the stomatogastric ganglion (STG) of the crab Cancer borealis. MATERIALS AND METHODS
Source code implementing the algorithms described here is hosted at http://www.bio.brandeis.edu/MarderLabCode/Brookings_et_ al_2014/. Neuron model simulation. We wrote custom software in C⫹⫹ to simulate multicompartmental neuron models. Computing control adjustment. Let Fj represent the method of iterating the solution of the membrane equation for the voltage Vj in compartment j from one time step to the next, i.e.: V j共tn⫹1兲 ⫽ F j关V共tn兲兴 . →
If there is a target trace j,n that describes the voltage in compartment j at time tn, then we apply a control adjustment to this voltage as: V j共tn⫹1兲 ⫽ F j关V共tn兲兴 ⫹ k兵 j,n⫹1 ⫺ F j关V共tn兲兴其 →
→
where the “control factor” k defines the strength of the control. If there is no target trace for compartment j (e.g., the voltage could not be experimentally measured there), the voltage is not adjusted. To maintain the control factor across time steps of potentially different sizes appropriately, we chose to express it in terms of a control time c as:
冉 冊
k ⫽ 1.0 ⫺ exp ⫺
⌬t
c
.
Computing model error. To compute model error, the model is simulated with control adjustment applied. For each target trace j,n, the error associated with that trace is the RMS difference between the target trace and the simulated voltage:
⑀j ⫽
兹兺 n[V 共t 兲 ⫺ j
n
j,n]
2
.
The model error is the sum of all of the trace errors (there is typically only 1 observed trace). Fitting dynamics of ion-channel models. We used ion-channel conductance models that corresponded to electrophysiological recordings from cultured STG cells (Turrigiano et al. 1995). These models were delayed-rectifier potassium (Kd), fast A-type potassium (Af), slow A-type potassium (As), calcium-activated potassium (KCa), hyperpolarization-activated mixed cation (h), inactivating calcium (CaT), noninactivating calcium (CaS), fast sodium (Na), and persistent sodium (Nap). Additionally, we used a model of modulatory inward current (MI) based on data for a proctolin-activated current in the STG (Golowasch et al. 1992) and a model of a calcium-activated nonspecific current (CAN) measured in the STG (Zhang et al. 1995). Finally, in some models, we used currents obtained from axons in the leg of crustaceans (Connor et al. 1977). These provided alternative models of fast sodium (NaCS), delayed-rectifier potassium (KdCS), and A-type potassium (ACS). The formulas describing the kinetics of these channels are listed in the APPENDIX. Unfortunately, the kinetics in those papers may not be appropriate for modeling a given STG cell for a variety of reasons: the relative abundance of different channel subtypes or subunit composition may vary from one cell to the next, phosphorylation state may change over time, error or uncertainty in measurements such as clamp error, poor fit to measured currents by the chosen functional form, etc. We addressed this problem by introducing dimensionless “fudgefactor” parameters that altered the dynamics of conductance models. The parameters we introduced were vshift, vscale, and scale, which shifted the voltage response of the gate, scaled the slope of the gating
J Neurophysiol • doi:10.1152/jn.00007.2014 • www.jn.org
Innovative Methodology 2334
ESTIMATING PARAMETERS IN NEURONAL MODELS
curve, and altered the time scale that a gate took to approach its steady-state value. For example, the hyperpolarization-activated current with altered dynamics was specified by:
冋
冉 再 冉
m⬁ ⫽ 1 ⫹ exp ⫺
v ⫹ vshift ⫹ 78.3 mV 8.7 mV ⴱ vscale
m ⫽ scale ⴱ 272 ms ⫹ 1,499 ms
冋
ⴱ 1 ⫹ exp ⫺
v ⫹ vshift ⫹ 42.2 mV 8.73 mV ⴱ vscale
冊册
⫺1
冊册 冎
,
⫺1
.
To minimize the number of extra parameters, for most conductance models, activation gates and inactivation gates were modified by the same shift and scale parameters. However, due to the critical importance of the channels that govern spiking, the Connor-Stevens (Connor et al. 1977) conductance models had separate activation and inactivation fudge factors (i.e., mvshift, mvscale, mscale, hvshift, hvscale, and hscale). For a table of conductance model formulas, see APPENDIX. Genetic algorithm. We optimized the error function using a genetic algorithm because of the ease with which they can take advantage of a parallel computing environment such as a cluster. We used a simple variant of the differential evolution algorithm (Storn and Price 1997). We describe the algorithm in detail below, but the concise details of our variant were: the crossover constant CR ⫽ 1.0, and the weighting factor F was selected randomly uniformly from (0,2). We also detected parameters that must always maintain sign and treated them as though the evolutionary algorithm were acting on their natural logarithm rather than the parameters directly. These alterations were made to accommodate the unique challenges of fitting neurons such as many highly interacting parameters that may exist at different orders of magnitude. Free parameters were assigned a maximum allowable range (the fitting algorithm would not test values outside of this range) as well as an initial range (the initial population would be randomly generated with parameters inside of this range). Free parameters were divided into two classes: those parameters for which allowable range was entirely positive or entirely negative were called “logarithmic”; otherwise, they were linear. Linear parameters were assigned random initial values uniformly throughout their initial range (typically smaller than their maximum allowed range), whereas logarithmic parameters were uniform in their logs. This division allowed parameters that ranged over several orders of magnitude (e.g., maximal conductances) to converge quickly to their correct magnitude. After the population of random parameter sets was randomly generated, the whole population was evaluated. Then, the population was sorted in order of increasing error, and thereafter new parameter sets were generated via differential crossover. In differential crossover, new “progeny” parameter sets are constructed from three parents. For each progeny, three parents 共pជ,p 1 ជ,p 2 ជ兲 3 were drawn randomly, uniformly from the population. If the error of p2 was greater than the error of ជ, ជ p3 they were swapped to guarantee that ជ p2 had superior fitness. A single uniform random number R was drawn from the open interval (0,2) for each progeny. Then, the progeny parameters cជ ⫽ (c1, c2, ..., cn) were assigned: ck ⫽ p1,k ⫹ 共p2,k ⫺ p3,k兲 ⴱ R for linear parameters, or ck ⫽ p1,k ⫹ 共p2,k ⁄ p3,k兲R
for logarithmic parameters.
The progeny parameter set was then evaluated and inserted into the population to maintain the ordering by increasing error. To maintain population size, the worst member of the population was subsequently removed (consequently, the newly evaluated progeny would be removed if its error was greater than any in the preexisting population). In a parallel computing environment, the evaluation of each parameter set was handed off to a worker process via the Message Passing Interface (MPI) protocol, whereas the master process created more
progeny for testing. After the worker process completed evaluating the error of the parameter set, the progeny was inserted into the population by the master process. In this way, in a cluster with N central processing units (CPUs), N ⫺ 1 could be used to evaluate parameter sets, whereas one CPU would run the genetic algorithm. After the first generation, the completion of each subsequent generation was (arbitrarily) demarcated by the moment when the number of crossover progeny that had been evaluated was equal to the population size. At this point, the population was tested for convergence. If the diversity in parameter values and the diversity in error values were both small enough, the fit was complete and the best-fit parameters corresponded to the parameter set in the final population with the lowest error. Otherwise, the fit progress was saved to disk and the fit continued. Computing environment. We ran the genetic algorithm on a Rocks 5.1 cluster using 64-bit Linux using 7 nodes with a total of 72 CPUs. Interprocess communication was handled with Open MPI 1.6.2. One CPU ran a master process implementing the genetic algorithm, and the remaining 71 CPUs ran worker processes that simulated neuron models and computed error values. Electrophysiology. Adult male crabs (C. borealis) were obtained from Commercial Lobster and maintained in artificial sea water at 11°C. Crabs were anesthetized by being placed in ice for 30 min. The stomatogastric nervous system (STNS) was dissected from the crab and pinned to a Sylgard (Dow Corning)-coated dish in 10 –12°C saline (Gutierrez and Grashow 2009). Saline consisted of the following (in mM): 440 NaCl, 11 mM KCl, 26 MgCl2, 13 CaCl2, 11.2 Trizma base, and 5 maleic acid, pH 7.45. The STG was desheathed, and the anterior gastric receptor (AGR) neuron (Combes et al. 1993; Daur et al. 2012; Larimer and Kennedy 1966; Smarandache and Stein 2007) was identified based on its shape and position in the STNS (Combes et al. 1995). Dual intracellular recordings from the AGR soma were obtained with two 12- to 30-M⍀ glass microelectrodes filled with 0.6 M KSO4 and 20 mM KCl amplified with 1⫻ HS headstages and Axoclamp 2A and 2B amplifiers (Molecular Devices) in currentclamp mode. Data were acquired with a Digidata 1440A data acquisition board (Molecular Devices) using Clampex 10.2.0.12. Action potential-mediated descending neuromodulatory input was blocked using a petroleum jelly well-placed on the desheathed stomatogastric nerve (STN) and filled with 10⫺6 M TTX (Sigma) and 750 mM sucrose. After 40 min of blocking, we used two-electrode currentclamp (TECC) to record cellular responses to injected current waveforms. Current waveforms were generated in Python scripts, saved in .atf files, and played in Clampex 10.2.0.12. We used dye fills to trace the AGR axon and its projections in the STG as previously described (Goeritz et al. 2013). Synthetic data. We generated synthetic data to serve as a known target by hand-tuning models to exhibit subjectively interesting and realistic activity. Specifically, we created an intrinsically bursting model neuron with distal spike initiation, resulting in spikes with diminished amplitude. This model neuron was perturbed with current injected into the proximal (somatic) compartment using the same current waveform as the biological neurons. Likewise, the somatic voltage was recorded to serve as the target waveform. The initial target model was constructed using the Connor-Stevens equations for conductances (Connor et al. 1977), however, we fit models to these data using model conductances corresponding to those described in Turrigiano et al. (1995). To determine the optimal population size for the genetic algorithm, we executed many fits, which consumed a great deal of computing time. To minimize wasted time and resources, we created a simplified synthetic model with only 2 compartments (and likewise fit it with 2 compartments). This model was based on the original synthetic data model and required minimal tweaking to provide interesting activity.
J Neurophysiol • doi:10.1152/jn.00007.2014 • www.jn.org
Innovative Methodology ESTIMATING PARAMETERS IN NEURONAL MODELS RESULTS
Demonstrating control adjustment in a simple dynamic system. To demonstrate the procedure and effect of control adjustment, we simulated a simple harmonic oscillator given by the equation:
冉冊
d y dt v
⫽ 2 f
冉
0
⫺1
1
0
冊冉 冊 y
v
,
where f is the frequency of the oscillator, y is the position, and v is the velocity. The initial position and velocity were chosen y(0) ⫽ 1 and v(0) ⫽ 0. We chose an oscillator with f ⫽ 1 as a target and recorded its position (but not its velocity) for use as a target trace. Thus, for this simple system, position was an
A
Nearly Correct Frequencies Misalign 1.0
2335
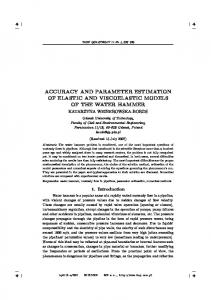
observed state that we tried to fit, whereas velocity was a hidden state that was unconstrained. We considered the problem of attempting to recover f by minimizing trace error. Figure 1A shows the target trace plotted alongside a candidate oscillator for which the frequency was 1.1 (arbitrary units). Despite disagreeing in frequency by only 10%, the candidate model became completely out of phase with the target after only five cycles. Figure 1B depicts a short time window to show how control adjustment can be applied to the candidate oscillator. At the leftmost time point, there was a sample of the target trace to compare with, so the controlled candidate oscillator had its position adjusted a fixed fraction of the way toward that value (velocity was unchanged). Afterward, the differential equation was simulated normally until there was another target value to compare with. The differen-
B
Process of Control Adjustments
1.00
target candidate
0.95
0.5
0.0
y
y
0.90 0.85 0.80 target controlled working values
0.75 0.70 1
0
C
2
Time
3
4
5
0.90
D
Control Promotes Alignment 1.0 target candidate controlled
0.5
Time
1.00
Error With and Without Control 1.0 0.9
y
y
0.8 0.0
0.7 0.6
target uncontrolled controlled
0.5 0
RMS Error
E
1.0 0.8 0.6 0.4 0.2 0.0
1
2
Time
3
4
5
0.90
Error vs Frequency
Time
1.00
uncontrolled controlled
0.5
1.0
2.0
Candidate Frequency Fig. 1. Calculation and effect of control adjustment. A: a simple harmonic oscillator with frequency f ⫽ 1.0 is used to generate a target trace. The position is recorded (red triangles), but the velocity is not. A different oscillator with f ⫽ 1.1 (blue diamonds) is compared with the target. B: a closeup view illustrates the process of control adjustment. A candidate oscillator is updated normally according to its differential equation (gray circles) until a time point when the candidate value can be compared with the target value. Then, the controlled value (green circle) is produced by moving the oscillator position a fixed fraction of the way toward the target value (velocity is not affected as there is no recorded velocity information). The controlled value is saved, and previous working values are discarded. Further iteration of the differential equation continues from the controlled value. C: the target trace (red triangles), uncontrolled candidate with f ⫽ 1.1 (blue diamonds), and controlled candidate with f ⫽ 1.1 (green circles) are compared. The controlled candidate is nearly aligned with the target. D: a closeup illustrates the process of computing model error. After simulating an oscillator (either with or without control adjustment), the instantaneous error can be computed by finding the difference between the candidate trace and the target trace. An overall error can be assigned to a model by computing the root-mean-square (RMS) error. E: a population of candidate oscillators is considered with a frequency range of f ⫽ 0.5–2.0. Each oscillator is simulated with control adjustment (green circles) and without control (blue diamonds), and its RMS error is plotted vs. frequency. The RMS error of the controlled oscillators is smooth and has only 1 minimum (at the correct frequency), whereas the RMS error of the uncontrolled oscillators has many local minima, making discovery of optimal f difficult for a minimization algorithm. J Neurophysiol • doi:10.1152/jn.00007.2014 • www.jn.org
Innovative Methodology 2336
ESTIMATING PARAMETERS IN NEURONAL MODELS
tial equation solver took several small steps until it reached another time point for which there was target data (these working values are only used to advance the solution in time and are not saved). Each time a comparison was possible, the position of the candidate oscillator was moved closer to the target position. Figure 1C shows the result of this process over the whole time course. The controlled candidate oscillator stayed nearly synchronized with the target oscillator even after the uncontrolled candidate oscillator became completely out of phase. Figure 1D depicts the calculation of model error. After the controlled and uncontrolled candidate traces were simulated, their error was calculated by comparing the difference between their position and the target position. An overall error could be assigned to the trace by computing the mean square value of these trace errors. Figure 1E plots mean square error vs. frequency for a population of oscillators with frequency ranging from 1/2 to 2. The controlled oscillators have lower RMS error than the uncontrolled oscillators, but more importantly the error landscape is smooth and parabolic for the controlled oscillators, whereas it is nearly flat with many local minima for the uncontrolled oscillators. Thus applying control adjustments renders the system more amenable to fitting by reducing the prevalence and depth of local minima. Demonstrating control adjustment on a multicompartmental neuron model. When assessing a procedure to fit neuron models to data, there are several obvious questions to ask. Probably the simplest is, “if a known model is used to simulate a neuron trace, can the fitting procedure recover the original parameters?” To assess the answer to this question, we hand-tuned a three-compartment model neuron to produce complex behavior. In the absence of current injections, the model exhibited bursting and spiking, with a spike initiation zone distal from the soma that resulted in somewhat diminished spike amplitude. This model neuron
was then simulated with pink noise current injected into the soma, and the somatic membrane potential was recorded. The voltage trace generated by this process was used as a target in a fit. The parameters of this model are listed in the APPENDIX. The purpose of injecting the pink noise current was to distinguish between degenerate parameter sets that produce similar unperturbed activity patterns. The pink noise pushes the membrane potential of the neuron across many voltage regions and perturbs the cell at many frequencies (Hobbs and Hooper 2008). This will differentially activate the underlying conductances since they each have unique voltage and time dependencies. Pink noise was chosen over white noise because the excess of low-frequency components causes occasional large changes in voltage, whereas the high-frequency components that are more predominant in white noise are strongly damped by the capacitance of the neuron. Before fitting, we needed to choose how aggressive to make the control scheme. We represent the amount of control by a relaxation time c. Specifically, for a trace with sample interval ⌬t . That ensures that ⌬t, the control factor k ⫽ 1.0 ⫺ exp ⫺ c k is chosen appropriately regardless of how frequently a trace is sampled but leaves open the question of choosing c. If c is too large (very weak control), then spikes misalign and the fitness landscape becomes very irregular. However, if c is too small (very strong control), then slowly changing currents become underconstrained. We found that setting c to roughly twice the duration of the action potentials of the target trace was a good compromise, although we altered it as necessary to achieve good fits. In Fig. 2, we depict the application of control adjustment to two potential models. The target trace was produced by the
冉 冊
_ Reduced gNa
candidate model target
candidate model target
vSoma (mV)
vSoma (mV)
No Control Current
0.7
0.8
0.9
0.7
Time (s)
0.8
0.9
Time (s) candidate model target
candidate model target
vSoma (mV)
Control Current Applied vSoma (mV)
Fig. 2. Application of control adjustment promotes alignment of nearly correct models. In each panel, a bursting target model is used to generate synthetic data (blue), and a candidate fit model is compared with it. In the left column, the candidate is identical to the target model except maximal sodium conductance g Na is slightly reduced from 30 to 29 S/nF (red). In the right column, the candidate model is produced by minimizing RMS voltage difference and has most of its maximal conductances changed (black). In the top row, the simulations are carried out with no control adjustment. In this case, the model with reduced sodium conductance has an RMS error of 4.0 mV, whereas the error of the minimal RMS model is 2.8 mV. In the bottom row, the simulations are carried out with control adjustment applied (with a time constant of 5 ms). With control adjustment applied, the reduced sodium conductance model has an RMS error of 2.4 mV, whereas the error of the minimal RMS model is 2.7 mV. vSoma, voltage of the soma.
Minimal RMS Error
0.7
0.8
0.9
Time (s) J Neurophysiol • doi:10.1152/jn.00007.2014 • www.jn.org
0.7
0.8
Time (s)
0.9
Innovative Methodology ESTIMATING PARAMETERS IN NEURONAL MODELS
aforementioned hand-tuned bursting neuron. On the left column, the candidate model was hand-chosen to be nearly correct (maximal sodium conductance g Na was reduced from its initial value of 30 down to 29 S/nF, but the model was otherwise unchanged). In the right column, the candidate model was drastically changed; in fact, it was obtained by minimizing RMS error without applying control adjustments (the parameters for these models are listed in APPENDIX). With the parameters of the two models fixed, we show traces from both of these neuron models simulated without control adjustment applied (top) and with control (bottom). Without control, the spikes in the nearly correct model do not align, and it scores worse than the clearly terrible model. Applying control adjustment to both models causes the nearly correct model to align with its target, giving it a superior score (lower error) compared with the nonspiking model. Fitting a model to synthetic data that it can exactly reproduce. The neuron model being fit to the synthetic data was identical to the hand-tuned target model except that its parameters were treated as unknown quantities to be determined by the fitting algorithm. The initial ranges of the population of the genetic algorithm were between 0.2 and 5.0 times
Injected Current (nA)
A
the true values for maximal conductances; the allowed ranges (beyond which the genetic algorithm could not vary parameters) were 0.01 and 100 times the true value for each of those parameters. For reversal potentials, the initial range was offset from the true value by ⫾20 mV, and the allowed range was constrained to be between ⫺80 and ⫹55 mV. For the initial value of conductance gates, initial and allowed range was from 0 to 1. The fit was executed on a subset of the cluster with 24 CPUs and finished after 5,401 generations of the genetic algorithm in 58.7 h. Figure 3 shows that the fitting procedure produced a model that accurately reproduced the original target trace. Figure 3A shows a 4-s simulation of the target voltage trace and the voltage trace of the best-fit model. Only the 1st 2 s were fit (with c ⫽ 1.0 ms), whereas the remaining time shows an extrapolation of the activity of the best-fit model. The models were obtained by fitting with control adjustment, then the best-fit model was simulated with no control adjustment. Figure 3B shows a zoom of the traces, revealing that the best-fit model has the correct spike timing and shape. To assess the accuracy of the fit parameters, we defined the parameter error as:
Perturbing Pink Noise Current
1.5 1.0 0.5 0.0
0.0
0.5
1.5
1.0
2.0
2.5
3.0
3.5
4.0
3.0
3.5
4.0
Time (s) Fit to Synthetic Data (With Exact Kinetics)
0 Fit Target Model
Soma Voltage (mV)
B
2337
0.0
0.5
1.5
1.0
2.0
2.5
Time (s)
h ACS
m ACS
h NaCS
m KdCS
m NaCS
vScale ACS
tauScale ACS
hVShift ACS
mVShift ACS
tauScale KdCS
1.18
vShift KdCS
1.16
vScale KdCS
1.14
Time (s)
vScale NaCS
1.12
tauScale NaCS
1.10
hVShift NaCS
12 10 8 6 4 2 0 E Leak _ g Leak _ g NaCS _ g KdCS _ g ACS
Soma Voltage (mV)
Fit Target Model
D14x 10
mVShift NaCS
Exact Kinetics
Parameter Error
C
J Neurophysiol • doi:10.1152/jn.00007.2014 • www.jn.org
Fig. 3. When fitting synthetic data using control adjustment, the activity and parameters of a target model are recovered correctly. A target model is used to generate synthetic membrane potential trace (blue) with pink noise (1/f) current injected into the soma. The target model uses Connor-Stevens (CS) conductance models for fast sodium, delayed rectifier potassium, and A-type potassium conductances. The 1st 2 s of these data are fit (using applied control adjustment with control time c ⫽ 1.0) with a model that uses the same conductances. After the best-fit model was obtained, it was simulated without control adjustment applied. A and B: both the target and best-fit models were simulated for 4 s. C: a zoomed view shows spike timing and spike shape. D: a bar graph shows parameter errors for each parameter that was fit. E, reversal potential of the channel model; m, activation state variable; h, inactivation state variable; v, membrane voltage.
Innovative Methodology 2338
ESTIMATING PARAMETERS IN NEURONAL MODELS
⑀共 pfit兲 ⫽
ⱍp
ⱍ . max共1.0, ⱍ p ⱍ 兲 true
⫺ pfit
Stevens conductances for its axonal currents, we attempted to fit its trace with sodium and potassium conductances as described in Turrigiano et al. (1995). As shown in Fig. 4A, the naïve attempt to drop in the new conductance models and fit as we did before did not work. Simply scaling up or down the maximal conductances cannot accommodate the large underlying differences in the conductance models. To counter this problem, we introduced fudge factors into the axonal conductance models to fit the differences in conductance dynamics (see MATERIALS AND METHODS). These fudge factors allowed the fitting algorithm to match crudely the original axonal conductance dynamics without matching them exactly. To illustrate, consider the steady-state activation of A-type potassium conductance. The original model used to produce the target trace had:
true
For parameters with absolute value ⬎1, this measures fractional error; otherwise, it measures absolute error. Figure 3C depicts the parameter error for each of the parameters being fit. The largest parameter error was 0.015. Thus the original activity and parameters were recovered. Fitting a model to synthetic data it cannot exactly reproduce. Unfortunately, it is much easier to recover the parameters of a model that lies exactly within the parameter search space than it is to fit real data (Druckmann et al. 2008). This is because the equations used to model bulk ionic conductance are never a perfect match to the actual behavior of ion channels. Before fitting traces recorded in real neurons, we took the intermediate step of fitting a known model but with conductance models that were altered so that no combination of parameters could possibly recover the exact original model. The target trace was the same synthetic data generated previously. However, whereas the original model used Connor-
A
m⬁ ⫽
冤
0.0761 1.0 ⫹ exp
冉
v ⫹ 1.17 mV 28.93 mV
冊
exp
冉
v ⫹ 94.22 mV 31.84 mV
冊冥
1⁄3
,
Fit to Synthetic Data (Not Fitting Kinetics) 0
Soma Voltage (mV)
−10
Fit Target Model
−20 −30 −40 −50 −60 0.0
0.5
1.5
1.0
2.0
2.5
3.0
3.5
4.0
3.0
3.5
4.0
Time (s)
B
Fit to Synthetic Data (Fitting Kinetics) 0
Soma Voltage (mV)
−10
Fit Target Model
−20 −30 −40 −50 −60 0.0
0.5
1.5
1.0
2.0
2.5
Time (s) Fitting Kinetics
Fitting Kinetics
D−15
Fit Target Model
Soma Voltage (mV)
C−10 Soma Voltage (mV)
Fig. 4. When fitting synthetic data, applying control adjustment yields models with accurate spike times and shapes even when incorrect conductance models are used. A target model is used to generate a synthetic membrane potential trace (blue) with pink noise (1/f) current injected into the soma. The target model uses Connor-Stevens conductance models for fast sodium, delayed rectifier potassium, and A-type potassium conductances. The 1st 2 s of these data are fit (using applied control adjustment) with a model that uses Turrigiano conductance models instead of Connor-Stevens. The best-fit model is then simulated without control adjustment (red). A: when kinetic fudge factors are not fit, the best-fit model does not produce action potentials. B: in addition to maximal conductances, kinetic fudge factors of the conductance models were also fit. The general pattern of activity was recovered. C: a zoomed view shows that spike timing is nearly correct. D: a further closeup shows that spike shape is approximately correct as well.
−20 −30 −40
Fit Target Model
−20 −25 −30
−50 −35 −60
0.7
0.8
0.9
1.0
1.1
1.2
1.3
Time (s) J Neurophysiol • doi:10.1152/jn.00007.2014 • www.jn.org
1.10
1.12
1.14
1.16
Time (s)
1.18
Innovative Methodology ESTIMATING PARAMETERS IN NEURONAL MODELS
whereas the A-type potassium of the fitting model had: m⬁ ⫽
冉
1 ⫹ exp ⫺
1 v ⫹ vshift ⫹ 27.2 mV 8.7 mV ⴱ vscale
冊
.
The different forms of the equations ensure that no combination of vshift and vscale could recover the original voltage dependence of the activation curve. However, as seen in Fig. 4B, adding in and fitting the fudge factors is enough to produce a model with approximately correct activity. Both fits were carried out with c ⫽ 2.5 ms. The fit with fudge factors was executed on all 72 CPUs and terminated on generation 5,403 after 9.1 h. Closeups in Fig. 4, C and D, show that the best-fit model has accurate spike times and shapes. Thus the crude fitting of dynamics provided by fudge factors enables the fitting procedure to overcome inaccuracies in the modeling of conductance dynamics (at least sometimes). Determining the optimal population size for the genetic algorithm. The genetic algorithm depends on an important undetermined quantity: the size of the population. If the population is too small, the algorithm may get stuck in a local minimum or long, flat valley; if the population is too large, the algorithm will proceed more slowly than necessary. However, determining what is too small or too large is difficult. Optimal population size depends on the number of parameters as well as the complexity and shape of the fitness landscape. For synthetic data with a small number of free parameters, it is possible to guess and to check to obtain fits. However, fits to real data require large numbers of free parameters and present the real possibility that the parameterized model is a bad one that can never fit well. Therefore, before starting fits to real data, it is desirable to have an empirically determined estimate of the optimal population size. With this in place, a few attempts should be enough to yield a good fit or demonstrate that the would-be model is flawed. We wrote a script to fit models repeatedly to a synthetic target trace, varying the number of unknown parameters and the population size. To derive estimates of population size for realistic, difficult problems, we created a discrepancy in the conductance models between the model generating the synthetic target trace and the model used to fit it. As before, the synthetic data were generated using Connor-Stevens conductance models (Connor et al. 1977) for gNa, gK, and gA, whereas the fitting model used conductance models from Turrigiano et al. (1995). We expected this repeated fitting to be taxing of computer resources and time and therefore generated a simplified two-compartment model that was similar to our previous model (bursting, distal spiking with diminished amplitude). One second of model time could be simulated in ⬃0.13 s, allowing the overall script to complete in a timely manner. Independently of the script, we performed this fit and found a model that qualitatively matched its target activity. This fit had an error of just over 0.65, so we considered a successful fit to be one with an error of ⬍0.67. Within the script, parameters were divided into two types: fundamental parameters of the model (such as maximal conductances) and initial state parameters (such as initial voltage or initial value of the activation gate of gNa). The script independently varied the number of fundamental parameters being fit, the number of initial state parameters, and the
2339
population size. Parameters that were not fit were set to the same values that resulted from our manual fit. Those that were fit were varied around the fit values, as described previously. Each combination of unknown parameters and population size was tested multiple times. The results of a fit were deemed unacceptable if the model error was ⬎0.67. We then attempted to minimize the number of model simulations necessary to obtain an acceptable solution (keeping in mind that we would need to start over and simulate more models if an unacceptable solution is reached). Finally, we fit a simple functional form to the output of this script, arriving at: Npopulation ⬇ 共1.2 ⴱ nfundamental ⫹ 0.857 ⴱ nstate兲2.17 , where Npopulation was the optimal population size, nfundamental was the number of fundamental parameters, and nstate was the number of initial state parameters. The RMS fractional error of this fit was 0.12. The number of function evaluations was approximately (4.95 * nfundamental ⫹ 6.35 * nstate)2.84, with an RMS error of 0.25. It is worth noting that the largest number of parameters our script attempted to fit was 8, and therefore these results represent a considerable extrapolation. Fitting a model to data recorded intracellularly from a biological neuron. To obtain target data from a biological neuron, we pharmacologically isolated an AGR neuron, a sensory neuron in the STG. In TECC, we injected pink noise into the soma and recorded the somatic membrane potential. We extracted 10 s from this recording and fit the 1st 5.5 s (with c ⫽ 10 ms), reserving 4.5 s to be compared with an extrapolation of the model. As Fig. 5D shows, AGR has a simple morphology, which makes it ideal for this study. We approximated the morphology of AGR with five connected cylinders: anterior neurite (AN), soma, posterior neurite (PN), branch, and axon. The AN, soma, PN, and branch compartments were considered “passive.” All compartments were populated with model conductances for leak, Kd, As, Af, and Nap. Additionally, the soma had MI conductance and the calcium-related channels KCa, CaS, CaT, and CAN and tracked the concentration of intracellular calcium. The axon compartment additionally contained h (Ballo and Bucher 2009; Ballo et al. 2010) and Na conductances. We executed this fit on all 72 CPUs and manually terminated it on generation 10,289 after 1,252.7 h (due to apparent lack of progress in the fit). Figure 5, A–C, shows the results of this fit. From the response of the model to transient changes in current injection, the impedance and capacitance of the model appear to be well-fit. During the time interval being fit, the biological data had 44 spikes; from these, the model is missing 2 spikes and has 3 extra spikes for a spike match rate of 89%. When extended to the full 10-s duration, there were 73 spikes in the biological data, of which 67 were matched (with 10 extra spikes), dropping the match rate to 81%. The spike times of the model were approximately correct. In the 67 matching pairs of spikes, 71% of the model spike times are within ⫾2 ms of the correct time. The AGR neuron had a spike width of 2.77 ⫾ 0.05 ms, and the spike widths of the model are approximately correct, being on average 3.1% wider. However, the model spike heights are substantially reduced. The AGR neuron had a spike height of 53 ⫾ 1 mV, but the model spike heights were on average 22% smaller. Visualizing the fitness landscape. The error function we used has the dual advantages of being relatively quick to calculate
J Neurophysiol • doi:10.1152/jn.00007.2014 • www.jn.org
Innovative Methodology 2340
ESTIMATING PARAMETERS IN NEURONAL MODELS
Fitting AGR 803-121
0
Fit AGR 803-121
0
B
2
4
0
Fit AGR 803-121
1.0
1.5
2.0
Time (s)
and of producing a relatively smooth fitness landscape. This makes it suitable for visualization of the landscape of model fitness. We wrote a program to alter a base neuron model by systematically varying two parameters independently in a grid and computing the errors of these altered models. This process produces a grid of error values that can then be visualized on a three-dimensional plot. Figure 6 shows the results of this process applied to synthetic data. The base model was chosen to be the best-fit to the synthetic data with mismatched conductance models (note that for visual clarity, we have inverted the error so that lower error is up). The most notable feature is a central peak, reaffirming that the base model is optimal. However, there are substantial regions on the plots where a change in one conductance results in a considerable decrease in quality, but a compensating change in others can partially rescue it. DISCUSSION
There are many occasions on which it would be advantageous to have a model that replicates well the behavior of a specific example of a biological neuron. The eventual gold standard would be to be able to create such a model in real-time so that an experimentalist could make measurements of the activity of a neuron and, with some knowledge of the properties of the currents it is likely to express, rapidly create an appropriate model. Simulation time (and thus fitting time) grows with increasing complexity of a multicompartmental model (e.g., number of compartments, number of conductances). The population size (and thus fitting time) of the genetic algorithm grows roughly quadratically with the number of parameters to be fit. We elected to show results from the best fit (which took months and had many parameters), however, shorter fits (on the order of 1–2 wk) achieved fits of only slightly lesser quality. Computing the error associated with a given set of parameters is an intensive process that does not lend itself to producing a gradient (change in error with respect to parameter changes). This constrains the kind of minimization algorithm
2.5
3.0
6
Time (s)
C
Fitting AGR 803-121 10
Soma Voltage (mV)
Soma Voltage (mV)
Fig. 5. When fitting biological data, applying control adjustment yields models with accurate spike times. A pharmacologically isolated anterior gastric receptor neuron (AGR 803-121) was recorded in 2-electrode current-clamp. A: pink noise current was injected into the soma, and the resultant membrane potential was recorded (blue). The 1st 6 s of these data were fit with control adjustment applied, and the resulting model was simulated without control adjustment (red). The model shows good agreement with biological data, extending into the region where the data were not fit (5.5–10 s). B: zoomed view shows that spike timing is approximately correct with occasional missed spikes or extra spikes. C: close zoom shows that model spike width is approximately correct, whereas spike height is diminished. D: maximal projection of confocal image of the AGR neuron that was recorded from. Soma length, 64 m.
Soma Voltage (mV)
A 20
8
Fitting AGR 803-121
10
D
10 0
1.820
Fit AGR 803-121
1.822
1.824
Time (s)
1.826
1.828
that can be used to find the optimal set of parameters. Fortunately, the plots in Fig. 6 indicate that the fitness landscape is fairly smooth. Development of derivative-free minimization algorithms is an active field of inquiry, with many extant algorithms, each with different strengths and weaknesses (Rios and Sahinidis 2013). Dramatic improvements in performance are likely to be realized by systematically testing leading current-generation algorithms by fitting neuron models with many parameters. Thus we expect substantial improvements in speed and fit quality as computer hardware becomes faster and as these new minimization algorithms are implemented. The results of the present work demonstrate that it is possible to fit realistic conductance-based models to intracellular voltage traces. These models can reproduce accurate spike times, subthreshold deflections, and some aspects of spike shape. Accuracy in these features is highly desirable when studying compensation or homeostasis, as the details of homeostatic mechanisms will depend on the baseline model. Accurate conductance-based models can also provide a useful means of checking whether existing detailed knowledge about a neuron type is enough to explain its response to a biological perturbation (e.g., change in activity in response to application of a neuromodulator). It is also possible that a database of models individually fit to different biological neurons would yield homeostasis-related correlations in the maximal conductances of different channel types (O’Leary et al. 2013) unlike databases of randomly sampled models selected to match the activity of a given cell type (Taylor et al. 2009). Thus accurate biophysical models could serve as a means to study homeostasis of intrinsic properties. Our results also demonstrate that there is room for improvement in the quality of models produced by this method, and the methods reported here cannot yet be implemented in real-time during an experiment. Spike timing is not perfect, and certain aspects of spike shape (especially spike height) are inaccurate. However, the gains from applying control adjustment while using trace error as a measure of model error are significant enough to warrant additional attention.
J Neurophysiol • doi:10.1152/jn.00007.2014 • www.jn.org
Innovative Methodology ESTIMATING PARAMETERS IN NEURONAL MODELS
_ Perturbing g
Na
_ vs gKd
0.10
rms error (mV
0.25 0.63 1.58
)
4000 1600
_ g Kd
600 300 100
1.58
63
25
10
_ g Na
3.98
_ _ Perturbing gCaT vs gKCa
rm s err
0.04 0.10 0.25
or (m V
0.63 1.58
)
6.31 2.51
_
g Ca
1.00 300
T
100
0.40 40 0.16
16 6.31
_ g KCa
Fig. 6. Surface plot of model error illustrates pairwise compensation between conductances. From our fit to synthetic data with mismatched conductance models, we took the best-fit model as a baseline. Then, 2 maximal conductances were systematically varied so as to form a grid. For each point on the grid, the model error was computed with control adjustment applied. Top: g Na and maximal delayed-rectifier potassium conductance g Kd were varied. The baseline model has the lowest error (highest peak), however, there is a line of compensation (red area) where changes to g Na can be partially ameliorated by accompanying changes to g Kd. Bottom: maximal inactivating calcium conductance g CaT and maximal calcium-activated potassium conductance g KCa were varied. This pairing also shows some compensation is possible, however, it occupies a smaller area and shows a negative correlation.
This approach addresses many issues discussed in prior work. Our approach produces a multicompartmental model matched to the activity of a biological neuron without requiring the use of very accurate voltage-sensitive dyes (Huys et al. 2006). Temporal alignment of traces is not a problem because the model is controlled to enforce alignment. In chaotic systems, stabilizing the model to match target data gives a better estimate of cost and decreases the presence of local minima (Abarbanel et al. 2009). It is not necessary to detect and to measure features such as spike or burst rate, which frees us to probe better the dynamics of target cells with broad-frequency current injections (Hobbs and Hooper 2008) that might otherwise render such features difficult to measure. As well, it is not necessary to choose weights for different features. This decreases the degree of human expertise to perform a fit. Perhaps most importantly, it is capable of producing good approximate
2341
models when the precise details of channel dynamics are not known. Some previous techniques (Bush et al. 2005; Huys et al. 2006) are capable of fitting models with thousands of compartments quite rapidly because they solve a linear problem by way of assuming known correct channel dynamics. It seems likely that they could be modified to include a nonlinear fit for channel dynamics but with some loss of speed. It is also unclear how this process would affect the quality of the best-fit model. This approach is not designed to be optimal but instead to implement model-fitting with the control-based error function with as little added complication as possible. We will describe the strengths and weaknesses of this approach and some areas where added algorithm complexity (or mere refinement) may yield improvement. A careful reading of Abarbanel et al. (2009) reveals that the error function could be tweaked or improved in numerous ways. These authors suggest decreasing the aggressiveness of control over the course of an individual simulation as well as scheduling a gradual decrease over the course of a fit. One way this can be implemented is by incorporating the control aggressiveness as a fit parameter and penalizing model fitness for high control aggressiveness. One reason these authors advocated this is to estimate the final state of unobserved dynamics of the model (such as activation states in a neuron model). However, it would also likely decrease the importance of finding the right balance in choosing c. One other possibility would be to simulate each model two or more times with different c for each simulation. The different fitness values could be combined in a multiobjective optimization scheme. We opted to avoid these approaches in the name of simplicity, although a careful examination of different strategies to schedule c may well be fruitful. To minimize error, we employed a variant of differential evolution. In pilot tests, we pitted various optimization strategies against each other, minimizing the multidimensional Rosenbrock “banana” function (Yao and Liu 1999). There, the differential evolution algorithm distinguished itself by being faster and more likely to converge to the correct minimum (data not shown) as well as having far fewer free parameters than many other techniques. We chose the Rosenbrock function because it is a well-known test function that has a winding, complicated parameter space. Although we were aware of the “no free lunch” theorems (Wolpert and Macready 1997), we first assumed that the Rosenbrock function would provide a similar difficulty to fitting neuron models, allowing us to tune the algorithm (e.g., choose the optimal population size). However, on attempting to fit neuron models, we quickly discovered that in fact the Rosenbrock function bears little resemblance to the error landscape of a neuron model. We then developed a script to fit differing numbers of parameters of a neuron model repeatedly to synthetic data (careful again to use different conductance models when generating the data and fitting it). This new script has proven capable for its intended purpose of computing optimal population sizes but also was invaluable for quantifying how changes to the genetic algorithm or the error function affect the fitting performance. We recommend a similar approach for anyone tweaking or testing algorithms to fit neuron models. It may seem obvious, if comforting, that we were able to recover original model parameters when we fit target data with
J Neurophysiol • doi:10.1152/jn.00007.2014 • www.jn.org
Innovative Methodology 2342
ESTIMATING PARAMETERS IN NEURONAL MODELS
a model capable of exactly matching it. Recovering the parameters in such an easy problem is seemingly the most basic criterion for a successful fitting strategy, yet it superficially flies in the face of the notion that there may be “multiple solutions,” i.e., many models that have similar activity despite different underlying conductances (Prinz et al. 2003; Taylor et al. 2009). We perturbed our target neurons with pink noise to disambiguate those multiple solutions. With appropriately chosen perturbing current, the range of different models that can respond similarly should be greatly reduced. Indeed, if the number of perturbations is increased, this should decrease the number of solutions found. This is critical if the goal of the enterprise is to create a model of an individual actual neuron (which by definition does not have multiple solutions because it is an individual case). The ability to fit neuron models successfully using incorrect conductance models is critical for any potential fitting strategy. Doing this with synthetic data allowed us to tune some of the free parameters of our fitting algorithm as well as to verify that this basic approach could potentially work in practical fits to real data. By repeatedly fitting synthetic problems of different sizes, we were able to develop an estimate of how long a fit will take before we attempt to fit it. This makes it possible to plan computational resource (and time) effectively in advance. It also provides a way to quantify how much harder it is to fit a model that cannot exactly generate its target data (e.g., because it uses different underlying conductance models). For fits where the underlying conductance models do not match the target exactly, it becomes more difficult to interpret the relationship between fit parameters and those of the underlying model. Is it a mismatch if g Na of the model using currents from Turrigiano et al. (1995) is not the same as g Na of the target using Connor-Stevens (Connor et al. 1977) currents? More problematically, we found that other unaltered conductances could shift to compensate for differences: even membrane capacitance and axial resistivity could be altered. Thus proper interpretation of the results of a fitting procedure is not as simple as reading the final parameters. Because in biological neurons there are always going to be unmeasured parameters, any model produced is at best a good approximation of reality and at worst a misleading one. Thus far, we are unable to match spike height in our fit to real data. However, accurate spike timing is difficult to achieve for conductance-based models, and we believe this represents a significant step forward. The model we obtained already produces activity plausible enough that it would be difficult to identify as artificial (except for the lack of noise). These models provide an excellent starting point for studies of homeostasis and compensation or a way to investigate the possible effects of potential perturbations to a neuron. The simple plots of the fitness landscape in Fig. 6 are suggestive but are by no means a complete characterization of compensation. After all, homeostatic compensation is likely to involve more than only two conductances. A more sophisticated investigation of the fitness landscape is surely possible. If nothing else, the population of models from the final generation of the genetic algorithm provides a close sampling near the final model. A close examination of that space would likely yield clues to avenues for compensation. As can be seen in Ball et al. (2010) and Franklin et al. (2010), the exact details of compen-
sation are contingent on the desired target activity. In investigating homeostasis, this error function and the models it produces provide an excellent place to focus our efforts. APPENDIX
Formulas for ion-channel models. All ion-channel models produced a transmembrane current i according to the formula: i ⫽ gm phq共v ⫺ E兲 , where g is a constant maximal conductance (either fit or hand-tuned), m is the activation state variable, h is the inactivation state variable, p is a constant integer (from 1 to 4), q is a constant integer (either 0 or 1), v is membrane voltage, and E is the reversal potential of the channel model. Usually, m and h are specified by equations of the form: dx dt
⫽
x⬁(v) ⫺ x
x(v)
T⫺TB 10°C q10 ,
where x is a gating variable standing in for m or h, x⬁(v) is the voltage-dependent steady-state value of x, x(v) is the voltage-dependent time constant of x, T is the instantaneous neuron model temperature in Celsius, TB is the base temperature of the ion-channel model, and q10 is a constant specifying the fold change in rate for a 10°C change in neuron temperature. For A-type potassium conductance models and h conductance models, we used q10 values derived from Tang et al. (2010). Otherwise, we set q10 to 3.0 as an approximation. Temperature did not vary during a simulation, but the q10 mechanism was necessary because different channel models had different base temperatures. For NaCS and KdCS, m and h were specified by: dx dt
⫽ 兵␣(v) ⫺ 关␣(v) ⫹ (v)兴x其
T⫺TB 10°C q10 ,
where ␣(v) and (v) are the voltage-dependent rate constants associated with increasing and decreasing x, respectively. The reversal potential for most channels was a fixed constant, but for calcium channels it was calculated according the Nernst equation: E⫽
k BT Ze
冉 关关
log
Ca2⫹兴ext Ca2⫹兴int
冊
,
J
where kB ⫽ 1.38ⴱ1023 K is the Boltzmann constant, T is the temperature in Kelvin, Z ⫽ 2 is the valence number of calcium ions, e ⫽ 1.60ⴱ10⫺22J Ⲑ mV is the elementary charge, [Ca2⫹]ext ⫽ 13,000 M is the concentration of calcium ions exterior to the neuron, and [Ca2⫹]int is the concentration of calcium ion interior to the neuron. The interior concentration of calcium ions was updated by a leaky accumulator CaAccumulate: d关Ca2⫹兴int dt
⫽
ceq ⫺ 关Ca2⫹兴int
⫹ ␥iCa ,
where ceq ⫽ 0.5 M is the equilibrium calcium concentration, ⫽ 300 ms is the time constant of the relaxation toward equilibrium of the accumulator, iCa is the total instantaneous transmembrane calcium current (in nanoamperes), and ␥ is a constant coefficient with units of micromolar concentration per nanoampere per millisecond. We approximated the accumulation region as being a microdomain beneath the membrane surface and thus calculated:
Ⲑ
1 ␥ ⫽ 103ZNA e A d, where NA ⫽ 6.02 ⫻ 1023 is Avogadro’s number, A is the surface area of the neuron compartment in square millimeters, and d is the domain
J Neurophysiol • doi:10.1152/jn.00007.2014 • www.jn.org
Innovative Methodology ESTIMATING PARAMETERS IN NEURONAL MODELS
2343
Table A1. Channel models from Turrigiano et al. (1995) Ion
Kd
Af
TB
q10
E, mV
xk
23.5
3.0
⫺80
m4
23.5
3.0
⫺80
3.78
23.5
3.0
冉
1⫹exp ⫺
3.78
23.5
3.0
⫺80
m4
冉
23.5
3.36
⫺32.3
1
23.5
3.0
Nernst
6.6 mV
23.5
3.0
冉
m
冉
8.7 mV 1
m3
冉
1 v⫹30.1 mV 5.5 mV
23.5
3.0
55
1
冉
m3
冉
v⫹25.5 mV
h 1⫹exp
冉
8.5 mV 1
1⫹exp ⫺
3.0
冊
5.29 mV
1 v⫹48.9 mV 5.18 mV
冉
1⫹exp ⫺
冉 冉
13.3 ms ⫺
23.5
3.0
55
冉
m3
1
1⫹exp ⫺
3.0
h 1⫹exp
冉
8.2 mV
1 v⫹48.5 mV 4.8 mV
冊
15.2 mV
v⫹38.9 mV 26.5 mV
v⫹50.3 mV 11.8 mV
冉
冉
1⫹exp ⫺
冉 冉
16.9 mV
冉 冉
冉
冉
26.4 mV
25.0 mV
3.6 mV
v⫹62.9 mV 10.0 mV
冊
冉
v⫹26.5 mV 8.6 mV
379 ms
1⫹exp ⫺
v⫹33.6 mV 11.7 mV
冊
冊
10.7 ms
冉
冊
v⫹120.0 mV
v⫹34.9 mV
1⫹exp ⫺
666 ms ⫺
v⫹25.1 mV
0.67 ms
1⫹exp
冊
1.26 ms
1⫹exp ⫺
1.005 ms ⫺
冊
冊
13.1 ms
1⫹exp ⫺
19.8 ms ⫺
20.5 mV
v⫹55.0 mV
冊
冊
v⫹68.1 mV
89.8 ms
1⫹exp ⫺
冊
8.73 mV
冉
105 ms ⫺
冊
22.7 mV
v⫹42.2 mV
1⫹exp ⫺
1.32 ms ⫺
v⫹46.0 mV
21.3 ms
21.7 ms ⫺
冊
冊
4.6 mV
1,499 ms
1⫹exp ⫺
16.0 ms ⫺
冊
v⫹69.9 mV
75.1 ms
272 ms ⫺
冊
冊
9,269 ms
1⫹exp ⫺
冊
v⫹26.8 mV
v⫹32.9 mV
9.0 ms
1⫹exp ⫺
冊
冊
29.2 ms
1⫹exp ⫺
Nap
19.2 mV
10.4 ms
11.6 ms ⫺
9,821 ms ⫺
冊
v⫹21.6 mV
1⫹exp ⫺
Na
7.18 mV
v⫹28.3 mV
1⫹exp ⫺
冊
v⫹27.1 mV
6.4 ms
1⫹exp ⫺
90.3 ms ⫺
12.6 mV
v⫹78.3 mV
冉
7.2 ms ⫺
38.6 ms ⫺
冊
v⫹28.3 mV
1
冉
m3
h
Nernst
冊
关Ca2⫹兴int
1⫹exp
CaS
9.4 mV
1
1⫹exp ⫺
3.0
v⫹24.3 mV
v⫹61.3 mV
冊
冊
关Ca2⫹兴int⫹3M
1⫹exp
CaT
8.7 mV
4.9 mV
1⫹exp ⫺
h
v⫹27.2 mV
1
1⫹exp ⫺
h
11.8 mV
v⫹56.9 mV
冉
m3
1⫹exp
KCa
冉
v⫹12.3 mV
1
冉
m3
h
⫺80
1
1 ⫹ exp ⫺
1⫹exp
As
x(v)
x⬁(v)
冊
冊
List of all parameters and formulas needed to compute ion-channel model current for models derived from Turrigiano et al. (1995). The columns correspond to: the ion-channel model abbreviation, model base temperature in Celsius, q10 value, reversal potential, which gate is specified and the fixed exponent, the formula for the voltage-dependent steady-state gate value, and the formula for the voltage-dependent time constant of the gate dynamics. Models with 2 rows have an activation gate (m) and an inactivation gate (h), and models with 1 row have only activation. Kd, delayed-rectifier potassium; Af, fast A-type potassium; As, slow A-type potassium; KCa, calcium-activated potassium; h, hyperpolarization-activated mixed cation; CaT, inactivating calcium; CaS, noninactivating calcium; Na, fast sodium; Nap, persistent sodium; [Ca2⫹]int, concentration of calcium ion interior to the neuron. J Neurophysiol • doi:10.1152/jn.00007.2014 • www.jn.org
Innovative Methodology 2344
ESTIMATING PARAMETERS IN NEURONAL MODELS
Table A2. Additional STG-related channel models Ion
MI
TB
q10
E, mV
xk
10
3.0
0.0
m
冉
1⫹exp
CAN
21
1 v⫹30.0 mV 5.0 mV
冊
6.0 ms
unbind
⫺27
3.0
x(v)
x⬁(v)
m
unbind
bind unbind
1⫹
bind
1.0 ⫹
关Ca 兴bind 2⫹
⫹
unbind
关Ca2⫹兴int
bind 关Ca 兴int ⫹ 关Ca2⫹兴 2⫹
关Ca 兴int 2⫹
List of all parameters and formulas needed to compute ion-channel model current for 2 additional currents found in the stomatogastric ganglion (STG). Modulatory inward current (MI) and calcium-activated nonspecific current (CAN) both have no inactivation. By default, [Ca2⫹]bind ⫽ 3M, unbind ⫽ 627 ms, and bind ⫽ 300 ms.
depth in micrometers. The default value of d was 2.52 m, although we used d as a fittable parameter when fitting the biological AGR neuron. The equations and constants needed for each ion-channel model are listed in Tables A1, A2, and A3. Note that a bug in our code resulted in m⬁ being calculated incorrectly for ACS. We show the typo in Table A3 as ACS-Bug, however, this typo does not affect our conclusions, as the principle importance of ACS is that it is different from the A-type current listed in Table A1.
Three-compartment bursting model. We hand-tuned a threecompartment model to produce bursting activity. The three compartments were labeled soma, PN, and axon. For the purposes of setting parameters, soma and PN were additionally labeled passive. The three compartments were connected sequentially (1 side of soma connected to 0 side of PN, 1 side of PN connected to 0 side of axon). The geometry and channel models of the model are listed in Table A4. We produced six versions of this model from different parameter sets: a target model that was hand-tuned to produce bursting activity,
Table A3. Channel models from Connor et al. (1977) Ion
ACS
TB
q10
E, mV
xk
6.3
3.0
⫺80
m3
3.78
ACS-Bug
6.3
3.0
h
⫺80
m3
冤 冋
Ion
TB
h 3
q10
m
冉
0.0761 exp
冉
1⫹exp
1 ⫹ exp
冤 冉 1⫹exp
3.78
x(v)
x⬁(v)
冉
31.84 mV
v⫹1.17 mV 28.93 mV
v⫹53.3 mV 14.54 mV
冊
冊 冥
v⫹94.22 mV
冊册
1 3
28.93 mV Unchanged
exp
冉
6.3
3.0
⫺80
v⫹94.22 mV 31.84 mV
冊冊冥
冉
v⫹45.7 mV
10.0 mV v⫹29.7 mV
NaCS
6.3
3.0
55
3
m
1.0 kHz
10.0 mV
冉 冉
1⫺exp ⫺ 3.0
h
v⫹29.7 mV
共0.07 kHz兲exp ⫺
冊
冉
共4.0 kHz兲exp ⫺
冊 冊
10.0 mV v⫹48.0 mV 20.0 mV
冉
共0.0625 kHz兲exp ⫺
10.0 mV
1⫺exp ⫺
v⫹50.0 mV 16.027 mV
冊
冊
Unchanged
(v)
0.05 kHz
20.12 mV
Unchanged
␣(v)
3
m
冉
1⫹exp ⫺ 1 3
v⫹55.96 mV
10.18 ms
4.712 ms ⫺
v⫹45.7 mV KdCS
冉
1⫹exp ⫺
⫺4
0.0761 v⫹1.17 mV
4.400 ms
1.380 ms ⫺
v⫹55.7 mV
v⫹54.7 mV 18.0 mV
1.0 kHz
冉
1⫹exp ⫺
80.0 mV
v⫹18.0 mV 10.0 mV
冊
冊
冊
List of all parameters and formulas needed to compute ion-channel model current for models derived from Connor et al. (1977). ACS, A-type potassium; KdCS, delayed-rectifier potassium; NaCS, fast sodium; ␣(v) and (v), voltage-dependent rate constants. Models with 2 rows have an activation gate and an inactivation gate, and models with 1 row have only activation. J Neurophysiol • doi:10.1152/jn.00007.2014 • www.jn.org
Innovative Methodology ESTIMATING PARAMETERS IN NEURONAL MODELS
2345
Table A4. Geometry and channels of 3-compartment bursting model
Length, m Radius, m Channels
Soma
PN
Axon
400 5 Leak, MI, CaT, KCa
400 5 Leak, MI, CaT, KCa
400 3 Leak, NaCS*, KdCS*, ACS-Bug*, Na†, Kd†, Af†
Geometry and channel models used to simulate a 3-compartment bursting model (and variations on it produced via hand-tuning or fitting). *Mechanisms that were used in models that employed Connor-Stevens channel models for spiking currents (the majority of models); †mechanisms that were used in models that employed channel models based on Turrigiano et al. (1995) for spiking currents (the mismatched fit model from Fig. 4).
Table A5. Parameters of 3-compartment bursting models
T, °C Specific capacitance, nF/mm2 Axial resistivity, M⍀·m [Ca2⫹]ext, mM E_LeakPassive, mV g_LeakPassive, S/nF g_MI Passive, S/nF g_CaT Passive, S/nF g_KCa Passive, S/nF E_LeakAxon, mV g_Leak Axon, S/nF * g_Na Axon, S/nF * g_Kd Axon, S/nF * g_A Axon, S/nF * mvshift_Na, mV * hvshift_Na, mV * vscale_Na * mvscale_Na * hvscale_Na * scale_Na mscale_Na hscale_Na * vshift_Kd, mV * vscale_Kd * scale_Kd * mvshift_A, mV * hvshift_A, mV * vscale_A * mvscale_A * hvscale_A * scale_A * mscale_A * hscale_A vshift_MI, mV Initial value parameters v(0), mV m_CaT(0) h_CaT(0) [Ca2⫹]int(0), mM m_KCa(0) m_MI(0) m_Na(0) h_Na(0) m_Kd(0) m_A(0) h_A(0)
Target
Decreased g Na
Minimal RMS
Same-Channel Fit
Mismatch, No Fit Kinetics
Mismatch, Fit Kinetics
10.0 10.0 0.6 13.0 ⫺40.0 0.4 0.7 1.0 35.0 ⫺17.0 0.075 30.0 6.0 11.925 0.0 0.0 1.0 1.0 1.0 1.0 1.0 1.0 0.0 1.0 1.0 0.0 0.0 1.0 1.0 1.0 1.0 1.0 1.0 8.0
10.0 10.0 0.6 13.0 ⫺40 0.4 0.7 1.0 35.0 ⫺17.0 0.075 29.0 6.0 11.925 0.0 0.0 1.0 1.0 1.0 1.0 1.0 1.0 0.0 1.0 1.0 0.0 0.0 1.0 1.0 1.0 1.0 1.0 1.0 8.0
10.0 10.0 0.6 13.0 ⫺40 0.4 0.7 1.0 35.0 ⴚ61.487 0.22712 13.631 2.5297 0.11925 0.0 0.0 1.0 1.0 1.0 1.0 1.0 1.0 0.0 1.0 1.0 0.0 0.0 1.0 1.0 1.0 1.0 1.0 1.0 8.0
10.0 10.0 0.6 13.0 ⫺40 0.4 0.7 1.0 35.0 ⴚ17.003 0.075008 29.997 5.9986 11.942 1.51*10⫺4 ⴚ3.23*10⫺4 0.99998 1.0 1.0 0.99997 1.0 1.0 5.75*10⫺4 0.99984 1.0000 ⴚ0.01490 0.0025971 1.0003 1.0 1.0 1.0001 1.0 1.0 8.0
10.0 10.0 0.6 13.0 ⫺40 0.4 0.7 1.0 35.0 ⴚ73.801 0.13417 0.30001 192.43 38.281 0.0 0.0 1.0 1.0 1.0 1.0 1.0 1.0 0.0 1.0 1.0 0.0 0.0 1.0 1.0 1.0 1.0 1.0 1.0 8.0
10.0 10.0 0.6 13.0 ⫺40 0.4 0.7 1.0 35.0 ⴚ70.206 0.22994 8.0140 600.00 0.10055 10.739 10.308 1.0 2.0607 4.9055 1.0 0.10000 3.6444 ⴚ23.024 2.5999 0.26804 20.871 ⴚ19.443 1.0 0.10000 0.16839 1.0 4.9550 8.1236 8.0
⫺45.0 0.1 0.1 0.01 0.3 0.1 0.1 0.1 0.3 0.3 0.3
⫺45.0 0.1 0.1 0.01 0.3 0.1 0.1 0.1 0.3 0.3 0.3
⫺45.0 0.1 0.1 0.01 0.3 0.1 0.1 0.1 0.3 0.3 0.3
⫺45.0 0.1 0.1 0.01 0.3 0.1 0.099777 0.10144 0.30036 0.29997 0.29974
⫺45.0 0.1 0.1 0.01 0.3 0.1 0.99992 0.99986 0.18335 0.46418 2.74*10⫺8
⫺45.0 0.1 0.1 0.01 0.3 0.1 0.39257 0.97387 0.17454 0.86920 0.63876
Complete list of parameters for 6 variations of the 3-compartment bursting model. Column 1 is the target model (A refers to A-type potassium conductances). Column 2 is identical but for a small hand-tuned change in sodium conductance (Fig. 2, left column). Column 3 was produced by minimizing root-mean-square (RMS) error without control adjustment (Fig. 2, right column). Column 4 was the result of a fit with control adjustment (Fig. 3). Column 5 was the result of a fit with control adjustment but using mismatched channel models and not fitting the kinetic fudge factors (Fig. 4A). Column 6 was the result of a fit with control adjustment and mismatched parameters but fitting the kinetic fudge factors (Fig. 4, B–D). Columns 1– 4 used Connor-Stevens channel models. Columns 5 and 6 used channel models based on Turrigiano et al. (1995). Numbers in bold were altered (by hand or fitting) from the target model. *Parameters that corresponded to different channel models depending on which set was used for that model. g Na, maximal sodium conductance; T, instantaneous neuron model temperature; [Ca2⫹]ext, concentration of calcium ion exterior to the neuron. J Neurophysiol • doi:10.1152/jn.00007.2014 • www.jn.org
Innovative Methodology 2346
ESTIMATING PARAMETERS IN NEURONAL MODELS
Table A6. Geometry and channels of AGR model
Length, m Radius, m Channels
PN
Soma
AN
Branch
Axon
107.81 2.74 Leak, Kd, As, Af, Nap
63.9 9.06 Leak, Kd, As, Af, Nap, MI, KCa, CaS, CaT, CAN
387 3.26 Leak, Kd, As, Af, Nap
354.0 1.76 Leak, Kd, As, Af, Nap
6 2.05 Leak, Kd, As, Af, Na, h
Geometry and channel models used to simulate a model of specific anterior gastric receptor (AGR) neuron. PN, posterior neurite; AN, anterior neurite.
a model with a slight decrease in the maximal conductance of sodium, a model produced by fitting to target data (minimizing RMS error) without control adjustment, a model produced by fitting with control adjustment, and 2 mismatch models produced by changing the spiking conductance models and fitting with control adjustment (the 1st model was produced without fitting kinetic fudge factors, e.g., mvshift for Na, and the 2nd model was produced by fitting those parameters). The parameters of those models are listed in Table A5. Model of biological neuron AGR 803-121. We used a 5-compartment model to emulate partially the simple branching structure of AGR neurons. The 5 compartments were PN, soma, AN, branch, and axon. They were connected sequentially except that both branch and axon connected to the distal end of AN. PN, soma, AN, and branch were labeled passive, and additionally PN and branch were labeled neurites. Table A6 lists physical parameters of the geometry as well as the channel models that were used in each compartment. Table A7 lists the parameters of the best-fit model as well as the ranges of parameters considered when performing the fit. ACKNOWLEDGMENTS We thank Alex Williams for assistance with proof reading. Computational support was provided by Brandeis High Performance Computing Cluster. GRANTS This work was supported by National Institute of Mental Health Grant MH-46742. DISCLOSURES No conflicts of interest, financial or otherwise, are declared by the author(s). AUTHOR CONTRIBUTIONS T.B. and E.M. conception and design of research; M.L.G. performed experiments; T.B. analyzed data; T.B. interpreted results of experiments; T.B. prepared figures; T.B. drafted manuscript; T.B., M.L.G., and E.M. edited and revised manuscript; T.B., M.L.G., and E.M. approved final version of manuscript. REFERENCES Abarbanel HD. Effective actions for statistical data assimilation. Phys Lett A 373: 4044 – 4048, 2009. Abarbanel HD, Creveling DR, Farsian R, Kostuk M. Dynamical state and parameter estimation. Siam J Appl Dyn Syst 8: 1341–1381, 2009. Badel L, Lefort S, Berger TK, Petersen CC, Gerstner W, Richardson MJ. Extracting non-linear integrate-and-fire models from experimental data using dynamic I-V curves. Biol Cybern 99: 361–370, 2008. Ball JM, Franklin CC, Tobin AE, Schulz DJ, Nair SS. Coregulation of ion channel conductances preserves output in a computational model of a crustacean cardiac motor neuron. J Neurosci 30: 8637– 8649, 2010. Ballo AW, Bucher D. Complex intrinsic membrane properties and dopamine shape spiking activity in a motor axon. J Neurosci 29: 5062–5074, 2009. Ballo AW, Keene JC, Troy PJ, Goeritz ML, Nadim F, Bucher D. Dopamine modulates Ih in a motor axon. J Neurosci 30: 8425– 8434, 2010. Bush K, Knight J, Anderson C. Optimizing conductance parameters of cortical neural models via electrotonic partitions. Neural Netw 18: 488 – 497, 2005.
Combes D, Simmers J, Moulins M. Structural and functional characterization of a muscle tendon proprioceptor in lobster. J Comp Neurol 363: 221–234, 1995. Combes D, Simmers J, Nonnotte L, Moulins M. Tetrodotoxin-sensitive dendritic spiking and control of axonal firing in a lobster mechanoreceptor neurone. J Physiol 460: 581– 602, 1993. Connor JA, Walter D, McKown R. Neural repetitive firing: modifications of the Hodgkin-Huxley axon suggested by experimental results from crustacean axons. Biophys J 18: 81–102, 1977. Cummins MA, Devenyi RA, Sobie EA. Yoga for the sinoatrial node: sarcoplasmic reticulum calcium release confers flexibility. J Mol Cell Cardiol 60: 161–163, 2013. Daur N, Diehl F, Mader W, Stein W. The stomatogastric nervous system as a model for studying sensorimotor interactions in real-time closed-loop conditions. Front Comput Neurosci 6: 13, 2012. Druckmann S, Banitt Y, Gidon A, Schurmann F, Markram H, Segev. A novel multiple objective optimization framework for constraining conductance-based neuron models by experimental data. Front Neurosci 1: 7–18, 2007. Druckmann S, Berger TK, Hill S, Schurmann F, Markram H, Segev I. Evaluating automated parameter constraining procedures of neuron models by experimental and surrogate data. Biol Cybern 99: 371–379, 2008. Franklin CC, Ball JM, Schulz DJ, Nair SS. Generation and preservation of the slow underlying membrane potential oscillation in model bursting neurons. J Neurophysiol 104: 1589 –1602, 2010. Gerstner W, Naud R. Neuroscience. How good are neuron models? Science 326: 379 –380, 2009. Goeritz ML, Bowers MR, Slepian B, Marder E. Neuropilar projections of the anterior gastric receptor neuron in the stomatogastric ganglion of the Jonah crab, Cancer borealis. PLoS One 8: e79306, 2013. Goeritz ML, Ouyang Q, Harris-Warrick RM. Localization and function of Ih channels in a small neural network. J Neurophysiol 106: 44 –58, 2011. Golowasch J, Buchholtz F, Epstein IR, Marder E. Contribution of individual ionic currents to activity of a model stomatogastric ganglion neuron. J Neurophysiol 67: 341–349, 1992. Gutierrez GJ, Grashow RG. Cancer borealis stomatogastric nervous system dissection. J Vis Exp 25: 1207, 2009. Haufler D, Morin D, Lacaille JC, Skinner FK. Parameter estimation in single-compartment neuron models using a synchronization-based method. Neurocomputing 70: 1605–1610, 2007. Hobbs KH, Hooper SL. Using complicated, wide dynamic range driving to develop models of single neurons in single recording sessions. J Neurophysiol 99: 1871–1883, 2008. Huys QJ, Ahrens MB, Paninski L. Efficient estimation of detailed singleneuron models. J Neurophysiol 96: 872– 890, 2006. Jolivet R, Kobayashi R, Rauch A, Naud R, Shinomoto S, Gerstner W. A benchmark test for a quantitative assessment of simple neuron models. J Neurosci Methods 169: 417– 424, 2008a. Jolivet R, Roth A, Schurmann F, Gerstner W, Senn W. Special issue on quantitative neuron modeling. Biol Cybern 99: 237–239, 2008b. Larimer JL, Kennedy D. Visceral afferent signals in the crayfish stomatogastric ganglion. J Exp Biol 44: 345–354, 1966. LeMasson G, Maex R. Introduction to equation solving and parameter fitting. In: Computational Neuroscience: Realistic Modeling for Experimentalists, edited by De Shutter E. London: CRC Press, 2000, p. 15–18. Marder E, Taylor AL. Multiple models to capture the variability in biological neurons and networks. Nat Neurosci 14: 133–138, 2011. O’Leary T, Williams AH, Caplan JS, Marder E. Correlations in ion channel expression emerge from homeostatic tuning rules. Proc Natl Acad Sci USA 110: E2645–E2654, 2013.
J Neurophysiol • doi:10.1152/jn.00007.2014 • www.jn.org
Innovative Methodology ESTIMATING PARAMETERS IN NEURONAL MODELS
2347
Table A7. Parameters of AGR model
T, °C [Ca2⫹]ext, mM Specific capacitance, nF/mm2 Axial resistivity, M⍀.m Specific capacitance (neurites), nF/mm2 Axial resistivity (neurites), M⍀.m Specific capacitance (axon), nF/mm2 Axial resistivity (axon), M⍀.m E_Na, mV E_K, mV E_LeakPassive, mV g_LeakPassive, S/nF g_Kd Passive, S/nF g_As Passive, S/nF g_Af Passive, S/nF g_Nap Passive, S/nF g_KCa Passive, S/nF g_MI Passive, S/nF g_CAN Passive, S/nF g_CaS Passive, S/nF g_CaT Passive, S/nF E_LeakAxon, mV g_Leak Axon, S/nF g_h Axon, S/nF g_Na Axon, S/nF g_Nap Axon, S/nF g_Af Axon, S/nF g_As Axon, S/nF g_Kd Axon, S/nF _CaAccumulate, ms 2⫹ [Ca ]equilibrium CaAccumulate, mM [Ca2⫹]Half Active KCa, mM vshift_MI, mV E_CAN, mV unbind_CAN, ms bind_CAN, ms [Ca2⫹]bind_CAN, mM vshift_KCa, mV vscale_KCa scale_KCa vshift_h, mV vscale_h scale_h vshift_CaS, mV vscale_CaS scale_CaS vshift_CaT, mV vscale_CaT scale_CaT vshift_Kd, mV vscale_Kd scale_Kd mvshift_As, mV hvshift_As, mV mvscale_As hvscale_As mscale_As hscale_As mvshift_Af, mV hvshift_Af, mV mvscale_Af hvscale_Af mscale_Af hscale_Af mvshift_Na, mV hvshift_Na, mV mvscale_Na hvscale_Na
Fit
Min Allowed
Max Allowed
Min Initial
Max Initial
10.0 13.0 114.73 6.4652 457.45 75.148 1.2526 3.3803 80 ⴚ83.907 ⴚ56.265 0.082782 4,543.0 19,157 117.92 35.073 0.42431 0.051968 1.2471 3.069*10ⴚ4 1.3210 ⴚ82.631 8.6554 3.1197 51.750 1,520.3 4,144.5 477.55 4,999.0 1,063.8 4.235*10ⴚ4 5.651*10⫺4 6.6193 ⴚ13.432 450 119.40 4.380*10ⴚ5 13.462 0.21283 0.27380 ⴚ3.4572 0.18066 0.11286 20.085 1.3765 0.14567 8.7143 0.49520 0.10002 ⴚ19.505 1.1023 0.13348 18.006 43.496 0.10061 9.7239 1.9297 0.15787 35.896 21.899 0.12538 0.10080 0.22060 2.0320 24.284 ⴚ32.955 0.55262 2.2006
10 13.0 1 0.01 0.1 0.1 1 0.1 30 ⫺100 ⫺90 10⫺4 10⫺3 10⫺3 10⫺3 10⫺3 10⫺3 10⫺4 10⫺4 10⫺4 10⫺4 ⫺90 10⫺4 10⫺4 10 10⫺3 1 1 1 1 ⫺7 10 10⫺5 ⫺30 ⫺45 450 100 3*10⫺6 ⫺50 0.1 0.1 ⫺50 0.1 0.1 ⫺50 0.1 0.1 ⫺50 0.1 0.1 ⫺50 0.1 0.1 ⫺50 ⫺50 0.1 0.1 0.1 0.1 ⫺50 ⫺50 0.1 0.1 0.1 0.1 ⫺50 ⫺50 0.1 0.1
10 13.0 1,000 100 500 500 500 100 80 ⫺60 55 10 2*104 2*104 2*104 100 2*104 20 20 20 20 55 500 5,000 104 2,000 104 104 104 104 0.05 1 30 ⫺10 1,000 600 0.3 50 10 10 50 10 10 50 10 10 50 10 10 50 10 10 50 50 10 10 10 10 50 50 10 10 10 10 50 50 10 10
10 13.0 100 0.1 1 5 45 0.1 40 ⫺90 ⫺60 0.02 0.1 0.1 0.1 0.01 400 0.01 0.01 0.01 0.01 ⫺90 0.01 0.1 10 1 10 10 10 60 5*10⫺5 0.001 ⫺15 ⫺30 600 250 3*10⫺4 ⫺1 0.9 0.9 ⫺1 0.9 0.9 ⫺1 0.9 0.9 ⫺1 0.9 0.9 ⫺1 0.9 0.9 ⫺1 ⫺1 0.9 0.9 0.9 0.9 ⫺1 ⫺1 0.9 0.9 0.9 0.9 ⫺1 ⫺1 0.9 0.9
10 13.0 150 10 70 90 95 60 ⫺80 ⫺40 2 1,000 1,000 1,000 10 1,000 2 2 2 2 25 150 1,500 600 100 5,000 4,000 400 500 0.005 0.1 ⫺5 ⫺10 600 400 0.03 1 1.1 1.1 1 1.1 1.1 1 1.1 1.1 1 1.1 1.1 1 1.1 1.1 1 1 1.1 1.1 1.1 1.1 1 1 1.1 1.1 1.1 1.1 1 1 1.1 1.1
Continued J Neurophysiol • doi:10.1152/jn.00007.2014 • www.jn.org
Innovative Methodology 2348
ESTIMATING PARAMETERS IN NEURONAL MODELS
Table A7.—Continued Fit
Min Allowed
mscale_Na hscale_Na mvshift_Nap, mV hvshift_Nap, mV mvscale_Nap hvscale_Nap mscale_Nap hscale_Nap
0.12127 0.010665 ⴚ46.213 1.4282 1.4963 0.10001 8.6347 0.013472
0.1 0.1 ⫺50 ⫺50 0.1 0.1 0.01 0.01
Initial value parameters v_Soma(0), mV m_Kd_Soma(0) m_As_Soma(0) h_As_Soma(0) m_Af_Soma(0) h_Af_Soma(0) m_CaS_Soma(0) m_CaT_Soma(0) h_CaT_Soma(0) m_KCa_Soma(0) m_MI_Soma(0) m_CAN_Soma(0) m_Nap_Soma(0) h_Nap_Soma(0) [Ca2⫹]int_Soma(0), mM v_Neurites(0), mV m_Kd_Neurites(0) m_As_Neurites(0) h_As_Neurites(0) m_Af_Neurites(0) h_Af_Neurites(0) m_Nap_Neurites(0) h_Nap_Neurites(0) v_Axon(0), mV m_Kd_Axon(0) m_As_Axon(0) h_As_Axon(0) m_Af_Axon(0) h_Af_Axon(0) m_Na_Axon(0) h_Na_Axon(0) m_h_Axon(0) m_Nap_Axon(0) h_Nap_Axon(0) v_PostNeurite(0), mV m_Af_PostNeurite(0) h_Af_PostNeurite(0) m_As_PostNeurite(0) h_As_PostNeurite(0) m_Kd_PostNeurite(0) m_Nap_PostNeurite(0) h_Nap_PostNeurite(0)
ⴚ60.747 0.098513 0.66210 0.71786 0.47211 0.074055 0.43044 0.50530 0.97699 0.54864 0.91673 0.11826 2.671*10ⴚ5 0.0045812 0.10033 ⴚ75.120 0.18353 0.99572 0.93644 0.17818 0.10433 0.68503 0.21734 ⴚ9.4199 0.42661 0.42421 0.51375 0.97443 0.64396 0.45679 0.68907 0.26415 0.066588 0.20867 ⴚ65.099 0.18916 0.10310 0.081190 0.99858 0.97781 0.98590 0.03280
⫺61.258 0 0 0 0 0 0 0 0 0 0 0 0 0 10⫺9 ⫺80 0 0 0 0 0 0 0 ⫺80 0 0 0 0 0 0 0 0 0 0 ⫺80 0 0 0 0 0 0 0
Max Allowed 10 10 50 50 10 10 10 10 ⫺57.258 1 1 1 1 1 1 1 1 1 1 1 1 1 103 55 1 1 1 1 1 1 1 55 1 1 1 1 1 1 1 1 1 1 55 1 1 1 1 1 1 1
Min Initial
Max Initial
0.9 0.9 ⫺1 ⫺1 0.9 0.9 0.9 0.9
1.1 1.1 1 1 1.1 1.1 1.1 1.1
⫺55.358 0 0 0 0 0 0 0 0 0 0 0 0 0 10⫺4 ⫺60 0 0 0 0 0 0 0 ⫺60 0 0 0 0 0 0 0 0 0 0 ⫺60 0 0 0 0 0 0 0
⫺55.158 1 1 1 1 1 1 1 1 1 1 1 1 1 100 ⫺40 1 1 1 1 1 1 1 ⫺40 1 1 1 1 1 1 1 1 1 1 ⫺30 1 1 1 1 1 1 1
Complete list of parameters for model fit to specific AGR neuron. Column 1 corresponds to final results. Numbers in bold were fit. Columns 2 and 3 correspond to minimum and maximum bounds that parameters could take. Columns 4 and 5 correspond to minimum and maximum values seeded into the 1st generation of the genetic algorithm. Prinz AA, Billimoria CP, Marder E. Alternative to hand-tuning conductance-based models: construction and analysis of databases of model neurons. J Neurophysiol 90: 3998 – 4015, 2003. Rios LM, Sahinidis NV. Derivative-free optimization: a review of algorithms and comparison of software implementations. J Glob Optim 56: 1247–1293, 2013. Roth A, Bahl A. Divide et impera: optimizing compartmental models of neurons step by step. J Physiol 587: 1369 –1370, 2009. Smarandache CR, Stein W. Sensory-induced modification of two motor patterns in the crab, Cancer pagurus. J Exp Biol 210: 2912–2922, 2007. Storn R, Price K. Differential evolution - a simple and efficient heuristic for global optimization over continuous spaces. J Glob Optim 11: 341–359, 1997. Tang LS, Goeritz ML, Caplan JS, Taylor AL, Fisek M, Marder E. Precise temperature compensation of a phase in a rhythmic motor pattern. PLoS Biol 8: e10000469, 2010. Taylor AL, Goaillard JM, Marder E. How multiple conductances determine electrophysiological properties in a multicompartment model. J Neurosci 29: 5573–5586, 2009.
Turrigiano GG, LeMasson G, Marder E. Selective regulation of current densities underlies spontaneous changes in the activity of cultured neurons. J Neurosci 15: 3640 –3652, 1995. Van Geit W, Achard P, De Schutter E. Neurofitter: a parameter tuning package for a wide range of electrophysiological neuron models. Front Neuroinform 1: 1, 2007. Van Geit W, De Schutter E, Achard P. Automated neuron model optimization techniques: a review. Biol Cybern 99: 241–251, 2008. Weaver CM, Wearne SL. Neuronal firing sensitivity to morphologic and active membrane parameters. PLoS Comput Biol 4: e11, 2008. Wolpert DH, Macready WG. No free lunch theorems for optimization. IEEE Transactions on Evolutionary Computation 1: 67– 82, 1997. Yao X, Liu Y. Evolutionary programming made faster. IEEE Transactions on Evolutionary Computation 3: 82–102, 1999. Zhang B, Wootton JF, Harris-Warrick RM. Calcium-dependent plateau potentials in a crab stomatogastric ganglion motor neuron. II. Calciumactivated slow inward current. J Neurophysiol 74: 1938 –1946, 1995.
J Neurophysiol • doi:10.1152/jn.00007.2014 • www.jn.org