Automatic portion estimation and visual refinement in mobile dietary assessment Insoo Wooa , Karl Otsmoa , SungYe Kima , David S. Eberta , Edward J. Delpa , Carol J. Bousheyb a School
of Electrical and Computer Engineering of Foods and Nutrient Purdue University, West Lafayette, Indiana USA b Department
ABSTRACT As concern for obesity grows, the need for automated and accurate methods to monitor nutrient intake becomes essential as dietary intake provides a valuable basis for managing dietary imbalance. Moreover, as mobile devices with built-in cameras have become ubiquitous, one potential means of monitoring dietary intake is photographing meals using mobile devices and having an automatic estimate of the nutrient contents returned. One of the challenging problems of the image-based dietary assessment is the accurate estimation of food portion size from a photograph taken with a mobile digital camera. In this work, we describe a method to automatically calculate portion size of a variety of foods through volume estimation using an image. These “portion volumes” utilize camera parameter estimation and model reconstruction to determine the volume of food items, from which nutritional content is then extrapolated. In this paper, we describe our initial results of accuracy evaluation using real and simulated meal images and demonstrate the potential of our approach. Keywords: single view reconstruction, food volume estimation, dietary assessment, mobile devices
1. INTRODUCTION Obesity increases the risk of premature death and raises health-care costs. Therefore, the increasing cases of obesity has become a significant social issue.1, 2 Education programs for obesity prevention have been developed to inform the effect of being overweight on health problems and to encourage healthy eating patterns.3 Dietary assessment methods have been improved since they produce valuable information needed for assessment and hypothesis generation regarding dietary imbalance.4 Based on such development, accurate methods to monitor nutrient intake from free-living environment have become indispensable to analyze people’s eating patterns and manage their dietary imbalance. Such methods should objectively and consistently record and collect nutrient intake. However, traditional paper-based self-reported methods may not be accurate since the information is recorded by subjective estimation. As such, computer-aided methods were proposed to facilitate the recording process by providing web-based user interfaces and effective food search methods.5, 6 However, these methods do not record in situ5 and require collaboration with food and nutrient experts.6 Meanwhile, mobile devices with improved technical capabilities have started being considered as a means to simplify the self-monitoring process and increase the computational accuracy of nutrient intake.7 Surveys have shown that technology-assisted logging techniques are perceived as less intrusive upon lifestyle than traditional methods for recording dietary intake.8 Moreover, built-in cameras on mobile devices provide a convenient means to collect meal images. Automated image-based nutrient analysis is challenging due to food classification and portion estimation.9 Most image-based nutrient analysis methods have focused on food identification and classification,10 whereas little research has been done on automatic volume estimation because of the difficulty of obtaining accurate volume estimates from a single image. In this work, we propose food portion size estimation through 3D volume reconstruction from a single meal image and evaluate the accuracy of our approach using real-world and synthesized images. This work was sponsored grants from the National Institutes of Health under grants NIDDK 1R01DK073711-01A1 and NCI 1U01CA130784-01. Address all correspondence to David S. Ebert,
[email protected] or see www.tadaproject.org
2. RELATED WORK 3D reconstruction, especially from a single image, has been one of the main issues in computer vision literature. Our food portion estimation is related to two research areas: camera calibration, which computes camera parameters, and volume reconstruction, which is utilized to obtain volume estimates. Camera parameters can be obtained from either predefined camera settings or computational methods. Koc11 and Khojastehnazhand et al.12 used a camera with a fixed position to estimate volumes of fruits such as a watermelon and an orange. Computational methods utilize specified geometrical information (e.g. pairs of orthogonal line segments) or fiducial markers within an image. To compute camera parameters, scene constraints, such as linear constraints, were used under assumption that there are one or more pairs of mutually orthogonal line segments.13–15 Theses linear constraints were obtained either automatically or manually. However, such linear constraints may not be easily extracted in meal images. Therefore, our dietary assessment system uses fiducial markers to facilitate the camera calibration process. Traditionally, sphere objects16, 17 and checkerboard patterns18 have been used as the fiducial markers. In this work, we use a checkerboard pattern marker. 3D object reconstruction from the 2D image space, in computer vision, requires some inputs (e.g., shading and geometrical constraints) to unproject the projected object. Shading information has been considered as information to reconstruct the 3D volume. Zeng et al.19 proposed interactive methods with a few constraints including surface normals to distinguish peaks from other surface points and estimate surfaces with detected peaks and saddle points. However, these techniques assumed that a scene object consists of Lambertian surfaces and is placed orthographically.19, 20 When dealing with food objects, the shading information cannot be always utilized for volume inflation since all the foods do not always satisfy these assumptions. Other approaches allow users to specify scene constraints to reconstruct a more accurate 3D volume. Prasad et al.21 employed user-selected contours to reconstruct curved surfaces, such as donuts and bananas. Oswald et al.22 allowed the users to specify exterior, interior, and creases as object constraints. However, these user guided approaches require many user interactions to reconstruct all the food items in a single view image. As an automated method for 3D object reconstruction, Hoiem et al.13 proposed a statistical model for geometrical classes (e.g., sky and ground), which are determined based on object color, texture, location, shape, and 3D geometry information. More specifically, there has been research on accurate volume estimation for food items as target objects. Koc11 proposed a method for computing volume estimates for watermelons using ellipsoid approximation. Khojastehnazhand et al.12 proposed a machine vision system which consists of two CCD cameras. However, these systems operate under specific conditions, such as a fixed camera position or a particular food item (e.g., watermelons and oranges) that is placed in a predetermined position (e.g., directly below the camera).
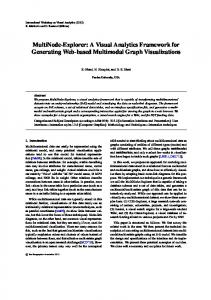
3. 3D FOOD VOLUME RECONSTRUCTION Our volume estimation consists of a camera calibration step and a 3D volume reconstruction step. Figure 1 illustrates our food volume estimation process. We use two images as inputs; one is a meal image taken by the user, and the other is the segmented region of a food item in the original image. This segmented region can be generated using common segmentation algorithms from the image processing field. As this image segmentation is not our main focus for volume estimation, we either use the segmentation results from Zhu et al.9 or let the user manually segment the food images. The camera calibration step computes camera parameters, comprised of intrinsic parameters (distortion, the principal point, and focal length) and extrinsic parameters (camera translation and orientation). As shown in Figure 1, we employ a fiducial marker in every meal image as a reference for the scale and pose of the food item identified. Our system for volume estimation partitions the space of objects into “geometric classes,” each with their own set of parameters. Feature points are extracted from the segmented region image and unprojected into the 3D space. A 3D volume is reconstructed by the unprojected points based on the parameters of the geometric class. In this work, we describe volume estimation methods for both spherical and prismatic shapes. Once the volume estimate for a food item is computed, the nutrient intake consumed is derived from the estimate based on the USDA Food and Nutrient Database for Dietary Studies (FNDDS).23
3.1 Camera Calibration The key aspect of our approach is to extract the geometry information in 3D world coordinates from a single view image. To obtain coordinates in the 3D world space, we need to know the camera parameters. Moreover, our estimation method should compute not relatively quantized estimates but actual estimates to calculate the nutrient information actually consumed by
Figure 1. Process of our food portion estimation. (The segmented region for the orange is obtained by Zhu et al.9 )
the user. Having a reference in an image solves this problem. Therefore, we have a fiducial marker included in every meal image for the scale and pose of the estimation subject. Experiment participants have expressed willingness to carry a credit card size fiducial marker with them. The fiducial checkerboard marker is easily identified and camera parameters are obtained by using existing open source software such as OpenCV.24 It is often possible to retrieve the focal length from the meta-data embedded in the JPEG images in what is known as the EXIF (EXchangeable Image File format) tag. The field of view of a camera is computed by Equation 1.
α = 2 × atan(
d ), 2f
(1)
where α is the field of view, d is the image width or the image height, and f is the focal length. Extrinsic camera parameters are determined by the obtained reference points and intrinsic parameters. The camera matrix P is decomposed into the product of intrinsic parameter and matrix K and the rotation matrix R augmented with translation vector t. P = K[R|t]
(2)
Given K, a set of extrinsic parameters may be computed that minimizes the total back-projection error, given by the formula n
− →
∑ d(xi , P Xi )2 ,
(3)
i=1
→ − where d is the Euclidean distance between the image feature points xi and the corresponding projected world point Xi . We use OpenCV functions to obtain the translation and rotation of a camera.
3.2 Spherical approximation model Our spherical approximation model is inspired by Dandelin spheres to recover the radius and position of a sphere from single view. One key to recovering sphere parameters is that the sphere is tangent to the ground plane. A diagram of the scene and relevant terminology is shown in Figure 2 (a). The method for fixing the position makes use of a particular arrangement of two spheres, a cone, and a plane, known as Dandelin spheres. The intersection of a plane and a cone forms an elliptical conic section. Of interest to us is the upper sphere. Dandelin’s theorem25 states that the point at which the sphere touches the plane is the focus of the conic section. As the diagram shows, the bounding cone formed by the camera center and world sphere is cut by two different planes: the image plane and the table plane. Each plane cuts a conic section from the cone. These conics are instrumental in determining the sphere’s position and radius. The ellipse on the table surface could be interpreted as the shadow of the sphere, treating the camera center as a light source. The sphere’s position on the table can be given in two dimensional coordinates, relative to the coordinate system imposed on the surface by the calibration pattern.
(a) Scene diagram for sphere positioning.
(b) A cut view for sphere radius estimation.
Figure 2. Spherical approximation conceptual model. (a) shows the scene diagram to compute the position of a sphere and (b) does the cut view to compute the radius of a sphere using Heron’s formula.
Calculating Sphere Position: Feature points from the elliptical region in the screen space are projected onto the table plane. We reorient the resulting points to a two-dimensional plane to find ellipse parameters. This is achieved by first applying the translation vector, followed by the inverse of the rotation matrix, which yields coordinate triples with negligible z-values. The ellipse of the shadow area is usually more elongated than that of the apparent contour. The ellipse parameters for the shadow area are recovered by calculating the ellipse that fits best in a least square sense to the contour points. The parameters computed are utilized to calculate the offset of the foci from the ellipse center along the major axis as Equation 4. The formula for ellipse foci naturally has two solutions ( f1 , f2 ). q 2 − d2 , (4) f1,2 = ± dma j min where dma j and dmin are the lengths of the semi-major and semi-minor axes, respectively. We choose the one whose distance is closer to the camera. The selection of the closer point may fail when camera is directly above the spherical objects. However, this will not occur as we have the user take meal pictures within 30 to 60 degree of the angle between the table plane and the camera. Calculating Sphere Radius: Under perspective projection, the circumference of the apparent contour of a sphere is smaller than that of the sphere’s great circle - the circle that cuts the sphere into two equal halves and shares its center. Thus, it is somewhat more difficult to calculate a radius with a perspective camera than under orthogonal projection. We employ Heron’s formula,26 which produces the area of a triangle given the lengths a, b, and c of each side: p (5) Areatriangle = k(k − a)(k − b)(k − c), where the semiperimeter of the triangle k = 21 (a + b + c). The radius of a circle inscribed in this triangle is simply computed by Equation 6. r=
Areatriangle k
(6)
Figure 2 (b) illustrates the concept for the radius computation. This circle inscription is known as an incircle, and its radius is known as the inradius of the triangle.27 To employ the inradius formula, we search for two scene points (v2, v3) that, in addition to the camera center (v1), form a tangential triangle that cuts through the sphere at its great circle. The radius of the resulting circular cross-section is also the radius (r) of the sphere. We observe that the perspective distortion that stretches a circle into an ellipse is directed away from the principal axis of the camera. Therefore, we use the extrema
(a)
(b)
(c)
(d)
Figure 3. Volume reconstruction of scrambled eggs using our prismatic approximation model; (a) an input meal image, (b) feature points extracted (the segmented area for the scrambled eggs were manually obtained), (c) a base plane constructed using the feature points, and (d) the food volume shape for the scrambled eggs.
along the major axis of the projected ellipse (on the table). The triangle, formed by the two axis points and the camera center, cuts through the center of the sphere. Any spherical cross section that includes the sphere’s center also includes the diameter of the circle.
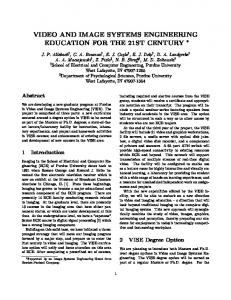
3.3 Prismatic approximation model To support general shapes of food items, we also develop a prismatic approximation model. We assume that the segmented region representing the food item corresponds exactly to the physical area upon which the food contacts the plate surface. This assumption is valid when the image is taken at a high angle, such that there are no self-occluding boundaries. Alternatively, the assumption is preserved for images acquired at a shallow (oblique) angle by manually supplying surface contact information, or automatic computation by symmetry cues. For each pixel on the boundary of a given segmented region, a vertex in the world space may be calculated as the intersection of backprojected screen rays with the table surface. Figure 3 illustrates the 3D volume construction of scrambled eggs using our prismatic approximation model. We obtain feature points on the boundary of a segmented region obtained from Zhu et al.’s image segmentation.9 Figure 3 (b) shows extracted feature points on the boundary of scrambled eggs. Since the planar shape constructed with the extracted points is not always convex, we triangulate the planar polygon using the Delaunay triangulation algorithm28 and sum all the areas of the obtained triangles to compute the area of the planar polygon. Finally, this area is manually extruded towards the tangential direction of the table surface to produce a volume of the food item.
3.4 Visual Refinement Interactive parameter adjustment enables the user to supply information that may be absent from the two-dimensional scene image with the implicit knowledge that they possess of the scene, as well as correct estimation errors in our reconstruction
(a)
(b)
(c)
Figure 4. User refinement. More accurate estimate is produced by translating and scaling the spherical volume. (a) shows the initial reconstructed sphere for the orange, (b) and (c) show the translated and scaled one, respectively. The initial estimated radius is 1.649934 inches (original: 1.45) and the final estimate is 1.5 inches.
algorithm. Our visual refinement allows the user to reposition the spherical estimator volume at any point tangent to the table surface and adjust the radius, as shown in Figure 4. The height of the prismatic estimator can be interactively adjusted with real-time feedback.
4. RESULTS AND DISCUSSION We have implemented the approach described in this paper on Linux PCs as well as Linux-based mobile platforms. We used the Nokia N810 Internet tablet, shown in Figure 5 (a), as a mobile device. Since the Nokia N810 does not support OpenGL|ES driver, we utilized MesaGL, gtkgl, and gtkglext on the device. The frame rate on the mobile device is 1 to 1.5 FPS (Frame Per Second). Since a background meal image is rendered using the non-hardware accelerated OpenGL driver, it deteriorated the total frame rate. However, this will not be a problem if our application runs on mobile devices (e.g., Nokia N900) with OpenGL|ES supported. For development and verification of our approach, we have created a testbed as shown in Figure 5 (b). All the result images were obtained using the testbed program. We performed validation experiments to verify the accuracy of the camera parameters that we obtained using a checkerboard fiducial marker and volume estimates for spherical and prismatic objects using synthesized as well as real-world images. Synthesized scenes were used since all the information (e.g., camera parameters, distance from a camera to the center of the fiducial marker and the position and radius of a spherical object) in the scene are accurately manageable. For real-world images, we measured the volume of each food item using the water displacement method and the camera information using a tripod and a ruler. A 4×5 inch fiducial marker was used and the size of all images for both real-world and synthetic scenes is 1280×960 pixels.
(a) Our volume estimation running on Nokia N810.
(b) Testbed to verify the accuracy of our camera calibration and volume estimation. Figure 5. Our mobile application and testbed program.
(a) Fruits.
(b) Jell-O.
(c) Brownie.
Figure 6. Source images for volume estimation experiment.
4.1 Camera parameters We assume that the origin of the world coordinate is the center of the fiducial marker. Since placing a fiducial marker next to the main dish is required and the height of camera position varies person by person, we varied the X coordinate and the Z coordinate (height) and fixed Y coordinate. The X values range from 0 to 5 inches, the Y values are fixed to 3 inches, and the Z values do from 25 to 30 inches. We also changed the camera angles to 30, 40, and 60 degrees. The value variation was also applied to synthesized scenes. Table 1 shows the result of this experiment. For real-world scenes, the camera position is measured consistently to within approximately one quarter inch, while angle measurement error is at about less than 5 degree. However, this error can likely be attributed to ground truth measurement error, as the estimation results for synthesized images demonstrate extremely high precision and accuracy. Table 1. The means and standard derivations for the camera calibration results for the real and synthesized images.
Mean Std.Dev
Real-world scenes Position estimation Angle estimation x y z total angle 0.06 0.3 0.13 0.35 3.36 0.04 0.15 0.09 0.13 1.62
Synthesized scenes Position estimation Angle estimation x y z total angle 0.02 0.01 0.08 0.08 0.07 0.01 0.01 0.06 0.06 0.09
4.2 Volume estimation We first used 7 food items (5 spherical and 2 prismatic objects) for the experiment for the accuracy of our volume estimation for both spherical and prismatic objects. No manual refinement for the spherical objects was performed in this experiment. Figure 6 shows some of images used for our experiment. The average error rates are summarized in Table 2. Estimated radii had good agreement with measured radii in the spherical trials, falling within 0.07 inches for every fruit in all but one instance, in which the nectarine (considered the least spherical of the fruits) was overestimated by 0.14 inches. Nectarine radii derived from cross-sectional areas were within 0.01 inches of the direct radius measurement, however, so the estimation error may be due partly to the choice of cross-section taken. The average volume error in the nectarine by the water displacement ground truth method (0.51%) was the lowest of all the fruits. However, by the radius method (7.17%), it was suprassed only by that of the plum (14.6%), for which there was fairly high disagreement between the two ground truth methods of obtaining volume estimates. The average error rate of volume estimates for oranges was smaller than those of the other spherical fruits as oranges were almost spherical objects. As shown in the experiment, it is often the case that the fruit deviates from the ideal spherical object. Hence, ellipsoid based approximation methods would be a better estimation. However, it is very challenging to extract the major diameter and minor diameter of a spherical object from a single view image in perspective projection. Whereas, volume estimation results on synthetic spheres were highly accurate, as ground truth values for volume are known exactly. Results for a series of generated images with arbitrarily chosen parameters are given in Table 3. As shown in Table 3, the absolute error in a radius estimation is less than 0.02 inch for radius ranging from 0.8 inch to 1.45 inch. For prismatic objects, as shown in Table 2, prismatic area and height were not as accurate with 10% volume error in the worst trial although the jell-O estimation fared well. The Brownie volume errors ranged from 6 to 14 percent as compared to the nominal volume. The error rates of the brownies were higher than those of the jell-Os. This was attributed from
Table 2. The error rates (%) for estimated and measured volumes.
Radius(in) Area (in2 ) Height(in) Volume(in3 ) by displacement Volume(in3 ) by radius measurement
Grapefruit 0.67 -
Apple 0.84 -
Nectarine 2.10 -
Orange 0.29 -
Plum 4.65 -
Jell-O 0.02 0.33 2.22
Brownie 0.02 1.25 11.52
Mean 1.71 0.79 6.87
Std.Dev. 1.78 0.65 6.57
7.38
0.84
0.51
2.10
17.55
-
-
5.68
7.19
1.95
2.46
7.17
0.86
14.60
2.03
10.45
5.65
5.25
Table 3. The means and standard deviations of the volume estimation results for the synthesized spherical objects.
Mean Std.Dev
radius 0.01 0.02
Absolute Error (inch) x y distance 0.02 0.03 0.03 0.02 0.04 0.05
angle 0.12 0.10
Relative Error (%) radius distance angle 1.02 0.94 0.29 1.47 1.50 0.18
the image segmentation since the boundary of the segmented regions for the brownies were not smooth. Our approach to reconstruct 3D objects depends on the performance of the image segmentation algorithm. Accurate image segmentation is an important base of our approach. We performed an experiment for analyzing the accuracy of gram weights computed with volume estimates, produced from our volume estimation process. We chose two food items, a garlic bread and a yellow cake, whose nutrient information the FNDDS contains, as shown in Figure 7. Table 4 shows the error rates between estimated and measured gram weights. Table 4. The error rates for calculated and measured mass.
Geometric classes
Food name
Prismatic
Garlic bread (a) Garlic bread (b) Yellow Cake (c) Yellow Cake (d)
Volume estimation 12.70 6.39 12.52 8.98
FNDDS derived density 3.9 3.9 8.1 8.1
Calculated mass(g) 49.53 24.91 101.47 72.75
Measured mass (g) 51.3 57.1 74.3 68
Error (%) 3.4 56.4 36.6 7.0
5. CONCLUSIONS AND FUTURE WORK In this work, we have demonstrated our approaches to volume estimation by reconstructing geometrical objects from the 2D image space into the 3D space. We had a checkerboard pattern fiducial marker included in each meal image to obtain camera parameters and provide a reference for the object scale of each food item. We have focused on spherical objects and prismatic objects among geometric classes. We obtained camera parameters and the segmented region of each food item, extracted feature points in the image spaces and unprojected the feature points into the 3D space. We reconstructed spherical objects based on the concept of Dandelin sphere and prismatic objects with the height value adjusted. We have performed experiments for camera calibration and volume estimation using both real-world and synthesized images to evaluate our approach. Volume estimation for spherical objects achieved high accuracy with no user refinement for both real and synthesized scenes, whereas that for prismatic objects worked successfully with user refinement. The experimental results showed the potential of our approach to the volume estimation. For future work, we will develop more geometric classes to support self-monitoring in free-living life. For example, spaghetti is a difficult example for volume estimation as the surface is not planar and its volume is not dense. Descriptive models for geometric classes can be a useful approach to reconstructing a variety of food items. We plan to investigate non-parametric approaches22, 29 which require reasonable amount of user-specified constraints (e.g., local discontinuities, face normals, heights, or planar regions) for 3D object reconstruction from single image. The investigation will be a basis to define food specific shape templates since it helps us determine which information should be stored in the templates and how to describe the templates for food items based on the result from the investigation of user-specified constraints. However, this does not indicate that our approach will have strong assumption about geometry. Instead, this will remove or reduce user interactions and also provide consistent methods to reconstruct the 3D volume of each food item. We will also
(a)
(b)
(c)
(d)
Figure 7. Sample meal images for gram weight computation. (a) and (b) is the sample meal images including a garlic bread, (c) and (d) is the sample ones including a yellow cake.
perform research on the color and shape, including 3D shape, of the fiducial markers and robust detection algorithm for the markers. Furthermore, we will design convenient user interfaces for the user refinement on a variety of mobile devices to overcome the limitation of the screen size of mobiles devices.
REFERENCES [1] Ogden, C. L., Flegal, K. M., Carroll, M. D., and Johnson, C. L., “Prevalence and trends in overweight among us children and adolescents, 1999-2000,” JAMA: The Journal of the American Medical Association 288, 1728–32 (Oct. 2002). [2] Ogden, C. L., Carroll, M. D., Curtin, L. R., McDowell, M. A., Tabak, C. J., and Flegal, K. M., “Prevalence of overweight and obesity in the united states, 1999-2004,” JAMA: the journal of the American Medical Association 295, 1549–55 (Apr. 2006). [3] [The Surgeon General’s call to action to prevent and decrease obesity], Washington DC: U.S. Department of Health and Human Services, Public Health Service, Office of the Surgeon General. [4] Taren, D., Dwyer, J., Freedman, L., and Solomons, N. W., “Dietary assessment methods: where do we go from here?,” Public Health Nutrient , 1001–1003 (2002). [5] ”Diet history questionnaire: web-based DHQ. (2007). National Cancel Institute,http://www.ars.usda.gov/ services/docs.htm?docid=7673(accessed 11 December 2009)”.
[6] Goldberg, H. I., Ralston, J. D., Hirsch, I. B., Hoath, J. I., and Ahmed, K. I., “Using an internet comanagement module to improve the quality of chronic disease care,” Joint Commission journal on quality and safety 29, 443–451 (Sept. 2003). [7] Glanz, K., Murphy, S., Moylan, J., Evensen, D., and Curb, J. D., “Improving dietary self-monitoring and adherence with hand-held computers: A pilot study,” American Journal of Health Promotion (2006). [8] Boushey, C. J., “Improving diet and physical activity assessment (r01),” (2005). [9] Zhu, F., Mariappan, A., Boushey, C. J., Kerr, D. A., Lutes, K., Ebert, D. S., and Delp, E. J., “Technology-assisted dietary assessment,” Proceedings of the IS&T/SPIE Conference on Computational Imaging VI , 681411–681411–10 (Jan. 2008). [10] Yang, L., Zheng, N., Cheng, H., Fernstrom, J. D., Sun, M., and Yang, J., “Automatic dietary assessment from fast food categorization,” Proceedings of the IEEE 34th Annual Northeast Bioengineering Conference (2008). [11] Koc, A. B., “Determination of watermelon volume using ellipsoid approximation and image processing,” Postharvest Biology and Technology 45, 366–371 (September 2007). [12] Khojastehnazhand, M., Omid, M., and Tabatabaeefar, A., “Determination of orange volume and surface area using image processing technique,” International Agrophysics 23(3), 237–242 (2009). [13] Hoiem, D., Efros, A. A., and Hebert, M., “Automatic photo pop-up,” in ACM SIGGRAPH , 577–584 (2005). [14] Criminisi, A., “Single-view metrology: Algorithms and applications,” Proceedings of the 24th DAGM Symposium on Pattern Recognition , 224–239, Springer-Verlag, London, UK (2002). [15] Wang, G., Hu, Z., Wu, F., and Tsui, H.-T., “Single view metrology from scene constraints,” Image and Vision Computing 23(9), 831 – 840 (2005). [16] Zhang, H., Wong, K.-Y. K., and Zhang, G., “Camera calibration from images of spheres,” IEEE Transactions on Pattern Analysis and Machine Intelligence 29(3), 499–502 (2007). [17] Ying, X. and Zha, H., “A novel linear approach to camera calibration from sphere images,” Pattern Recognition, International Conference on 1, 535–538 (2006). [18] Yu, C. and Peng, Q., “Robust recognition of checkerboard pattern for camera calibration,” Optical Engineering 45(9) (2006). [19] Zeng, G., Matsushita, Y., Quan, L., and Shum, H.-Y., “Interactive shape from shading,” Computer Vision and Pattern Recognition, 2005. CVPR 2005. IEEE Computer Society Conference on 1, 343–350 vol. 1 (June 2005). [20] Zhang, R., Tsai, P.-S., Cryer, J., and Shah, M., “Shape-from-shading: a survey,” Pattern Analysis and Machine Intelligence, IEEE Transactions on 21, 690–706 (Aug 1999). [21] Prasad, M. and Fitzgibbon, A., “Single view reconstruction of curved surfaces,” Computer Vision and Pattern Recognition, IEEE Computer Society Conference on 2, 1345–1354 (2006). [22] Oswald, M. R., T¨oppe, E., Kolev, K., and Cremers, D., “Non-parametric single view reconstruction of curved objects using convex optimization,” Proceedings of the 31st DAGM Symposium on Pattern Recognition , 171–180, SpringerVerlag, Berlin, Heidelberg (2009). [23] ”The Food and Nutrient Database for Dietary Studies. http://www.ars.usda.gov/services/docs. htm?docid=7673(accessed 11 December 2009)”. [24] Bradski, G. R. and Kaehler, A., [Learning OpenCV: Computer Vision with the OpenCV Library], O’Reilly (September 2008). [25] Ogilvy, C. S., [‘The Conic Sections.’ Ch. 6 in Excursions in Geometry], Courier Dover Publications (1990). [26] Dunham, W., [‘Heron’s Formula for Triangular Area.’ Ch. 5 in Journey through Genius: The Great Theorems of Mathematics ], Wiley, New York (1990). [27] Kimberling, C., “Triangle centers and central triangles,” Congressus Numerantium 129 (1998). [28] Guibas, L. and Stolfi, J., “Primitives for the manipulation of general subdivisions and the computation of voronoi,” ACM Trans. Graph. 4(2), 74–123 (1985). [29] Ting, Z., Feng, D. D., and Zheng, T., “3d reconstruction of single picture,” VIP ’05: Proceedings of the Pan-Sydney area workshop on Visual information processing , 83–86, Australian Computer Society, Inc., Darlinghurst, Australia, Australia (2004).