Automatic Retinal vessel classification using a Least SquareSupport Vector Machine in VAMPIRE* D. Relan, T. MacGillivray, L. Ballerini, and E. Trucco
Abstract— It is important to classify retinal blood vessels into arterioles and venules for computerised analysis of the vasculature and to aid discovery of disease biomarkers. For instance, zone B is the standardised region of a retinal image utilised for the measurement of the arteriole to venule width ratio (AVR), a parameter indicative of microvascular health and systemic disease. We introduce a Least Square-Support Vector Machine (LS-SVM) classifier for the first time (to the best of our knowledge) to label automatically arterioles and venules. We use only 4 image features and consider vessels inside zone B (802 vessels from 70 fundus camera images) and in an extended zone (1,207 vessels, 70 fundus camera images). We achieve an accuracy of 94.88% and 93.96% in zone B and the extended zone, respectively, with a training set of 10 images and a testing set of 60 images. With a smaller training set of only 5 images and the same testing set we achieve an accuracy of 94.16% and 93.95%, respectively. This experiment was repeated five times by randomly choosing 10 and 5 images for the training set. Mean classification accuracy are close to the above mentioned result. We conclude that the performance of our system is very promising and outperforms most recently reported systems. Our approach requires smaller training data sets compared to others but still results in a similar or higher classification rate.
I. INTRODUCTION Retinal blood vessels observed with fundus imaging provide important indicators not only for clinical diagnosis and treatment of eye diseases but also for systemic diseases such as diabetes and hypertension which manifest themselves in the retina [1-4]. Quantitative structural analysis of the retinal vasculature helps in the diagnosis of retinopathies as well as providing candidate biomarkers of these systemic diseases. Crucially, the vasculature changes that appear during the onset of disease can affect arterioles and venules differently, and thus in (semi-) automatic retinal image analysis conclusion is drawn from the quantification of venular and arteriolar components distinctly. For instance, measuring the central retrial arterial equivalent (CRAE) and the central retrial venular equivalent (CRVE), which are used to calculate the arteriolar to venular width ratio (AVR) [2]. This forms an essential part of VAMPIRE (Vasculature Assessment and Measurement Platform for Images of the REtina) [5].
*Research partially supported by Leverhulme trust grant RPG-419. D. Relan is with the Clinical Research Imaging Centre, University of Edinburgh, U.K. (e-mail:
[email protected] ). T. MacGillivray is with Clinical Research Imaging Centre, University of Edinburgh, U.K. and Wellcome Trust Clinical Research Facility, University of Edinburgh, U.K. (e-mail:
[email protected] ). L. Ballerini and E. Trucco are with School of Computing, University of Dundee, U.K. (e-mail:
[email protected],
[email protected]).
978-1-4244-7929-0/14/$26.00 ©2014 IEEE
Developments in image processing and automated diagnostic systems offer great potential for retinal fundus imaging to be used in large-scale screening programmes and biomarker discovery studies, with significant resource savings and freedom from observer bias [6]. Conventionally, AVR and other measurements of retinal vascular parameters are drawn from zone B - an annulus 0.5 to 1 optic disc (OD) diameter from the OD boundary [3, 4, 7]. However, measurements from outside this zone might also lead to candidate biomarkers of disease. For instance, Cheung et al. studied the association of blood pressure with retinal vascular calibre measured over the standard zone B and an extended zone of the fundus images [8]. They found that reliability of retinal vascular caliber measurement was high for the extended zone. Moreover, cardiovascular risk factors explained to a greater degree the variation in retinal vascular caliber in the extended zone. Hence, we extend our previous work on vessel classification [9] and propose a supervised Least Square-Support Vector Machine (LS-SVM) classifier [10] for the first time (to the best of our knowledge) for automatic retinal vessel classification. We classify the vessel in zone B and an extended zone using 4 fixed features frequently chosen or selected automatically as discriminative features for vessel classification [11] II. RELATED WORK Several authors reported supervised vessel classification algorithms [12-19], which require substantial volumes of clinical annotations (i.e. manual classification of vessels into arterioles and venules) to generate a reliable classifier. In [12], 20 colour fundus images from the DRIVE database were used for training and testing. A set of 24 features was extracted from each centreline pixel. Feature selection using a wrapper based method, sequential forward floating selection, was employed to find the best feature. The authors tested several different classifiers - Linear Discriminant Analysis (LDA), Quadratic Discriminant Analysis (QDA), Support Vector Machine (SVM) and k-Nearest Neighbor (kNN) classifier - on the training data and found that the kNN classifier provided the best overall performance (area under the ROC curve 0.88). The same authors [13] used the INSPIRE-AVR data set to classify vessels in zone B with 27 features, and the best result was achieved with LDA (area under ROC 0.84). Narasimha-Iyer et al. [14] tested four different classifiers namely: Nearest Neighbor, 5 Nearest Neighbor, Fisher Linear discriminant (FLD) and a SVM classifier; the latter gave the best result. Their proposed algorithm achieved true positive rates of 97% for the arterioles and 90% for the venules, when applied to a set of 251 vessel segments
142
obtained from 25 dual wave-length images. They suggested that their method is independent of the location of the retina being imaged and can work on vessels from any retinal regions. Zamperini et al. [15] classified a total of 656 points (326 labelled as arterioles and 330 as venules) from 42 images in zone B. They performed a greedy backward feature selection on a set of 86 features and found the best result using a reduced set of 16 features. They experimented with different linear and nonlinear classifiers (Linear and Quadratic Normal Bayes, Parzen Classifier, Linear and radial basis SVM). The best classification accuracy of 93.1% was obtained with the Linear Bayes normal classifier. Muramatsu et al. [16] classified 160 vessels from 40 DRIVE images in zone B using a LDA classifier and leave1-out method with 6 features. This resulted in 92.8% classification accuracy. In another study [17], authors investigated two methods for feature extraction (ROI and profile based) and two for classification (Neural Network (NN) and SVM). Multiclass Principal Component Analysis (PCA) was used by the authors in their experiments to reduce the dimensionality of the feature vector for subsequent use in the classifier. They showed that performance of both NN and SVMs was extremely good on hand-segmented data, but the results deteriorate by about 10% on automatically segmented images. Also, after including meta-knowledge about vessel segments between crossings they were are able to classify 95.32% of the vessel centre lines correctly by combining the ROI feature vector composition method with a NN classifier. Mirsharif et al. [18] performed supervised classification and evaluated the performance of their proposed method on two different datasets viz. DRIVE (40 retinal images) and their own dataset (13 retinal images). They used forward feature selection to find the most discriminant features for training the classifier (Kmeans, fuzzy clustering, SVM and LDA). Their proposed method resulted in 90.2% and 88.2% accuracy for DRIVE and their own datasets, respectively. Recently a combination of graph-based classification with feature selection using LDA was proposed by Dashtbozorg et al. [19]. The method resulted in accuracy values of 88.3%, 87.4% and 89.8% with the INSPIRE-AVR (40 images), DRIVE (20 images) and VICAVR (58 images) databases, respectively, on all vessels pixels in entire images. In our previous work [9], we demonstrated 92% classification with 13.5% unclassified vessels using an unsupervised Gaussian Mixture Model, an ExpectationMaximization (GMM-EM) classifier and with quadrant pair wise approach on 406 vessels from 35 images using fixed 4 features in zone B. We repeated the experiment on a further 35 images giving 70 images in total, with 802 vessels resulting in 90.45% correct classification and with 13.8% unclassified (see Table 1). In this paper we propose a LS-SVM supervised method to classify the vessel in both zone B and an extended zone with 4 fixed features frequently chosen or selected automatically as discriminative features for vessel classification [11].
III. METHODOLOGY A. Materials Seventy colour fundus images with resolution of 2048×3072 pixels, captured with a Canon CR-DGi nonmydriatic retinal camera with 45o field of view, were analysed in this study. The images were selected at random from a large database of non-mydriatic fundus images from the Orkney Complex Disease Study (ORCADES, www.orcades.ed.ac.uk). ORCADES is a genetic epidemiology study based on an isolated population in the north of Scotland. It aims to discover the genes and their variants which influence the risk of common, complex diseases. All images were labelled by two observers (authors DR and TM) to generate ground truth. Observer 1 (DR) is a doctoral student (less experienced, ~2 year); observer 2 (TM) is an imaging scientist and specialist of retinal image analysis (more experienced, > 12 years). Both observers were individually and independently trained by experienced clinicians in the identification of the retinal vessel type. B. Image pre-processing and vessel extraction The presence of inter- and intra-image contrast, luminosity and colour variability affect classification performance. Thus, we first compensated for background illumination in red, green and hue channels using Chrástek’s method [20]. The Hue channel was also pre-processed to improve the contrast of vessels against background before illumination correction by mapping the original intensity values such that values between 0.01 and 0.8 map to values between 0 and 1. The illumination-corrected images were then processed to extract colour intensity features from vessel centreline pixels.
I
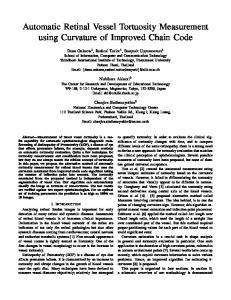
II 1.75OD 1 OD
Zone B
IV
III
Figure 1. Specifying zones for vessel classiifcation arround OD.
Centreline pixels of vessels in zone B were extracted as previously reported [9]. To extract vessels in the extended zone a binary vessel map was first generated using VAMPIRE [5]. The image was then divided into four quadrants by locating the OD and its approximate diameter (d) [21]. If the OD was on the right side of the fundus image then the zone from OD margin to 1.75d was specified in quadrant I and IV (see fig. 1). Whereas in quadrant II and III
143
specified zones were from OD margin to 1d (Fig. 1). If the OD was on the left side of the fundus image then the zone from OD margin to 1.75d was specified in quadrant II and III, but in quadrant I and IV the classification zone was specified from OD margin to 1d. The size of the classification zone is dictated by the fact that vessels lose contrast towards the extremities of the image and this leads to problems with segmentation and misclassification. After specifying the zone, all the detectable vessels were extracted.
respectively). Thus, we determined that our system shows very good results even with a small set of only 5 training images (and with less training time - approximately 4.5 and 1.3 seconds in extended zone and zone B respectively. TABLE I.
Extended Zone
C
Un
C
Un
LS-SVM Exp10
94.88%
0.58%
93.96%
0.29%
LS-SVM Exp5
94.16%
0.29%
93.95%
0.48%
GMM-EM [9]
90.45%
13.8%
84.74%
13.44%
TABLE II. CLASSIFICATION PERFORMANCE PARAMETERS IN EXTENDED ZONE USING LS-SVM CLASSIFIER WITH 10 TRAINING DATA AND 60 TESTING DATA
C. Feature extraction After vessels selection, four colour features - mean of red (MR), mean of green (MG), mean of hue (MH) and variance of red (VR) - were extracted from the illumination corrected channels from a circular neighbourhood around each centreline pixel, with diameter 60% of the mean vessel diameter. This gives a feature vector F= [MG MR VR MH] represented by a 4×N matrix, where N is the number of pixels. Pixels each with the set of four colour features (F) were then classified using LS-SVM [10]. LS-SVM was trained using labels generated by observer 1. The classifier labels each pixel as either arteriole or venule. Thereafter, labels were counted for all pixels in a vessel, and the maximum vote was assigned to the vessel status. If the vote was tied the vessel was marked not labelled.
Performance Measure Sensitivity Specificity Positive Predicted value Negative Predicted value Positive Likelihood Ratio Negative Likelihood Ratio Classification Accuracy Classification Error rate
TABLE III.
LV_SVM Classifier Exp10
IV. RESULTS
Exp5
The same experiment was repeated five times, choosing 10 and 5 training set randomly from the set of 70 images. With a training set of 10 images a mean (and standard deviation) classification accuracy of 94.04% (0.93%) and 94.31% (0.83%) was achieved in zone B and the extended zone, respectively. For a training set of 5 images, the mean classification accuracy was 94% (~1%) for both zones. The mean classification results are very close to the results mentioned in Table I. Increasing the number of training images to 15 or 20 gave very similar results but with longer training time (approximately 160 and 3681 seconds,
Zone B
Classifier
Finally, only those vessels whose width is at least 55% of maximum width of the vessels in a pair of quadrants and whose length is at least 15 pixels were considered. The 15 pixel and 55% criteria were arrived at experimentally. If no vessels satisfied the conditions, i.e. if no vessels were selected in a particular quadrant, then the vessel with maximum width in that particular quadrant was selected.
A. Experimental results We used a total of 802 vessels in zone B and 1,207 vessels in the extended zone from 70 colour fundus. The classification was performed with a training set of 5 (Exp5) and 10 images (Exp10), and keeping a testing set of 60 images same in both experiments. Table I summarizes the results (where C is the percentage of correctly classified vessels and Un stands for the unclassified vessels, both w.r.t observer 1). The result is slightly higher with observer 2. The classification rates obtained with Exp10 and Exp5 are almost same for both zone B and the extended zone. Also, the performance of LS-SVM is better than that of the unsupervised classifier GMM-EM [9].
CLASSIFICATION RATE
Arterioles 0.9689 0.9142 0.9087 0.9709 11.2975 0.0340 0.9399 0.0601
Venules 0.9088 0.9689 0.9708 0.9035 29.2620 0.0942 0.9370 0.0630
TRUE POSITIVE RATE FOR ARTERIOLES AND VENULES USING LS-SVM CLASSIFIER TRUE Positive Rate Zone B Extended Zone Arterioles Venules Arterioles Venules 97.87% 90.06% 96.89% 90.88% 95.47%
91.99%
95.44%
91.79%
The performance measures, as described in [9], were applied separately for arterioles and venules (w.r.t observer 1’s labels) for classification performed with LS-SVM for Exp10 (see Table II). Sensitivity was 0.969 for arterioles and 0.908 for venules in extended zone, i.e. the probability of incorrect classification was 3.1% for arterioles and 9.1% for venules. Likelihood ratios (Table II) were also high and confirmed the high reliability of our proposed system. The classification accuracy for both arterioles and venules was high. The classification accuracy obtained with Exp5 in the extended zone for arterioles and venules was 93.7% and 93.8%, respectively (data not shown), which is almost same as that obtained with Exp10 (Table II). An additional experiment was conducted to assess the system performance when training the classifier with 5 and 10 images with vessels in the extended zone and then testing on vessels in zone B from 60 images. The result was a classification rate of 93.7% which is slightly less than when the system was trained with data in zone B. In order to validate the performance of our system we also tested in the zone B of the DRIVE dataset with 20 images in each of the training and testing sets. Classification
144
was performed on 171 vessels extracted in similar manner as explained in [9] resulting in classification rate of 89.4%.
REFERENCES [1]
V. DISCUSSION AND CONCLUSION
[2]
Extracting large numbers of features for selecting discriminant features, and generating large training data sets for supervised classification is time consuming. We have proposed the use of the LS-SVM supervised classifier. Results were very good when only four features were used to train a small set of training data. Our system shows a high classification rate even with 5 randomly selected training images as compared to the results reported in [12] [13] [16] [18] which use 20 training images. Our system has high classification accuracy and low classification error rate for both venules and arterioles. Correct classification rates are higher than those reported in [12, 13, 15, 16 18, 19], although direct comparisons of results obtained with different data sets must be taken carefully. The resolution of our images (2048×3072) is greater than that of DRIVE dataset (768 × 584). Though when we performed classification on the DRIVE dataset the classification rate was similar to previously reported results Dashtbozorg et al.[19](87.4%), Mirsharif et al. [18] (90.2%) and M. Niemeijer et al [12] (ROC curve 0.88). The result obtained by our method in zone B is higher than that reported in [13] [15] [16] and [18]. Moreover our true positive rates for both arterioles and venules (Table III) are comparable with the method proposed in [14] for 251 vessel segments. SVM has been widely used in classification [12-15, 17, 18] but the major drawback is its higher computational burden for the constrained optimization programming. This disadvantage has been overcome by least squares support vector machines (LS-SVM), which solves linear equations instead of a quadratic programming problem. Also the solution procedure of LS-SVM is highly efficient [22]. We conclude that the performance of our system is very promising and outperforms most recently reported systems. Our method requires smaller training data sets compared to others recently reported work yet results in a similar or higher classification rate. However, the classification accuracy may differ with different datasets and results are dependent on segmentation (locating centerline pixels). Moreover, choosing a different retinal zone, classifier and framework would likely impact on the classification performance. Additional training would likely be required to handle different ethnicity in the same database. Further tests on large, structured data sets, ideally public, are needed to assess comparatively and reliably classification algorithms.
[3] [4] [5] [6] [7] [8] [9] [10] [11] [12] [13] [14]
[15] [16]
[17] [18] [19] [20] [21] [22]
ACKNOWLEDGMENT This work is supported by Leverhulme Trust grant RPG419 “Discovery of retinal biomarkers for genetics with large cross-linked datasets”, and part of the VAMPIRE project [5]. We thank Dr. Jim Wilson, University of Edinburgh, for making the ORCADES images available.
145
M. D. Abràmoff, et al., “Retinal imaging and image analysis,” IEEE Reviews in Biomedical Engineering, vol. 3, pp.169–208, 2010. T. Y. Wong, M. D. Knudtson, et al, “Computer-assisted measurement of retinal vessel diameters in the Beaver Dam Eye Study: methodology, correlation between eyes, and effect of refractive errors,” American Academy of Ophthalmology, pp. 1183–90, 2004 H. Li et al., “Automatic grading of retinal vessel calibre,” IEEE Transactions on Biomedical Engineering, vol. 52, pp.1352-5, 2005. M. K. Ikram, et al., “Retinal vessel diameters and risk of hypertension: the Rotterdam Study,” Hypertension: Journal of the American Heart Association, vol. 47(2), pp.189–94, 2006. A. Perez-Rovira, et al. “Vampire: Vessel assessment and measurement platform for images of the retina,” in Proc. IEEE Engineering in Medicine and Biology Society, 2011, pp. 3391–3394 N. Patton, T. M. Aslam, T. MacGillivray et al., “Retinal image analysis: concepts, applications and potential,” Progress in Retinal and Eye Research, vol. 25(1), pp. 99–127, 2006. H. Leung et al., “Relationships between Age, Blood Pressure, and Retinal Vessel Diameters in an Older Population,” Investigative Ophthalmology & Visual Science, vol. 44(7), pp. 2900–2904, 2003. C.Y. Cheung, W. Hsu et al., “A new method to measure peripheral retinal vascular calibre over an extended area,” Microcirculation, vol. 17(7), 495–503, 2010. D. Relan et al.,“Retinal vessel classification: sorting arterioles and venule,” IEEE International Conf. on Engineering and Medicine and Biology (EMBC), Osaka, Japan, pp. 7396–7399, 2013 J.A.K. Suykens, T. Van Gestel, J. De Brabanter, et al., Least Squares Support Vector Machines. World Scientific, Singapore, 2002. H.F. Jelinek et al. ,“Towards vessel characterization in the vicinity of the optic disc in digital retinal images,” in Proc. of Image and Vision Computing, 2005 M. Niemeijer, et al., “Automatic classification of retinal vessels into arteries and veins,” in Proc. of SPIE, vol. 7260, 2009. M. Niemeijer, X. Xu, “Automated measurement of the arteriolar-tovenular width ratio in digital color fundus photographs, ” IEEE Trans Med Imaging, vol. 30(11), 1941-50, 2011 H. Narasimha-Iyer et al., “Automatic identification of retinal arteries and veins from dual-wavelength images using structural and functional features,” IEEE Trans. on Biomedical Engineering, vol. 54(8), pp. 1427–35, 2007. A. Zamperini et al., “Effective features for artery-vein classification in digital fundus images,” in Proc. of CBMS, pp. 1-6, 2012 C. Muramatsu et al., “Automated selection of major arteries and veins for measurement of arteriolar-to-venular diameter ratio on retinal fundus images,” Computerized Medical Imaging and Graphics, vol. 35(6) , pp. 472-80, 2011 C. Kondermann, et al., “Blood vessel classification into arteries and veins in retinal images,” in Proc. of SPIE, vol. 6512, 2007. Q. Mirsharif et al.,“Automated characterization of blood vessels as arteries and veins in retinal images,” Computerized Medical Imaging and Graphics, vol. 37(7-8), pp. 607-17, 2013 B. Dashtbozorg et al., “An automatic graph-based approach for artery/vein classification in retinal images,” IEEE Trans. on Image Processing, vol. 23(3), pp. 1073-1083, 2014 R. Chrástek et al., “Automated segmentation of the optic nerve head for diagnosis of glaucoma,” Medical Image Analysis, 9(4), pp. 297314, 2005. A. Giachetti, L. Ballerini, E. Trucco, P. J. Wilson, “The use of radial symmetry to localize retinal landmarks,” Computerized Medical Imaging and Graphics, vol. 37(5-6), pp. 369-376, 2013 H. Wang and D. Hu, “Comparison of SVM and LS-SVM for regression,” IEEE, (5), pp. 279–283, 2005.