Automatic Sales Lead Generation from Web Data Ganesh Ramakrishnan IBM India Research Lab
[email protected]
Sachindra Joshi IBM India Research Lab
[email protected]
Raghu Krishnapuram IBM India Research Lab
[email protected]
Sumit Negi IBM India Research Lab
[email protected]
Sreeram Balakrishnan IBM India Research Lab
[email protected]
Abstract
matic sales lead generation using the Web data.
Speed to market is critical to companies that are driven by sales in a competitive market. The earlier a potential customer can be approached in the decision making process of a purchase, the higher are the chances of converting that prospect into a customer. Traditional methods to identify sales leads such as company surveys and direct marketing are manual, expensive and not scalable.
1
Introduction
Various marketing techniques have been used by companies to target and entice prospective buyers in order to increase their sales. The process of identification of potential buyers is also known as sales lead generation. Live seminars, trade shows, cold calling, mass mailing, advertising and partner referrals are some examples of sales lead generation. These methods can be classified into two types1 : 1) reactive methods, and 2) proactive methods. Reactive methods are the ones in which a customer contacts a company following an advertisement such as one in yellow pages. Subsequently, sales representatives handle the sale. On the other hand, proactive methods are the ones in which a possible customer is contacted cold by a company. Sales representatives then try to verify that that the possible customer is actually a prospect. Identifying possible customers based on certain information about the customers is the most important part of proactive methods. Several data mining methods that use customer information for the identification of likely buyers can be found in the literature [9]. However, these methods cannot be used when relevant information about customers is not readily available. Automatic methods to gather relevant information about customers are required to help identify possible customers. In this paper, we propose a proactive method of sales lead generation that gathers new or evolving information about customers from the Web. Our approach is inspired by the growth of information (such as company descriptions, life cycles, profits and revenue changes) on
Over the past decade the World Wide Web has grown into an information-mesh, with most important facts being reported through Web sites. Several news papers, press releases, trade journals, business magazines and other related sources are on-line. These sources could be used to identify prospective buyers automatically. In this paper, we present a system called ETAP (Electronic Trigger Alert Program) that extracts trigger events from Web data that help in identifying prospective buyers. Trigger events are events of corporate relevance and indicative of the propensity of companies to purchase new products associated with these events. Examples of trigger events are change in management, revenue growth and mergers & acquisitions. The unstructured nature of information makes the extraction task of trigger events difficult. We pose the problem of trigger events extraction as a classification problem and develop methods for learning trigger event classifiers using existing classification methods. We present methods to automatically generate the training data required to learn the classifiers. We also propose a method of feature abstraction that uses named entity recognition to solve the problem of data sparsity. We score and rank the trigger events extracted from ETAP for easy browsing. Our experiments show the effectiveness of the method and thus establish the feasibility of auto-
1 http://www.consultancymarketing.co.uk/sales-lead.htm
1
the Web, posted by several news papers, press releases, trade journals, business magazines and other related sources. We present a system called ETAP (Electronic Trigger Alert Program) that uses this information to discover sales leads. The system is suited for identification of prospective companies as opposed to the identification of individual buyers, making it suitable for B2B (business to business) scenarios. Analysis of sales leads is a complex process that requires skill, time and effort. The proposed system is aimed at gathering sales leads from the Web and presenting them to domain specialists for the final validation.
Thus, ETAP assists sales representatives in prioritizing companies that need to be approached. Event extraction is the most challenging part of the system, due to the unstructured nature of the data. Traditional information extraction [4, 5, 13] deals with extracting entities, relations and events from documents according to pre-defined templates, and can be used to identify events. In our case, identifying trigger events for the mergers & acquisitions sales driver would involve extracting entities that play the roles of “the acquired company”, and “the acquiring company”. Most existing systems for information extraction employ linguistic patterns to fill the slots corresponding to entities and relations. As an example, a linguistic pattern “company acquired company” can be used to extract information about acquired and acquiring companies. Since several different patterns need to be created manually for a single information extraction task, this method involves a large amount of effort. Learning based methods for information extraction have been proposed. However, they suffer from poor precision and recall2 . We argue that for identifying trigger events, it suffices to distill from a large collection of documents, snippets (a collection of sentences) that are related to a particular sales driver and present them in a ranked order of relevance. In ETAP, events are associated with snippets of text. We refer to a snippet that contains information relevant to a sales driver as a trigger event. As an example, to find information pertaining to mergers & acquisitions, it is good enough to determine snippets consisting of one or more sentences that describe the event. In our proposed method, we formulate the problem of trigger event identification as a two-class classification problem. The two classes are: a positive class of data relevant to the sales driver and a negative class comprising a large random sample of data from the Web. Since traditional text classification based on a bag-of-words model suffers from data sparsity problem [7], we address this drawback by using feature abstraction. We obtain feature abstraction by replacing certain words with their type information. The types we consider in this paper are restricted to named entity types and part-of-speech types. Another issue with training a classifier is the availability of relevant training data. We solve this problem by querying the Web to generate ‘noisy’ training data, and then using a method similar to Carla Brodley [3] to train the classifier using this data. Other classifiers that can learn in presence of noise could also be used instead.
ETAP is based on a traditional method of sales lead generation. In the traditional method, companies identify a set of sales drivers for their products/services. A sales driver represents a class of events whose existence indicates a strong propensity to buy products/services of companies associated with the events. Revenue growth, change in management and mergers & acquisitions are examples of sales drivers. The set of sales drivers could be different for different industries. As an example, mergers & acquisitions could be a sales driver for the IT industry but may not be a sales driver for the steel industry. This is because mergers and acquisitions of companies could lead to the integration of IT systems of the companies thereby generating demand for new IT products. Typically, the drivers for a specific industry are determined by expert opinions. Suitable questionnaires are developed and surveys are conducted to gather information about the existence of trigger events related to the known sales drivers. Trigger events are events that occur in the context of a company (or its environment) and belong to a given sales driver. As an example, given mergers & acquisitions as a sales driver for the IT industry, an event such as “Company X plans to acquire Company Y later this year” is a trigger event. Similarly, given revenue growth as a sales driver, an event such as “Company X reported a revenue growth of 10% in the fourth quarter” is a trigger event. Identification of such a trigger event makes Company X a prospective buyer of IT products. The traditional method of gathering trigger events is to call representatives of different companies or conduct interviews with them. This method, being manual, tedious and expensive, is not scalable. In our work, we assume that the set of sales drivers for the industry is known before hand. Given a set of sales drivers for the industry, ETAP automatically identifies trigger events on the Web. The ETAP system crawls the Web to gather documents related to companies and financial news, extracts trigger events from the crawled documents and then ranks the trigger events based on a scoring function for easy browsing.
2 http://www.itl.nist.gov/iaui/894.02/related projects/muc/proceedings/muc 7 proceedings/overview.html
2
The number of extracted trigger events could be large. Therefore, the ranking component of ETAP ranks the extracted trigger events based on a scoring function for easy browsing. Thus the ranking component of ETAP acts as a precursor to the validation of the generated sales leads by domain experts. The simplest scoring function is the posterior probability of the sales-driver class. The ranked list of trigger events can be used by the sales representatives for the further sales related processes. The organization of the rest of the paper is as follows. In Section 2, we present an overview of the ETAP system. In [2] we discuss the details of the data gathering component. In Section 3, we present the method that we used to extract trigger events and discuss feature abstraction and other issues involved in learning classifiers. We present several scoring methods used in ETAP in Section 4. Finally, we present our conclusions and future work in Section 6.
Details of components (2) and (3) are provided in the following sections.
2
3
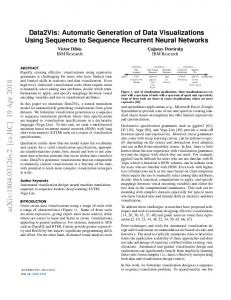
Figure 1. Overview of the system
System Description
3.1
ETAP is based on two main concepts, viz., sales drivers and trigger events. A sales driver represents a class of events whose existence indicates a high propensity to buy products/services by the companies associated with the events. Trigger events are events that occur in the context of a company (or its environment) and indicative of a given sales driver. ETAP currently considers three sales drivers, viz., mergers & acquisitions, change in management, and revenue growth. The ETAP system consists of three components, viz., the data gathering component, an event identification component and a ranking component. Figure 1 depicts the three components of ETAP and there interactions. Below, we briefly describe the functionality of each component.
Event identification component Overview
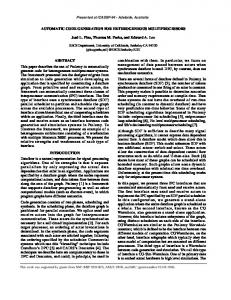
The event identification component consists of three sub-components, viz., snippet generator, annotator and classifiers. This is shown in Figure 2. Each document is first split into snippets (groups of sentences). The choice of operating at the snippet level was motivated by the observation that a snippet conveys a precise piece of information, in contrast with the entire document that contains the snippet. We have built a sentence chunker based on rules for sentence boundary detection. The snippet generator uses the chunker and splits the documents into snippets, each of which is a group of n consecutive sentences. We have used n = 3 in our system. A two-class classifier is employed for determining the relevance of a snippet to each sales-driver. The two classes are (1) a positive class of snippets that pertain to the sales-driver and (2) a large negative class of snippets randomly sampled from the Web. The snippets are annotated by a named entity annotator before being classified. The named entity annotator provides feature abstraction for the classification task. We present the motivation and other details behind feature abstraction in section 3.2. Following named entity annotation, a snippet is passed through the twoclass classifiers, each of which determines the probability that the given snippet pertains to the sales driver corresponding to that classifier. In practice, it is difficult to obtain sufficiently large amount of manually labeled data for training the classi-
1. The data gathering component [2] gathers a collection of documents D from various sources such as proprietary databases and corpora as well as from a focused crawl of the Web. 2. The event identification component splits each document in D into snippets and associates with each snippet, a score of its relevance to the given sales drivers. 3. The ranking component orders snippets so that snippets with higher confidence values for being trigger events are ranked higher. This component also provides the facility for ranking companies based on all trigger events associated with them. 3
data set. We achieve two broad objectives through entity annotation: 1. Generalization: While training, it helps to associate trigger events with general concepts rather than specific instantiations of the general concepts. For example, the fact that IBM made profits of $ 5 billion in the year 1996 could be generalized to learn that potentially any ORGANIZATION could make a profit of CURRENCY in some particular TIME PERIOD. 2. Reducing number of model parameters: Machinelearning-based techniques, such as classification, suffer from over-fitting, when there are too many model parameters. If no annotations are used, all entities tend to become individual features. There are millions of person names, company names, place names, dates, currency and time expressions across the Web. Learning algorithms can save a lot of memory and can also avoid over fitting if these individual expressions are replaced with their annotations.
Figure 2. Event Identification Component fiers. We get around this problem by smartly querying the Web to generate noisy-positive data. Details of the procedure employed for obtaining the noisy positive data set are provided in Section 3.3.1. In Section 3.3.2, we discuss the technique that we adopt for learning the classifier in the presence of noise.
3.2
3.2.1
In ETAP, we apply two types of annotations to documents, viz. part-of-speech annotations and named entity annotations. Named entity annotation is a task in which person names, location names, company and organization names, monetary amounts, time and percentage expressions are recognized in a text document. Below, we present details of a method we employ in ETAP to determine the right level of abstraction using these annotations. The named entity recognizer [11] employed in ETAP identifies and annotates entities falling under one of the following categories: (1) ORG (organization name), (2) DESIG (designation), (3) OBJ (object name), (4) TIM (time), (5) PERIOD (months, days, date, etc), (6) CURRENCY (currency measure), (7) YEAR (sole mention of a year), (8) PRCNT (percentage figure), (9) PROD (product name), (10) PLC (name of a place), (11) PRSN (person name), (12) LNGTH (all units of measurement other than currency), and, (13) CNT (count figures). Any entity that did not fall in the above categories, was assigned a part-of-speech category as determined by QTag3 .
Named Entity Annotations and Feature Abstraction Named Entity Annotation
Data sparsity poses a big problem for learning accurate text classifiers. Given the large amount of information in text data sets, it is desirable to find a compact representation of the data set, losing as little information as possible. This is traditionally a pre-processing step in text classification called feature selection. After simple operations such as changing all text to lower case, stemming, and stop-word elimination, statistical measures are used to compute the amount of information that tokens (features) contain with respect to the labelset. Standard measures used are χ2 , information gain, and mutual information. Features are ranked by one of these measures and only the top few (an ad hoc tunable parameter in most experiments) features are retained. Research in natural language processing technology allows us to take more of the semantics of the text into account. Named entity and part-of-speech tags have been found to be useful representations of textual content in some text classification applications such as gender classification and authorship attribution. We propose the use of named entity and parts-of-speech annotations as candidate representations of the text
3.2.2
Choosing the right abstraction levels
Feature abstraction is a process of replacing words by their type information. In ETAP, we obtain one of two 3 http://www.nlplab.cn/zhangle/morphix-nlp/manual/ node17.html
4
different types of information, namely, part-of-speech type and named entity type, for each word. In this section, we present the method that we employ to determine which type information should be used for feature abstraction for a given sales driver. Let Y be the class random variable that takes on values corresponding to different classes. Let X be a random variable corresponding to a particular abstraction category. We consider two sets of abstraction categories: entity categories and part of speech categories. For each abstraction category, we contrast between the relative information gains for two random variable representations, viz., presence-absence and instancevalued representations. 1. Presence-Absence (PA): In this representation, the abstraction category variable X takes values 0 and 1 corresponding to its presence and absence respectively in a document.
Figure 3. Relative Information Gains for two alternative random variable representations of each abstraction category for the mergers & acquisitions sales driver.
2. Instance-valued (IV): In this representation, the abstraction category variable X takes values corresponding to all the instances of that category that occur in the labeled data set. For instance, the variable for the abstraction category “PLACE” will take the values “Washington”, “New Zealand”, etc, while that for category “VB” (verb) will take values such as “acquired”, “announced”, etc.
is described in Section 3.3.1. Note that the Y-axis in each figure corresponds to the logarithm of the relative information gain. Also note that all named entity category names are capitalized while the part of speech category names are expressed in small letters. We summarize some of our observations based on Figures 3 and 4:
Relative information gain(RIG) is defined as follows: Given two random variables X and Y , and given that Y is to be transmitted, what fraction of bits would be saved if X was known at both sender’s and receiver’s ends. Relative information gain is denoted as RIG(Y |X) and is defined in Equation 1. RIG(Y |X) =
H(Y ) − H(Y |X) H(Y )
1. Verbs (vb), adverbs (rb), nouns (nn and np) and adjectives(jj) should not be abstracted at all because the relative information gain for corresponding IV representation is much higher than that for PA.
(1)
2. Entities (such as PLC and ORG) should be abstracted because the relative information gain for the corresponding P A representation is higher than that for IV.
where H(Y ) is the entropy of random variable Y and H(Y |X) is conditional entropy. In our classification setting, RIG(Y |X) serves as a measure of the correlation of the feature random variable X with the class random variable Y . We compute relative information gain for each abstraction random variable X, comparing its representations PA(X) and IV(X). Figures 3 and 4 compare the relative information gains for PA and IV representations of several abstraction categories. Figure 3 is for the pure positive and negative classes for the mergers & acquisitions sales driver. Figure 4 is for the pure positive and negative classes for change in management sales driver. The generation of the pure positive and negative data sets
Based on these observations, we choose PA representation for all entity category abstractions and IV representation for part-of-speech abstraction categories like vb, rb, nn and jj.
3.3 3.3.1
Snippet Classifier Training data generation
Learning a classifier for snippets requires snippets labeled as ‘positive’ and ‘background’. The snippets for training must capture all variations that express trigger 5
Figure 5. Positive snippet in the result for query “new ceo”.
Figure 4. Relative Information Gains for two alternative random variable representations of each abstraction category for the change in management sales driver.
events pertaining to each sales driver. Thus, learning requires large collection of labeled data. In ETAP, if labeled data for a sales driver is available, any of the existing classifiers such as na¨ıve Bayes [10] and SVM [7] could be used to identify trigger events. However, it is difficult to obtain a manually labeled document collection for most sales drivers. Moreover, one may want to introduce new categories of sales drivers quite frequently and hand-labeling to produce training data for new categories can be very tedious. Therefore, following [1, 6], we devise a simple technique for generating training data consisting of snippets for classifier construction. Three types of data are involved in our classifier construction:
Figure 6. Noise in the result for query “new ceo”.
with high confidence. As an example, to generate noisy positive data set for change in management. we use the query “new ceo” on a search engine to obtain a large number of highly ranked documents. Most of these documents are relevant to the change in management sales driver. Figure 5 shows the first hit that results from this query along with interesting trigger events present on the page. However, not all sentences of a relevant document form trigger events. Figure 6 shows several sentences on the same page that are not valid trigger events. We therefore introduce a second level snippet filtering heuristic as explained below.
1. Pure Positive Data P p : This is a set of manually labeled snippets that pertain to the given sales driver. Generally, it is difficult to find large amounts of pure positive data for a given sales driver. 2. Noisy Positive Data P n : Noisy positive data contains some fraction of irrelevant data in addition to relevant data for the given sales driver. We use a two-step method to accumulate a large noisy positive data set. • Step 1: In this step, we fetch documents from the Web, by querying a search engine using smart queries. These queries are manually formed such that documents returned in response to them are relevant to the sales driver
The smart queries for a sales driver could be obtained by analyzing the pure positive data 6
set. However, in many cases when pure positive data for a sales driver is not available, it is difficult to formulate smart queries. In such cases, we find it feasible to extract instances of trigger events (pertaining to the sales driver) by querying the Web for a recent trigger event related to the sales driver. As an example, consider the mergers & acquisitions sales driver. Searching the Web with a search engine using the na¨ıve query mergers and acquisitions, results in many documents that do not contain instances of mergers and acquisitions. Instead, if one queries the Web with an example of a recent occurrence of a merger or acquisition, then the ratio of relevant documents to the total hits will be relatively high. For example, if one queries the Web with “IBM Daksh”, most of the documents that are returned, are about the recent IBM acquisition of Daksh. • Step 2: To distill out positive snippets from the relevant documents obtained in the first step, we use simple filters to extract only those snippets that contain specific combinations of named entity tags or keywords. For instance, one of the combinations that were used as a snippet-level filter for the sales driver change in management was “Designation AND (Person OR Organization)”. For the sales driver revenue growth, one of the filters used was “Organization AND (Currency OR percent figure)”. The resultant distilled set of snippets forms the noisy positive data set for the corresponding sales driver.
For the cases in which pure positive data is not available in a sufficient amount, noisy positive data can be generated as described in Section 3.3.1. If a small amount of pure positive data is available, we use it after oversampling it by a factor of 3. To learn from the noisy positive data in conjunction with the pure positive and negative data, we construct a na¨ıve Bayes classifier through an iterative method that aims at reducing the effect of the noise. At each iteration, the noise is reduced by reclassifying the noisy positive data set by using the classifier trained in the previous iteration. The method is similar to that proposed in [3]. Given sets of noisy positive data set P n , pure positive data set P p , negative data set N and a classifier C θ , with parameters θ, the iterative method does the following: 1. Learns the parameters θ for the classifier using P n , P p and N . P n and P p form the positive class, while N forms the negative class for training the classifier. 2. Using the trained classifier at present iteration, classifies the noisy positive data set P n . For the next iteration, P n is set to the collection of snippets that are assigned the positive class by the classifier. This reduces the noise in the noisy positive data in each iteration. 3. Iterates on the above two processes until the noisy positive data does not change considerably. Alternatively, any one of the proposed methods of learning classifiers in the presence of noise [8, 12] can be used to train classifiers using the generated noisy positive data along with the background data and pure positive data, if available.
3. Data for Negative Class N : We construct the negative class by randomly picking a large number of snippets from the Web. The same set of negative class snippets can be used across different salesdriver categories. Note, that the negative class may contain a small fraction of data that is positive for a sales driver, however, we ignore this fact and assume that this fraction is very small. In ETAP, we use a collection of over 2 million randomly sampled snippets from the Web as the negative class data. 3.3.2
4
Snippet ranking component
Analysis of sales leads is a complex process that requires skill, time and effort. Many organizations gather competitive information. However, due to the associated costs, only a few formally analyze the information and integrate the results of their analysis into their business strategy. The ranking component of ETAP acts as a precursor to the analysis task. The analysis task still needs to be done by a domain specialist since the issues to be analyzed are often quite complex and the overall reality of the situation may not be all that obvious from the snippet. This component assigns a rank to each trigger event to reduce the time and effort required in the analysis stage. The output of a classifier of the event identification component is a list of snippets along with the
Choice of Classifier
The choice of the classifier depends on the availability of sufficient pure positive data for a sales driver. Traditional methods of classification such as Na¨ıve Bayes [10] and SVM [7] could be used to identify trigger events if sufficient amount of pure positive data is available. 7
Figure 7. Snapshot of ETAP output that contains trigger events along with their ranking based on classification scores for the change in management sales driver
Figure 8. Snapshot of ETAP output containing example trigger events along with their ranking based on semantic orientation scores for the revenue growth sales driver
associated scores. The score for a snippet stands for the confidence with which it was classified as a trigger event for the sales driver. The number of trigger events flagged by the event identification component could be large. Therefore methods for ranking the snippets are required so that more useful trigger events are higher in the order. The usefulness of a trigger event can be based on its score given by the classifier(s). Figure 7 shows a snapshot of ETAP output that contains trigger events along with their ranking based on classification scores for the change in management sales driver. ETAP also provides sales-driver-specific scoring functions. These functions capture the business value of the sales drivers. As an example, for the revenue growth sales driver, trigger events may be ordered based on the percentage change in the revenue for companies in a given year. This requires extraction of exact revenue growth figures from snippets. Determining exact numbers (either in % or in dollar figures ) is not easy in most cases and may require some prior knowledge. For example, revenue declared in the previous year could be required to determnine the percentage change in the revenue of a company for the current year. In ETAP, we use a simpler approach of scoring snippets using the semantic orientation of the words in the snippet. Phrases that convey a stronger sense, e.g., ‘sharp decline’, ‘worst losses’ are weighted more than other phrases, e.g., ‘loss’ and ‘profit’. The semantic orientation of words in the text can be used to judge the overall orientation of the snippet by combining scores of individual words and phrases, to obtain an overall score for the snippet. We constructed a lexicon of positive and negative phrases and assigned weights to each phrase. Examples of positive phrases for the revenue growth sales driver are ‘significant growth’ and ‘solid quarter’. ‘Severe losses’ and ‘sharp decline’ are exam-
ples of negative phrases for revenue growth. Figure 8 shows a snapshot of ETAP output that contains example trigger events along with their ranking based on semantic orientation scores for the revenue growth sales driver. Currently this lexicon is constructed manually for each sales driver. Automated methods of generating lexicons using positive and negative seed terms as described in [14] could also be used. The ranking component can also aggregate scores of all the trigger events that are associated with a company to give the company a score that reflects its overall propensity of buying new products/services. We do this using a variant of the mean reciprocal rank4 (MRR). Let sdi be the ith sales driver and let |SD| be the total number of sales drivers. Let tej (c, sdi ) be the j th trigger event pertaining to company c and sales driver sdi and let rank(tej (c, sdi )) be the rank assigned to the corresponding snippet by the ranking component. Let |T E(c, sdi )| be the total number of trigger events that are associated with company c and sales driver sdi . We define the M RR(c) score for company c as in (2). XX (1/rank(tej (c, sdi )) M RR(c) =
i
j
X
|T E(c, sdi )|
(2)
i
M RR(c) assigns a score to each company c by taking into consideration all trigger events across all sales drivers that pertain to company c. In this way, the ranking component also provides the facility for ranking companies based on all the trigger events that are associated with each company. 4 http://trec.nist.gov/data/qa.html
8
5
Experiments & Results
5.1
following the feature abstraction on the documents performed using the named entity annotator (c.f. Section 3.2). We used Weka’s6 na¨ıve Bayes classifier.
Data Preparation
Sales driver Mergers & acquisitions Change in management
We discuss the performance of the ETAP system through F1 Measure on two sales drivers, viz., mergers & acquisitions and change in management. The F1 measure of is computed as the harmonic mean of the precision and recall measures. We used the procedure described in Section 3.3.1 for generating the three sets of data required for training, namely, pure positive, noisy positive and negative data. A portion of the pure positive data was used in the classifier training phase, while the remaining portion was used for the purpose of evaluation. Five queries were used for generation of the noisy positive training data for each sales driver. Some of the example queries used for the mergers & acquisitions driver were “IBM Daksh”, “Coors Molson” and “Jobsahead Monster”. “New CEO”, “new CTO”, “new Manager” and “new President” were example queries used for the change in management driver. We gathered the top 200 documents returned by the search engine Google5 for each query. We split the documents into snippets and annotated then using the snippet generator and the annotator, respectively. We then applied a set of simple filters based on query terms and named entity annotations to the annotated snippets to distill out the noisy positive data for each driver. An example filter for the change in management driver was “Discard all snippets not containing a (PRSN and ORG) or (DESIG and ORG) annotations”. Similarly, an example filter for the mergers & acquisitions driver was “Discard all snippets not containing two ORG annotations”. See Section 3.2.1 for a description of these annotations. The noisy positive data comprised approximately 3500 snippets for each sales driver. The pure positive data for each category was manually gathered from news Web sites. We held out a fraction of the pure positive data for evaluation. We created a common test data for the classifiers corresponding to both sales drivers. Our test data contained 72 instances of true positives for mergers & acquisitions driver, 56 instances of true positives for the change in management driver and 2265 snippets that did not belong to either of the two sales drivers.
5.2
Precision 0.744 0.656
Recall 0.806 0.786
F1 0.773 0.715
Table 1. Results after two iterations, using na¨ıve Bayes classifier for the two sales drivers It is important to observe that certain sales drivers, such as change in management, contain a large number of misleading trigger events. For the case of change in management, a recurring example is the biographical description of a person. Biographical descriptions typically contain sentences such as - “Mr. Andersen was the CEO of XYZ Inc. from 1980-1985 ”. These are not instances of the change in management sales driver, but will deceive the classifier because of its features. Thus, certain sales drivers are bound to have a lower F1 Measure because of the wide presence of outliers. These can be further tackled by the ranking component by making the score corresponding to each snippet a function of the time period associated with the snippet.
6
Conclusion and Future Work
In this paper, we described a system called ETAP that generates sales leads from the Web data by extracting new or evolving facts about companies. The approach is based on the knowledge of sales drivers. A sales driver represents a class of events whose existence indicates a good propensity to buy products/services by the companies associated with the events. Given the sales drivers, ETAP identifies trigger events from Web pages. We pose the problem of trigger identification given a sales driver as a two-class classification problem. We use feature abstraction to address the problem of data sparsity and to achieve generalization. We use a novel technique that helps in identifying the right level of abstraction. To address the problem of lack of availability of training data for classifiers we present, a method that uses smart queries to generate a noisy positive data set. Although we use a specific method, any existing method for learning classifiers in the presence of noise can be used to obtain classifiers using the generated noisy positive data. We introduce
Evaluation
In Table 1, we present results obtained after the classification step (c.f. Section 3.3) for the two sales drivers under consideration. The classification was carried out
6 http://www.cs.waikato.ac.nz/ml/weka/
5 http://www.google.com
9
ranking methods to assist easy evaluation, verification and use of the identified trigger events. The ranked trigger events obtained from ETAP have been found to be useful for actual sales lead generation. However, several problems need to be addressed for better identification of trigger events. The overall result of ETAP is heavily dependent on the accuracy of the named entity recognizer. Wrong annotation of company and person names leads to incorrect trigger events. For a trigger event to be useful, it should belong to a relevant time period. We need to associate a time with each trigger event to evaluate its relevance. This is not always easy and methods need to be developed to resolve phrases such as “last year” and “previous quarter”. To determine an overall score of a company based on its trigger events, we need to know all the variations to the reference of the company. This information is not always available and automated methods to determine variations of a company name need to be developed.
[6] R. Ghani and R. Jones. Automatic training data collection for semi-supervised learning of information extraction systems. In Accenture Technology Labs Technical Report, 2002. [7] T. Joachims. A statistical learning model of text classification for support vector machines. In Proceedings of the SIGIR-2001, 2001. [8] W. S. Lee and B. Liu. Learning with positive and unlabeled examples using weighted logistic regression. In T. Fawcett and N. Mishra, editors, Proceedings of the 20th International Conference on Machine Learning, pages 448–455, Washington DC, US, 2003. [9] C. X. Ling and C. Li. Data mining for direct marketing: Problems and solutions. In Knowledge Discovery and Data Mining, pages 73–79, 1998. [10] K. Nigam, A. McCallum, S. Thrun, and T. Mitchell. Using em to classify text from labeled and unlabeled documents, 1998.
References
[11] G. Ramakrishnan. Word Associations in Text Mining. PhD thesis, IIT Bombay, 2005.
[1] E. Agichtein and L. Gravano. Querying text databases for efficient information extraction. In Proceedings of the 19th IEEE International Conference on Data Engineering (ICDE), 2003.
[12] G. Ramakrishnan, K. P. Chitrapura, R. Krishnapuram, and P. Bhattacharya. A model for handling approximate, noisy or incomplete labeling in text classification. In Proc. of ICML 2005. http: // www. cse. itib. ac. in/ ∼hare/ bayesanil. pdf .
[2] N. Agrawal, R. Ananthanarayanan, R. Gupta, S. Joshi, R. Krishnapuram, and S. Negi. Eshopmonitor: A web content monitoring tool. In ICDE, pages 817–820, 2004.
[13] S. Sarawagi and W. W. Cohen. Semi-markov conditional random fields for information extraction. In NIPs, 2004.
[3] C. E. Brodley and M. A. Friedl. Identifying and eliminating mislabeled training instances. In Proceedings of the 13th National Conference on Artificial Intelligence, pages 799–805, Portland, Oregon, 1996.
[14] P. D. Turney. Mining the Web for synonyms: PMI–IR versus LSA on TOEFL. Lecture Notes in Computer Science, 2167, 2001.
[4] M. E. Califf and R. J. Mooney. Relational learning of pattern-match rules for information extraction. In Working Notes of AAAI Spring Symposium on Applying Machine Learning to Discourse Processing, pages 6–11, Menlo Park, CA, 1998. AAAI Press. [5] D. Freitag. Toward general-purpose learning for information extraction. In C. Boitet and P. Whitelock, editors, Proceedings of the Thirty-Sixth Annual Meeting of the Association for Computational Linguistics and Seventeenth International Conference on Computational Linguistics, pages 404–408, San Francisco, California, 1998. Morgan Kaufmann Publishers. 10