Automatic segmentation and probe guidance for real-time assistance of ultrasound-guided femoral nerve blocks Erik Smistada,b,∗, Daniel Høyer Iversena,b , Linda Leidigb , Janne Beate Lervik Bakenga , Kaj Fredrik Johansenc , Frank Lindsethb,a a
b
SINTEF Medical Technology, Postboks 4760 Sluppen 7465, Trondheim, Norway Norwegian University of Science and Technology, Sem Sælandsvei 7-9 7491, Trondheim, Norway c St. Olav Hospital, Trondheim, Norway
Abstract Ultrasound-guided regional anaesthesia can be challenging, especially for inexperienced physicians. The goal of the proposed methods is to create a system which can assist a user in performing ultrasound-guided femoral nerve blocks. The system shows in which direction the user should move the ultrasound probe to investigate the region of interest and to reach the target site for needle insertion. Additionally, the system provides automatic real-time segmentation of the femoral artery, the femoral nerve, and the two layers fascia lata and fascia iliaca. This aids in the interpretation of the 2D ultrasound images and the surrounding anatomy in 3D. The system was evaluated on 24 ultrasound acquisitions of both legs from six subjects. The estimated target site for needle insertion and the segmentations were compared to those of an expert anaesthesiologist. Average target distance was 8.5 mm with a standard deviation of 2.5 mm. The mean absolute differences of the femoral nerve and the fascia segmentations were about 1-3 mm. Keywords: Regional anesthesia, Femoral nerve, Segmentation, Assistant
∗
Corresponding Author: Erik Smistad, Postboks 4760 Sluppen 7465, Trondheim, Norway; Email,
[email protected]; Phone, +47 90524585 This is a postprint. The final article is available at http://dx.doi.org/10.1016/j.ultrasmedbio. 2016.08.036. c 2016.
This manuscript version is made available under the CC-BY-NC-ND 4.0 license http://creativecommons.org/licenses/by-nc-nd/4.0/
Preprint submitted to Ultrasound in Medicine and Biology
July 30, 2018
Introduction The use of regional anaesthesia (RA) is increasing due to the benefits over general anaesthesia (GA) such as reduced morbidity and mortality (Rodgers et al., 2000; Beattie et al., 2001; Urwin et al., 2000), reduced postoperative pain, earlier mobility, shorter hospital stay, and lower costs (Chan et al., 2001). Despite these clinical benefits, RA remains less popular than GA. One reason for this is that GA is more successful and reliable than RA. Ultrasound has been used to increase the success rate of RA (Griffin and Nicholls, 2010; Dolan et al., 2008). However, ultrasound-guided RA can be challenging, especially for inexperienced physicians. Good theoretical, practical and non-cognitive skills are needed in order to achieve confidence in performing RA and to keep complications to a minimum. Studies indicate that RA education focusing on illustrations and text alone is not sufficient (Worm et al., 2014). The RASimAs1 project (Regional Anaesthesia Simulator and Assistant) is a European research project which aims at providing a virtual reality simulator to improve the training of doctors performing RA, as well as an assistant to lessen the cognitive burden and help performing RA procedures. One way to lessen the cognitive burden is to provide a segmentation of the ultrasound image, showing the most important structures and thereby aiding the user in interpreting the images. The image segmentation may also be used to guide the movement and positioning of the ultrasound probe. Hadjerci et al. (2014) segmented the median nerve from ultrasound images using k-means clustering for finding hyperechoic tissue, then a texture analysis method based on a support vector machine classifier was used to identify the nerve. A segmentation method for the sciatic nerve in ultrasound images was presented by Hafiane et al. (2014). Their method included a probabilistic Gaussian mixture model, edge detection, gradient vector flow and active contours. Yu et al. (2013, 2014) proposed a system for automatic needle insertion and probe guidance for ultrasound-guided epidural anesthesia. They used a template matching technique to identify the optimal needle insertion point. A guidance system for spine anesthesia was presented by Brudfors et al. (2015). Their approach involved scanning the spine with 3D ultrasound followed by alignment and overlay of a statistical model of the lumbar spine on the ultrasound images. This article focuses on creating an assistant for ultrasound-guided RA to block the femoral nerve. The femoral nerve is located laterally to the femoral artery and is hyperechoic. Still, this nerve is generally hard to distinguish from surrounding tissue. Thus, anatomical knowledge about the shape and location relative to other structures must be employed. Another important aspect of the segmentation is that in order to be useful in this application the segmentation must work in real-time and be fully automatic. This article is a continuation of Smistad and Lindseth (2015), where methods for real-time segmentation and reconstruction of the femoral artery in ultrasound images as well as a model to ultrasound registration method were introduced. Here, novel methods for the segmentation of additional important structures such as the femoral nerve, fascia lata, and fascia iliaca are presented. Methods for estimating the target needle insertion site and visualizations for guiding the positioning 1
http://www.rasimas.eu
2
of the ultrasound probe are also proposed. Materials and Methods The next section will describe the hardware setup of the proposed assistant, followed by an overview section of the assistant software. Then each of the assistant components are described in the order they are executed. The first component is the femoral artery tracking procedure followed by the target estimation, model to ultrasound registration, probe guidance, and finally the fasciae and femoral nerve segmentation methods. In the end of this section, the evaluation of these methods is described. Hardware setup In terms of hardware, the assistant consists of an ultrasound system (Ultrasonix SonixMDP, Analogic, Boston, USA) and a high-end computer for running the assistant software. The ultrasound rack has been modified with a larger screen (Dell 24”) and the high-end computer has been attached on the side. The ultrasound scanner is equipped with an L14-5 linear probe and SonixGPS electromagnetic tracking of both the probe and the needle. The high-end computer has an Intel i7-5820 3.3 GHz CPU, AMD Radeon R9 Fury GPU and 16 GB of RAM. Spatial calibration was done using a calibration matrix from the manufacturer (Ultrasonix, 2011). Harmonic imaging was used with frequency 6.6 MHz and gain at 55%. The images were streamed from the ultrasound system to the assistant computer with an Ethernet cable, the Plus toolkit and the OpenIGTLink protocol (Lasso et al., 2014). Software overview The assistant software starts in an inactive state where only a probe contact detection algorithm is executed for each ultrasound image frame. This algorithm uses the change in image intensity to determine if the ultrasound probe is in contact with the skin of the patient. When contact is achieved, the assistant starts to guide the user in scanning the femoral region. In this process, an artery detection method is used to find the femoral artery. After the artery has been discovered, the artery tracking takes over and the user is asked to first move the probe upwards, i.e. towards the head of the patient. The user is asked to move the probe upwards until the artery descends into the abdomen, the assistant then directs the user to move the probe downwards. When enough of the artery has been scanned to estimate the target area for needle insertion, the assistant directs the user towards the target. Finally, as the target is reached, the segmentation of fascia lata, fascia iliaca and the femoral nerve is executed. To achieve real-time performance, the presented methods are all implemented using the framework for heterogeneous medical image computing and visualization (FAST) (Smistad et al., 2015a). This framework enables efficient computation and visualization on heterogeneous systems which includes different processors such as multi-core CPUs and graphic processing units (GPUs). GPUs have shown to have great potential in accelerating medical image segmentation (Smistad et al., 2015b) and registration (Fluck et al., 2011).
3
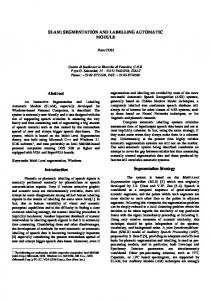
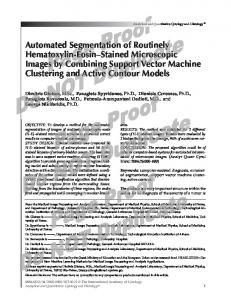
Femoral artery segmentation and 3D reconstruction Methods for femoral artery detection, tracking and reconstruction from ultrasound images were presented in Smistad and Lindseth (2015). Only a short description of these methods are provided here for completeness. The femoral artery is modelled as an ellipse. The artery is first detected by a GPU-based algorithm which initializes the artery tracking. This algorithm is completely automatic and requires no user interaction. The method does a brute-force search for black ellipses in the ultrasound image. A measure of fit is calculated by comparing the image gradients of the smoothed ultrasound image to the normals of an ellipse. Each pixel in the image is investigated and several different major and minor radii ranging from 3.5 to 6 mm are used. The best scoring ellipse is kept and if the score is above a certain threshold, it is accepted and used to initialize the tracking of the artery. The artery tracking is achieved with an extended Kalman filter and the ellipse model. The Kalman filter predicts the position and shape of the artery for each image frame. The prediction is corrected by edge measurements performed along the normals of the current ellipse. This is used to create an estimate of the position and shape of the artery for the current image frame. If the artery moves out of the image, or the edges disappear, the tracking stops. The artery detection algorithm will then take over to look for a black ellipse to initialize the tracking again. Since the probe is tracked, the 3D position of the artery in the 2D ultrasound image can be estimated. The reconstruction algorithm uses this 3D position to create a sphere at that position with the radius obtained from the tracking algorithm. All voxels which are inside the sphere in the reconstruction 3D volume are given the artery label. This volume is then passed on to the surface extraction method in FAST which extracts the surface mesh of the reconstructed artery volume in real-time on the GPU. Target estimation The femoral artery is a continuation of the external iliac artery, which rises up from the abdomen under the inguinal ligament. About 3.5-5 cm inferior to the inguinal ligament, the femoral artery gives off to the deep femoral artery and becomes the superficial femoral artery (Mamatha et al., 2012). This femoral artery along with other surrounding structures are depicted in Figure 1. Two criteria are used for estimating the target needle insertion site. 1. The target should be above the bifurcation of the femoral artery. 2. The target should be where the artery is at minimal depth. After the bifurcation, the radius of the artery should decrease. Thus, the point of bifurcation of the femoral artery is estimated using the step model in (1) with the radius r(i) at each artery centerpoint i. This model finds the breakpoint k which minimizes the difference between each radius r(i) and the average radius on both sides of the breakpoint. Thus, this method finds any transition in the radius as shown in Figure 2. L is the number of artery centerpoints. The centerpoints are sorted so that the first centerpoint 0 is the centerpoint closest to the head of the patient, while the last centerpoint is the one closest to the feet of the patient. 4
Figure 1: Illustration of the femoral nerve block region showing the femoral artery, vein and nerve along with the femur and the pelvic bone. Image courtesy of H. E. Mørk (helemork.com)
" # k k X X 1 argmink∈[1,L−2] r(j) − r(i) + k+1 i=0 j=0 " # L−1 L−1 X X 1 r(j) − r(i) L−k j=k+1 i=k+1
(1)
A threshold on the difference between the average radius on both sides of the breakpoint k is used to determine if k belongs to the bifurcation. The threshold was set to 10% of the average radius. This is necessary because not all acquisitions may cover the bifurcation. The minimal depth requirement will eliminate positions superior of the inguinal ligament which are too deep. The depth is calculated along the imaging direction vector, which is the direction the probe points in. As this may change during the acquisition, the average of all directions during the acquisition is used. The middle of all artery centerpoints that are within 2 mm depth of the minimal depth centerpoint is selected as the target as shown in Figure 2. This was found to be more robust than selecting the centerpoint with the minimal depth, as the depth estimation is not so accurate, which is mostly due to pressure changes and inaccuracies in the tracking system. While the femoral artery is being reconstructed, the target is estimated continuously. Model to ultrasound registration The model to ultrasound registration is used primarily for providing anatomical context to the user by visualizing a model of the surrounding structures together with the ultrasound images in the 3D view. The anatomical model was created from a single abdominal CT 5
Target Artery bifurcation
Target area
Radius (mm)
6 5 4 3 2 1 0
Figure 2: Illustration of a reconstructed femoral artery and the target estimation method which identifies the artery bifurcation and the target based on the depth of the artery.
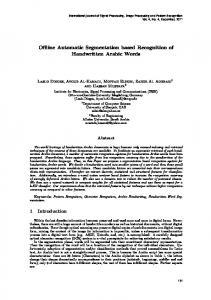
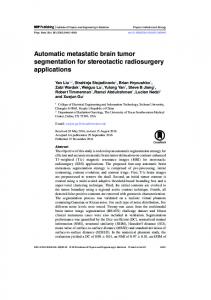
volume with the patient in supine position. From this CT volume, the bone was segmented using region growing. Since the model does not incorporate the anatomical variation in this region, the visualization is not expected to be accurate. Registration of the model to the ultrasound images is difficult as there are no easily identifiable landmarks in the ultrasound images. Instead, the target site estimated using the method in the previous section is used to provide a landmark. The corresponding target point is identified manually in the model and landmark registration is used to register the model to the ultrasound images. However, three landmarks are needed for the registration. To obtain two more landmarks, two points at fixed directions and distances are estimated from the ultrasound images. The second landmark is selected in the direction of the feet along the artery, 1 mm from the target point. The direction of the artery is calculated using the centerpoints from the artery tracking. The third landmark is 1 mm below the target point. The registration is updated continuously when the landmarks change during ultrasound acquisition. More details as well an evaluation of this registration procedure can be found in Smistad and Lindseth (2015). Probe guidance When tracking of the femoral artery is started, the user is asked to move the probe towards the head of the patient. This is indicated by a green bar on top of the ultrasound image as shown in Figure 3. The estimated target is used to give updated probe guidance instructions to the user. According to how much is scanned above and below the target, the user is asked to move the probe up and down indicated by a green bar at the top or at the bottom of the ultrasound image, respectively. If at any time more than 1 cm above and below the target has been reconstructed, a green transparent probe appears at the target position in the 3D view. At this point the user should align the ultrasound probe with this transparent probe as shown in Figure 4. Green bars will also appear in the ultrasound image to guide the user to the target. For the needle insertion, the ultrasound probe should be placed so that the artery is at the right side of the image for the right leg and the left side for the left leg. In this way, the femoral nerve will appear somewhere in the middle of the 6
Figure 3: 2D view of the assistant showing the ultrasound image with the annotated femoral artery in red. The green bar on top of the image is a visual cue to the user indicating that the probe should be moved upwards, in the directions of the patient’s head.
Figure 4: 3D view of the assistant showing a 3D scene of the reconstructed artery, a model of the surrounding bone structures, the ultrasound image and the probe as well as the estimated target location for the probe (green transparent mesh).
image. Green bars on the right and left side of the image are used to tell the user to move the probe to the left or right so that this is achieved. Fascia lata and iliaca segmentation Fascia lata and fascia iliaca are two thin layers which have to be penetrated by the needle to reach the femoral nerve. These fasciae can vaguely be seen in the ultrasound images as bright horizontal curves (see Figure 5). The fascia segmentation method will not start until the target probe position is reached and the probe is kept still. A probability is calculated for both fascia lata PL and fascia iliaca PI for each pixel (x, y) in the ultrasound image. The probability is based on the distance from the skin surface (the top of the image), the distance to the femoral artery and the presence of bright edges. The presence of bright edges will increase the probability that the current pixel is part of a fascia. Edges are located using the Laplacian of Gaussian (LoG) algorithm with standard deviation 0.8 mm. As only bright edges are of interest, positive values of the LoG operation are converted to 0 and negative values are converted to positive values. ( 0 E(x, y) = −RLoG (x, y)
if RLoG (x, y) > 0 else
(2)
Finally, the result is normalized to a range from zero to one (En ). The fascia lata probability PL is then calculated as 7
Figure 5: Ultrasound image of the femoral nerve with manual annotations delineated by an expert. The image Figure 6: Cross-section illustration of the was acquired with an Ultrasonix L14-5 linear probe with region of interest. Image courtesy of H. E. harmonic imaging, 6.6 MHz frequency and 55% gain. Mørk (helemork.com).
PL (x, y) = En (x, y)dL (y) 0 D −y dL (y) = 1 − DL,tL,t y−DL,t 1 − DL,max −D L,t
(3) if y > DL,max if y < DL,t
(4)
else
where dL (y) is a depth factor between zero and one. The constants DL,t and DL,max are the target and maximum depth of fascia lata respectively. Fascia lata should be above the femoral artery, but may be below the top of the artery laterally, as shown in Figure 5 and Figure 6. Therefore the maximum depth is set to the depth of the femoral artery center. If d is the depth of the femoral artery center, the target depth for fascia lata is set to d/2, thus a couple of millimeters above the artery. The fascia iliaca probability PI is calculated as PI (x, y) = En (x, y)dI (y) 0 DI,t −y dI (y) = 1 − DI,t −D I,min y−DI,t 1 − DI,max −D I,t
(5) if y > DI,max or y < DI,min if DI,min ≤ y ≤ DI,t
(6)
if DI,t < y ≤ DI,max
where dI (y) is a depth factor between zero and one. The constants DI,t , DI,min and DI,max are the target, minimum and maximum depth of fascia iliaca. The target depth of fascia iliaca is set to be the depth of the top of the femoral artery, the minimum depth 4 mm 8
above the top and the maximum depth 4 mm below the femoral artery. Both probabilities, including the Laplacian of Gaussian are calculated on the GPU. After the fascia probabilities have been calculated, a dynamic programming method is used to find the cheapest path from the lateral side of the image to the artery. A cheap path is a path which is smooth and goes through high probability pixels. This approach is similar to that used by Foroughi et al. (2007) to extract bone contours from ultrasound images. The minimum cost C of moving from the lateral edge to pixel (x, y) is defined as C(x, y) = Eext (x, y) +
min k∈[j−r,j+r]
(C(x − 1, k) + Eint (y, k))
(7)
The cost is defined as ∞ for the pixels belonging to the artery, thereby making it impossible for the fascia paths to pass through the artery. The parameter r restricts the number of pixels the path may jump vertically from one column to the next and was set to 3. Eext (x, y) is the external energy and is defined as 1 − P (x, y) where P is the fascia probability. This energy is used to drive the path towards the high probability pixels. The internal energy Eint (y, k) is used as a smoothness criteria on the fascia. Eint (y, k) is defined as α(y − k)2 where α is a parameter which controls the amount of smoothness, α = 0.1 was used. The minimum cost C is calculated for all candidate pixels one column x at a time, as the calculation depends on the results from the previous column (x − 1). The first column is initialized with Eext . The dynamic programming technique memoization is used to keep track of which index k gave the lowest cost in (7). The cheapest path can then be found by backtracking from the artery. First, fascia lata is extracted using PL , and then fascia iliaca is extracted in the same way with PI . However, fascia iliaca is also required to be below fascia lata and pass on below the artery. This is done by only calculating the cost for fascia iliaca for pixels below fascia lata and the artery, the rest are set to ∞. Femoral nerve segmentation The femoral nerve is located below the fascia iliaca, lateral to the femoral artery and resting on the iliacus muscle as shown in Figure 5 and 6. The femoral nerve segmentation algorithm therefore uses the already acquired positions of the fascia iliaca and femoral artery to find the nerve. As with the fascia segmentation methods, the nerve segmentation will not start until the target probe position is reached and the probe is kept still. The appearance of the nerve in the ultrasound image is bright and sometimes with a honeycomb like texture pattern. The iliacus muscle below the nerve is darker with a different texture. Similar to the fascia segmentation, a probability of the femoral nerve PN is first calculated for each pixel in the ultrasound image. PN (x, y) = I(x, y)dN (x, y) if y ≤ FI (x) 0 y−FI (x) dN (x, y) = 1 − DN,max if FI (x) < y ≤ FI (x) + DN,max 0 if y > FI (x) + DN,max 9
(8) (9)
Figure 7: The segmented ultrasound image provided by the automated system. The femoral artery is shown in red, the femoral nerve in yellow, fascia iliaca in pink, and fascia lata in green.
The probability depends on the normalized intensity of the pixel I(x, y) and the vertical distance from fascia iliaca (y − FI (x)). The thickness of the nerve is about 2-4 mm (Gruber et al., 2003) and thus pixels further away from the fascia iliaca should get a lower/zero probability. This is done by setting DN,max in the equation above to 4.5 mm divided by the vertical pixel spacing. After the nerve probability map has been generated, it is thresholded to create a segmentation using a threshold of 0.3. Holes are then removed from the segmentation using a morphological close operation with a radius of 2 pixels. Any thin parts (< 1 mm) of the segmentation are removed and the largest remaining segmentation object is retrieved using a flood fill method. Finally, the convex hull of this object is created to form a smooth representation of the femoral nerve. All methods except the flood fill and convex hull calculations are done on the GPU to achieve real-time performance. Figure 7 shows an ultrasound image with segmentation of the femoral artery, femoral nerve, fascia iliaca and fascia lata. Evaluation Ultrasound images of three male and three female volunteers were acquired by an expert anaesthesiologist using the described hardware setup. The age of the subjects ranged from 25 to 40 with BMI in the normal range of 15-25. The volunteers gave informed consent to participate in the study, and only anonymized data were stored and used for further analysis. According to the guidelines from the regional ethics committee, technical and methodological development work using only anonymized data does not have to be submitted for approval, and the study was therefore not assessed by the committee. The study only involved an ultrasound exam, and was therefore not considered to be of any undue risk to the volunteers. Two ultrasound acquisitions of each leg of each of the subjects were collected giving a total of 24 image sequences. Initially, the probe was placed below the inguinal ligament. Next, the probe was moved in an area from 2-3 cm above the ligament down to the bifurcation where the femoral artery gives off to the deep femoral artery of the thigh. Finally, the probe was placed and kept still at the target site. These acquisitions were done with the assistant functionality turned off. 10
Subject 1 1 2 2 3 3 4 4 5 5 6 6 Average Std. dev. Maximum
Leg Right Left Right Left Right Left Right Left Right Left Right Left
Target distance (mm) 9.5 12.8 11.0 10.1 9.5 4.7 6.6 5.0 8.6 10.7 6.9 6.4 8.5 2.5 12.8
Table 1: Distance in millimeters between estimated target and that of an expert anaesthesiologist for each subject and leg (left/right).
The accuracy of the target estimation algorithm was measured by calculating the distance between the estimated target and the final probe position reached by the expert anaesthesiologist. For each image sequence, the accuracy of the target estimation and the femoral nerve and fascia segmentation were measured. The accuracy of the femoral artery segmentation is not evaluated as it is already covered in Smistad and Lindseth (2015). The femoral nerve, fascia lata and fascia ilaca were manually segmented by an expert anaesthesiologist in one image frame for each of the image sequences. The mean absolute difference (MAD) between the segmentation contours of the manual segmentations and the assistant segmentations was used to measure the accuracy of the femoral nerve and fascia segmentations. The Hausdorff distance and the maximum distance were also calculated for the nerve and fascia segmentations, respectively. For the femoral nerve, the closest contour points of the segmentations were used to calculate the MAD and Hausdorff distance. However, for the fascia segmentations, only vertical distance was used. This was because the lengths of both the manual segmentations and assistant segmentations were different. Results Table 1 contains the distances between the estimated target and the target suggested by the expert. On average, the distance is 8.5 mm, with a maximum of 12.8 mm. The segmentation accuracy in millimeters for each subject and leg is summarized in Table 2. These results show that the mean absolute difference is about 1-3 mm for the femoral nerve and the two fasciae. The average Hausdorff distance of the femoral nerve is 6.6 mm with the highest being 8.5 mm. The average maximum distance is 2.5 mm for fascia 11
Subject
Leg
1 1 2 2 3 3 4 4 5 5 6 6 Average Std. dev. Maximum
Right Left Right Left Right Left Right Left Right Left Right Left
Femoral nerve MAD Hausdorff 2.4 8.2 1.6 5.1 1.9 8.5 1.1 4.1 2.2 4.8 2.9 8.5 2.0 6.1 1.8 7.1 1.8 6.4 2.3 8.1 2.3 8.5 0.9 3.3 1.9 6.6 0.6 1.9 2.9 8.5
Fascia MAD 1.5 1.3 1.1 1.2 0.5 0.3 0.2 1.1 2.3 1.3 0.8 1.2 1.1 0.6 2.3
lata Max 2.1 3.0 2.3 2.3 1.1 3.6 3.4 2.2 4.2 2.8 1.6 1.8 2.5 0.9 4.2
Fascia iliaca MAD Max 1.5 3.3 2.0 3.9 0.8 3.0 1.9 3.9 1.3 3.3 1.5 2.5 0.8 2.9 2.0 9.5 1.9 4.3 1.4 3.6 1.0 3.4 1.2 4.3 1.4 4.0 0.4 1.8 2.0 9.5
Table 2: Segmentation accuracy in millimeters for each subject and leg (left/right).
lata and 4.0 mm for fascia iliaca. Runtime measurements of the femoral nerve and fascia segmentation methods are collected in Table 3. The speed of the femoral artery segmentation, reconstruction and registration are already covered in Smistad and Lindseth (2015). The runtime of the target estimation is not included as it is less than 1 ms. Discussion The assistant estimates the target site for needle insertion based on the reconstructed artery. Experiments on both legs of six different subjects showed that on average the estimated target was 8.5 mm from the target determined by an expert anaesthesiologist. We argue that this accuracy is acceptable as the ideal site for needle insertion is not a single point, but rather an area of 1-2 cm. The femoral nerve, fascia lata and fascia iliaca are difficult for a novice to identify in an ultrasound image, as their complete contours are usually not visible. An operator will therefore rely on the surrounding structures, anatomical knowledge and experience in order to delineate these structures in the ultrasound image. This lack of well-defined contours also make automatic segmentation of these structures difficult. Although not completely accurate, the proposed segmentation methods may still be useful for a novice user in order to identify the structures. Machine learning techniques may be a way to increase the accuracy of the segmentation, however, these techniques may not satisfy the real-time constraints and will require a lot more training data. By utilizing a modern GPU and the FAST framework (Smistad et al., 2015a), the proposed methods together with the methods from previous work (Smistad and Lindseth, 2015) 12
Subject
Leg
1 1 2 2 3 3 4 4 5 5 6 6 Average Std. dev.
Right Left Right Left Right Left Right Left Right Left Right Left
Femoral nerve segmentation 12 12 11 5 7 10 11 10 9 11 13 11 10 2
Fascia segmentation 15 18 15 20 15 18 17 22 12 18 17 18 17 3
Table 3: Speed measured in milliseconds for each subject and leg (left/right).
are able to perform in real-time for the complete assistant application, using less than 100 ms to process a single ultrasound image. The number of frames per second was about 10 using harmonic imaging with the Ultrasonix SonixMDP scanner. Obesity will negatively impact the overall ultrasound image quality. With poor image quality, the proposed assistant functionality may not be able to identify the important structures and therefore not able to assist the user in the procedure. Obesity and the resulting poor image quality is also a problem for anesthesiologists performing femoral nerve blocks without the proposed assistant. Future work of the proposed assistant includes needle insertion guidance and enhancement of the local anaesthetic after injection. The hypothesis that this assistant helps novice users in identifying the femoral nerve and the target site for needle insertion is not validated in this article. However, the assistant will be clinically tested and evaluated in future work at three different clinical sites as part of the ongoing RASimAs project. Conclusion A real-time automatic assistant for ultrasound-guided femoral nerve blocks was presented. The assistant estimates the target site for needle insertion which on average was 8.5 mm from the target determined by an expert anaesthesiologist. The user is guided towards this target through several visual cues and a 3D view of the surrounding structures. The results show that the assistant is able to segment important structures such as the femoral artery, femoral nerve, fascia lata and fascia iliaca with mean absolute differences of about 1-3 mm.
13
Acknowledgment This project has received funding from the European Union’s Seventh Framework Programme for research, technological development and demonstration under grant agreement no 610425. References Beattie WS, Badner NH, Choi P. Epidural analgesia reduces postoperative myocardial infarction: a meta-analysis. Anesthesia and analgesia, 2001;93:853–858. Brudfors M, Seitel A, Rasoulian A, Lasso A, Lessoway VA, Osborn J, Maki A, Rohling RN, Abolmaesumi P. Towards real-time, tracker-less 3D ultrasound guidance for spine anaesthesia. International Journal of Computer Assisted Radiology and Surgery, 2015;10:855– 865. Chan VW, Peng PW, Kaszas Z, Middleton WJ, Muni R, Anastakis DG, Graham BA. A comparative study of general anesthesia, intravenous regional anesthesia, and axillary block for outpatient hand surgery: clinical outcome and cost analysis. Anesthesia and analgesia, 2001;93:1181–1184. Dolan J, Williams A, Murney E, Smith M, Kenny GNC. Ultrasound Guided Fascia Iliaca Block: A Comparison With the Loss of Resistance Technique. Regional Anesthesia and Pain Medicine, 2008;33:526–531. Fluck O, Vetter C, Wein W, Kamen a, Preim B, Westermann R. A survey of medical image registration on graphics hardware. Computer methods and programs in biomedicine, 2011;104:e45–57. Foroughi P, Boctor E, Swartz MJ, Taylor RH, Fichtinger G. Ultrasound Bone Segmentation Using Dynamic Programming. 2007 IEEE Ultrasonics Symposium Proceedings, 2007:2523–2526. Griffin J, Nicholls B. Ultrasound in regional anaesthesia. Anaesthesia, 2010;65:1–12. Gruber H, Peer S, Kovacs P, Marth R, Bodner G. The ultrasonographic appearance of the femoral nerve and cases of iatrogenic impairment. Journal of ultrasound in medicine : official journal of the American Institute of Ultrasound in Medicine, 2003;22:163–172. Hadjerci O, Hafiane A, Makris P, Conte D, Vieyres P, Delbos A. Nerve Detection in Ultrasound Images Using Median Gabor Binary Pattern. In: 11th International Conference, ICIAR 2014, 2014. pp. 132 – 140. Hafiane A, Vieyres P, Delbos A. Phase-based probabilistic active contour for nerve detection in ultrasound images for regional anesthesia. Computers in Biology and Medicine, 2014;52:88–95. 14
Lasso A, Heffter T, Rankin A, Pinter C, Ungi T, Fichtinger G. PLUS: open-source toolkit for ultrasound-guided intervention systems. IEEE transactions on bio-medical engineering, 2014;61:2527–2537. Mamatha H, D’souza AS, Jessica S, Suhani S. A CADAVERIC STUDY ON THE VARIATIONS IN THE ORIGIN, COURSE AND BRANCHING PATTERN OF THE PROFUNDA FEMORIS ARTERY. International Journal of Current Research and Review, 2012;4:137–145. Rodgers A, Walker N, Schug S, Mckee A, Kehlet H, Zundert aV, Sage D, Futter M, Saville G, Clark T, Macmahon S. Reduction of postoperative mortality and morbidity with epidural or spinal anaesthesia: results from overview of randomised trials. British Medical Journal, 2000;321:1493–1497. Smistad E, Bozorgi M, Lindseth F. FAST: framework for heterogeneous medical image computing and visualization. International Journal of Computer Assisted Radiology and Surgery, 2015a;10:1811–1822. Smistad E, Falch TL, Bozorgi M, Elster AC, Lindseth F. Medical image segmentation on GPUs – A comprehensive review. Medical Image Analysis, 2015b;20:1–18. Smistad E, Lindseth F. Real-Time Automatic Artery Segmentation, Reconstruction and Registration for Ultrasound-Guided Regional Anaesthesia of the Femoral Nerve. IEEE Transactions on Medical Imaging, 2015. Ultrasonix. GPS Data Collection, 2011. http://www.ultrasonix.com/wikisonix/index. php/GPS_Data_Collection - Last accessed 28 Jan. 2016. Urwin SC, Parker MJ, Griffiths R. General versus regional anaesthesia for hip fracture surgery: a meta-analysis of randomized trials. British journal of anaesthesia, 2000;84:450– 455. Worm BS, Krag M, Jensen K. Ultrasound-Guided Nerve Blocks - Is Documentation and Education Feasible Using Only Text and Pictures? PLoS ONE, 2014;9:1–7. Yu S, Tan KK, Shen C, Sia ATH. Ultrasound guided automatic localization of needle insertion site for epidural anesthesia. 2013 IEEE International Conference on Mechatronics and Automation, IEEE ICMA 2013, 2013:985–990. Yu S, Tan KK, Sng BL, Li S, Sia ATH. Automatic Identification of Needle Insertion Site in Epidural Anesthesia with a Cascading Classifier. Ultrasound in Medicine and Biology, 2014;40:1980–1990.
15