measure of statistical dispersion, as a discriminating feature that can be used for the classification of EEG signals into normal, interictal and ictal classes.
International Journal of Computer Applications (0975 – 8887) Volume 44– No11, April 2012
Automatic Seizure Detection using Inter Quartile Range M. Bedeeuzzaman
Omar Farooq
Yusuf U Khan
Department of Electronics Engg AMU, Aligarh Uttar Pradesh, India
Department of Electronics Engg AMU, Aligarh Uttar Pradesh, India
Department of Electrical Engg AMU, Aligarh Uttar Pradesh, India
ABSTRACT The statistical properties of seizure EEG are found to be different from that of the normal EEG. This paper ascertains the efficacy of inter quartile range (IQR), a median based measure of statistical dispersion, as a discriminating feature that can be used for the classification of EEG signals into normal, interictal and ictal classes. IQR along with variance and entropy are calculated for each frame of EEG. To reduce the feature vector size, standard statistical features such as mean, minimum, maximum and standard deviation were evaluated and were given as input to a linear classifier. Without resorting to any kind of transformation, the proposed method reduces the computational complexity and achieves a classification accuracy of 100%.
General Terms Signal processing, pattern recognition.
Keywords Electroencephalogram, epilepsy, feature extraction, inter quartile range, classification.
1. INTRODUCTION Epilepsy is a common neurological disorder caused by the sporadic and abnormal neuronal firing in the brain. It is characterized by the changes in brain dynamics that evolves from a normal state, first to an interictal state and then, to an ictal (seizure) state. These seizures are characterized by temporary deterioration of sensation and thinking [1]. The brain activity during the seizure differs significantly from that in the normal state in terms of neuronal firing. Neurons in different parts of the brain fire independent of each other in the latter case, whereas the neurons from multiple parts of the brain fire in synchronization with the epileptogenic focus in the former case. However, during many occasions, detection of seizures can be challenging because of excessive presence
1 1 2 .. .. N
Various techniques have been proposed for the detection of epileptic seizure in EEG using Lyapunov exponent [2], power spectrum estimation [3], sample entropy [4], correlation sum [5] and wavelet domain features [6]-[8]. Also various classifiers have been proposed for the classification of EEG signals. Different types of artificial neural networks [9], support vector machine [10], Multiple Layer Perceptron neural network [11], and adaptive neuro fuzzy interference system [12] are few among them. Besides the complex and transforms based ways of feature extraction, a common characteristic of the methods explained above is the use of different types of neural networks which requires training and consumes time. A seizure detection method based on the time domain analysis of EEG signal is presented in this paper. Each channel of normal, interictal and seizure (ictal) EEG data were divided into frames of 256 samples. The statistical features of variance, skewness, kurtosis, inter quartile range, coefficient of variation and entropy were calculated for each frame. Then through ranking of features, inter quartile range, variance and entropy were found to be more significant among the 6 features, and were selected. In order to reduce the feature vector size, minimum, maximum, mean and standard deviation of these features were computed over frame duration. Classification was done over these parameters using a linear classifier. The proposed method was able to classify the epochs into their respective classes with an accuracy of 100%.
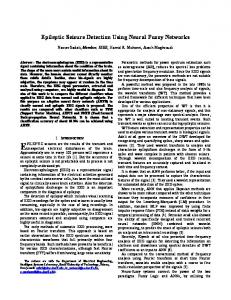
2. MATERIALS AND METHODS In this work, the seizure detection problem was approached as a three-group classification problem that involves normal, interictal and ictal EEGs. A general schematic of the method adopted for classifying the three groups is shown in Figure 1. Each of the N channels of the EEG data was divided into M frames of length L. Three statistical features viz. variance, inter quartile range and entropy, were extracted for each frame
2 …………… M
1x12
Feature Extraction
IQR (1xN) Var (1xN) Ent (1xN)
Mean Max Min Std.
1X4 1X4
1X4
Output Linear classifier
0=Normal 1=Interictal 2=ictal
Fig 1 Schematic of the proposed seizure detection method of muscular artifact and overlapping symptoms of various mental states. Therefore there exists a strong need to automate the seizure detection process.
and their dimension was reduced by selecting mean, maximum, minimum and standard deviation of these features.
1
International Journal of Computer Applications (0975 – 8887) Volume 44– No11, April 2012 Based on these parameters, the linear classifier classifies the EEG data into any of the above three classes.
The position of median line in the distribution of
2.1 Description of data In this study the data used were a subset of the EEG data made available online by the University of Bonn, Germany [13]. The complete data set consisted of five sets (denoted A– E), each containing 100 single channel EEG segments. Sets A and B consisted of surface EEG recordings taken from healthy subjects in an awakened state with eyes open (A) and eyes closed (B), respectively. Segments in set D were recorded from the epileptogenic zone, and those in set C were from the hippocampal formation of the opposite hemisphere of the brain. While sets C and D contained activity measured during seizure free intervals only, set E contained only the seizure activity. The data were recorded with the same 128-channel amplifier system and digitized at 173.61 Hz sampling rate and 12 bit A/D resolution. A band-pass filter having a pass band of 0.53–40 Hz (12 dB/oct) was used to select the EEG signal in the desired band. Three datasets corresponding to normal (set A), interictal (set D) and ictal (set E) were used in this work which has also been studied by other researchers [2], [11], [14]-[17].
Fig 2 Plot of EEG Data for the first channel of each class
2.2 Feature Extraction The performance of a classifier has strong dependence on the features that are being used to characterize the raw data. Hence, the optimal selection of the feature subset from an available feature set plays a key role in the performance of a classifier [18]. In this study, acquired EEG data were grouped in frames of L data points. In order to understand the behavior of the data distribution during the normal, interictal and seizure EEGs, standard statistical features were analyzed. Figure 2 shows the plot for the first channel of each of the normal, interictal and ictal EEG classes and Figure 3 depicts the histograms for the same. It is a simple way to show the probability distribution that gives significant time domain information regarding the signal. The non-symmetry in the distribution of seizure shows its highly skewed nature compared with the other two distributions. It can easily be inferred from Figure 2 and Figure 3 that the seizure EEG has larger mean value and higher sample amplitudes. The box plots depicted in Figure 4 presents a wealth of information regarding many important aspects of a distribution. It is a graphical method of displaying the following: the median, the upper and lower quartiles, and the minimum and maximum data values. The line in the box indicates the median in the data. As the upper edge of the box indicates 75th percentile (upper quartile) of the data set and lower edge indicates the 25th percentile (lower quartile), the spacing between the top and bottom of the box gives the inter quartile range (IQR), which is an important median based statistical feature. The “whiskers” of the box plot are the vertical lines extending from the box. The end points of these whiskers indicate the minimum and maximum values in the dataset. If there are "outliers" in the data, the whiskers extend to a maximum of 1.5 times the IQR. The following inferences can be derived from the box plots given in Figure 4: There is a marked difference in the IQR in the three plots given. The outliers present (shown as + signs beyond the maximum and minimum values) stand witness to the larger deviations in the distribution.
Fig 3 Histogram of the normal, interictal and seizure segments seizure case, given in Figure 4, shows the skewed character of the data. The peak value of the distribution for seizure is many folds higher than that of the other two. The IQR, which is also known as the midspread or middle fifty will be more immune to the impact of outliers as it is being equal to the difference between the third and first quartiles. So the inclusion of this as a discriminating feature for seizure detection will be helpful to nullify the effect of
Fig 4 Box plot for the first channel of normal, interictal and seizure segments outliers that may be present due to large deviations in the EEG signals. The observable difference in the spread characteristics of three different cases leads to the selection of another measure of statistical dispersion, i.e. coefficient of variation (CoV). It is the ratio of the standard deviation to the mean. The variance is a way to capture the distribution’s scale
2
International Journal of Computer Applications (0975 – 8887) Volume 44– No11, April 2012 or degree of being spread out. The variance of a real-valued random variable is its second central moment. Skewness and Kurtosis are the third and fourth moments respectively of a distribution function about the mean. Skewness is a measure of asymmetry. Kurtosis shows the degree of “peakedness” of a real valued random variable. The rhythmicity expected with seizure data [7] and the associated lower degree of uncertainty prompts to include entropy in the feature list. Among the features mentioned above, the variance, skewness, kurtosis, coefficient of variation [19] and entropy [20] have already been used as features for EEG analysis, whereas the inter quartile range is a new feature introduced in this paper. In order to evaluate the relative usefulness of the features in classification problem at hand, the t-test class separability criterion for binary classification [21], [22] is being used with both two class cases, [one involves sets A (normal) and E (seizure); the other involves sets D (interictal) and E (seizure)]. The results given in Table 1 show that among the 6 features considered, inter quartile range, variance and entropy were more significant. Therefore, these three features were selected. Table 1. Significance of each feature obtained with t-test class separability criterion Normal and Ictal t-test Feature value IQR 66.56 Variance 43.17 Entropy 19.26 Kurtosis 7.87 Skewness 2.69 CoV
Interictal and Ictal t-test Feature value IQR 59.75 Variance 40.05 Entropy 22.22 Skewness 4.49 Kurtosis 3.01
1.35
CoV
1.20
The average values of extracted feature are given in Table 2. The increased dispersion of amplitude in the seizure data in comparison with the normal and interictal ones explains the high values of IQR and variance of Set E. As expected, the seizure data shows the lesser entropy value due to its rhythmicity. Each of the N channels was segregated into M frames and K different features were computed for each frame. In order to reduce the dimensionality of the extracted feature vectors and thereby to lessen the computational complexity mean, minimum, maximum and standard deviation of each extracted feature were evaluated.
2.3 Classification A linear classifier identifies the class or group to which a particular object belongs to based on the value of the linear combination of the feature values. If the input feature vector to the classifier is a real vector x , then the output score is:
y f .x f j .x j j
(1)
where is a real vector of weights and f is a function that converts the dot product of the two vectors into the desired output. The weight vector
is learned from a set of labeled
training samples. Often f is a simple function that maps each value to a certain class based on the value of the linear combination of the features.
Table 2. Average values of extracted features Features
Data Set Normal(Set A)
IQR 52.94
Variance 1642.01
Entropy 2.90
Interictal(Set D)
76.16
7321.26
2.87
Seizure(Set E)
392.48
115624.00
2.86
3. RESULTS AND DISCUSSION In this work, the number of EEG channels was 100 and each channel was divided into 16 frames (i.e., in Figure 1, N=100 and M=16). IQR, variance and entropy were computed for each frame. This has resulted in a feature set consisting of 3 feature vectors (represented as IQR, Var and Ent, in Figure 1) of 100 dimensions each, corresponding to each frame. The evaluation of mean, minimum, maximum and standard deviation over these feature vectors resulted in 3 vectors of 4 dimensions each. Then the size of the feature set for each frame reduces to 12 values as shown in Figure 1. About 60% of the data was used for training and both training and test sets were kept mutually exclusive. This resulted into having 10 frames for training and 6 for testing. The test performance of the classifiers may be determined by the computation of specificity, sensitivity and total classification accuracy which can be defined as follows: Sensitivity= Number of true positive decisions/ Number of actually positive cases (2) Specificity= Number of true negative decisions / Number of actually positive cases (3) Total Accuracy= Number of correct decisions / Total number of cases (4) Sensitivity tells whether any of the actual seizure cases (true positive) is misclassified as normal (false negative) and specificity means whether any of the actual normal cases (true negative) is misclassified as a seizure case (false positive). In this work no misclassification occurs in both directions. Hence we get both sensitivity and specificity as 100%. This naturally leads to 100% accuracy as it gives the measure of overall correct classification. The results obtained in this work, in comparison with the earlier works based on the same data sets, are given in Table 3. To evaluate the effectiveness of the IQR, the classification with and without this feature was carried out and the results obtained are shown in Table 4. When the classification of normal (set A), interictal (set D) and seizure (set E) EEGs were carried out, the maximum accuracy was possible even without IQR. However, in the classification that involves set C of interictal EEG along with sets A and E, the accuracy is improved by the inclusion of IQR in the feature set: from 94.4% (without IQR) to 100% (with IQR). These results demonstrate the better performance of the proposed seizure detection method using dispersion measures. It exhibits an improvement of about 2% in accuracy over the other methods, except one, given Table 4. The method of automatic detection using recurrent neural network employing Lyapunov exponents trained with Levenberg-Marquqadt algorithm [2] shows a classification accuracy of 96.79%. Mixed band wavelet-chaos-Neural Network methodology [14] in which the Correlation Dimension, Largest Lyapunov Exponent and Standard Deviation were used for EEG representation, succeeded in discriminating between three
3
International Journal of Computer Applications (0975 – 8887) Volume 44– No11, April 2012 Table 3. Comparison of results obtained by the proposed feature set and that of the earlier reported works based on the same datasets GhoshNaghsh-Nilchi Guler. N.F. dastidar Parameter Ubeyli[15], Tzallas et and Song and This et al [2], et al (%) 2009 al[17], 2009 Aghashahi[11], Lio[16], 2010 work 2005 [14], 2010 2007 Specificity
97.38
-
96.00
100
98.75
98.77
100
Sensitivity Accuracy
96.88
-
94.50
100
97.50
97.26
100
96.79
96.70
94.83
100
97.50
95.67
100
types of EEG with 96.7% accuracy. In the combined neural network model [15], where the maximum, minimum, mean and standard deviation were calculated in decomposed wavelet sub bands and a two-level neural network was used, the classification accuracy is found to be 94.83%. NaghshNilchi et al [11] have used a feature vector formed by combining frequency sub-band features (maximum, entropy, average, standard deviation and mobility) and time domain features (standard deviation and complexity measure) for classifying the three classes of EEG signals. When these features were used along with multiple layer perceptron neural networks, an average accuracy of 97.5% has been obtained. In a recent work on seizure detection based on sample entropy and extreme learning machine (ELM) [16], the accuracy obtained was 95.67%. Among the 6 other methods shown in Table 4, only the time – frequency analysis method [17] reported results at par with the proposed method. Though it registers an accuracy of 100%, the method made use of 12 different time frequency distributions in addition to Short Time Fourier transform (STFT), to obtain the power spectrum density. This is due to the crucial role that the selection of the time frequency distribution is having in determining the efficiency of the method. Then features measuring the fractional energy of specific time-frequency windows are calculated using several partitions on the time and frequency axes. The features were tested with 5 different classifiers. The reported accuracy has been obtained with only one (reduced interference (RI)) among the 13 distributions used. Also, this result was produced with artificial neural network (ANN), which presented the highest computational complexity and training time among the 5 classifiers used [17]. Hence comparing with the time-frequency approach, this paper introduces a method which uses simple statistical features along with the linear classifier to yield the same results. A common trait of the methods explained above is the complex ways of feature extraction and classification. On the contrary, this paper proposes a method which uses simple statistical features along with the linear classifier. This reduces the computational complexity and hence results in a faster detection of seizure. The EEG data sets used were Table 4. Comparison of the accuracy obtained by feature set including IQR and excluding IQR Sets involved
Accuracy obtained (%)
A, C, E
With IQR 100
Without IQR 94.40
A, D, E
100
100
initially cleansed from the artifacts due to muscle activity or eye movements which cause much of the false detection in EEG analysis. So the results with real life data is expected to be inferior to the one reported in this paper.
4. CONCLUSION A new combination of statistical features and linear classifier for seizure detection is presented in this paper, which shows 100% accuracy. The use of features those quantify the dispersion characteristics (Inter Quartile Range and variance) and rythmicity (entropy) help to achieve this. The inclusion of a median based measure of dispersion like inter quartile range, which is highly resilient to outliers, in the feature list is found to be a good discriminating feature between seizure and non seizure signals. As per the authors’ knowledge, the inter quartile range has not been previously used for epileptic seizure detection. Estimation of four statistical parameters in each frame significantly reduces the dimension of feature vector. This reduces the complexity of classification and thereby increases the speed. The use of linear classifier also accelerates the classification process.
5. REFERENCES [1] Ihle, M., Feldwisch-Drentrup, H., Teixeira, C. A.,Witon, A., Schelter, B., Timmer, J., Schulze-Bonhage, A. 2010 EPILEPSIAE- A European epilepsy database, Comput. Methods Programs Biomed. doi:10.1016/j.cmpb.2010.08.011 [2] Guler, N.F., Ubeyli, E. D., and Guler, I. 2005 Recurrent neural networks employing Lyapunov exponents for EEG signal classification, Expert Syst. Appl. 29, 507514. [3] Polat, K. and Gu¨nes, S. 2008 Artificial immune recognition system with fuzzy resource allocation mechanism classifier, principal component analysis and FFT method based new hybrid automated identification system for classification of EEG signals, Expert Syst. Appl. 34, 2039-2048. [4] Guo, L., Rivero, D. and Pazos, A. 2010 Epileptic seizure detection using multiwavelet transform based approximate entropy and artificial neural networks, J. Neurosci. Methods 193 (1), 156-163. [5] Tito, M., Cabrerizo, M., Ayala, M., Barreto, A., Miller, I., Jayakar, P., and Adjouadi, M. 2009 Classification of electroencephalographic seizure recordings into ictal and interictal files using correlation sum, Comput. Biol. Med. 39, 604 – 614. [6] Wang, D., Miao, D. and Xie, C. 2011 Best basis-based wavelet packet entropy feature extraction and hierarchical EEG classification for epileptic detection, Expert Syst. Appl. 38, 14314–14320.
4
International Journal of Computer Applications (0975 – 8887) Volume 44– No11, April 2012 [7] Khan, Y.U. and Gotman, J. 2003 Wavelet based automatic seizure detection in intracerebral electroencephalogram. Clin. Neurophysiol. 114, 898908. [8] Hsu, K. and Yu, S. 2010 Detection of seizures in EEG using subband nonlinear parameters and genetic algorithm. Comput. Biol. Med. 40, 823-830. [9] Patnaik, L.M. and Manyam, O. K. 2008 Epileptic EEG detection using neural networks and post-classification. Comput. Methods Programs Biomed. 91, 100-109. [10] Temko, A., Thomas, E., Marnane, W., Lightbody, G. and Boylan, G. 2011 EEG-based neonatal seizure detection with Support Vector Machines, Clin. Neurophysiol. 122, 464–473. [11] Naghsh-Nilchi, A. R. and Aghashahi, M. 2010 Epilepsy seizure detection using eigen-system spectral estimation and Multiple Layer Perceptron neural network, Biomed. Signal Process. Control 5, 147–157. [12] Subasi, A. 2007 Application of adaptive neuro-fuzzy inference system for epileptic seizure detection using wavelet feature extraction, Comput. Biol. Med. 37, 227 – 244. [13] Andrzejak, R.G., Lehnertz, K., Mormann, F., Rieke, C., David, P. and Elger, C. E. 2001 Indications of nonlinear deterministic and finite-dimensional structures in time series of brain electrical activity: Dependence on recording region and brain state. Phys. Rev. E 64 (061907), 1-8. [14] Ghosh-dastidar, S., Adeli, H. and Dadmehr, N. 2007 Mixed-bandwavelet-chaos-neural network methodology for epilepsy and epileptic seizure detection, IEEE Trans. Biomed. Eng. 54, 1545-1551.
[15] Übeyli, E. D. 2009 Combined neural network model employing wavelet coefficients for EEG signals classification, Digital Signal Process. 19, 297-308. [16] Song, Y. and Liò, P. 2010 A new approach for epileptic seizure detection: sample entropy based feature extraction and extreme learning machine, J. Biomedical Science and Engineering 3 556-567. doi:10.4236/jbise.2010.36078 [17] Tzallas, A. T., Tsipouras, M. G. and Fotiadis, D. I. 2009 Epileptic Seizure Detection in EEGs Using Time– Frequency Analysis. IEEE Trans. Inf. Technol. Biomed. 13, 703-710. [18] Ocak, H. 2008 Optimal classification of epileptic seizures in EEG using wavelet analysis and genetic algorithm, Signal Process. 88, 1858-1867. [19] Aarabi, A., Wallois, F. and Grebe, R. 2005 Feature selection based on discriminant and redundancy analysis applied to seizure detection in newborn. In Proceedings of 2nd International IEEE EMBS Conference on Neural Engineering, Arlington, Virginia, 241-244. [20] Yildiz, A., Akin, M., Poyraz, M. and Kirbas, G. 2009 Application of adaptive neuro-fuzzy inference system for vigilance level estimation by using wavelet-entropy feature extraction. Expert Syst. Appl. 36 (4), 7390-7399. [21] Duda, R. O., Hart, P. E. and Stork, D. G. 2003 Pattern Classification, 2nd ed., Singapore: John-Wiley & Sons (Asia) Pte. Ltd. [22] Selvin, S., 2005 Biostatistics: How it Works. Pearson Education Inc.
5