2010 International Conference on Pattern Recognition
Automatic Selection of Keyframes from Angiogram Videos T. Syeda-Mahmood1 , D. Beymer1 , F. Wang1 , A. Mahmood2 , R.J. Lundstrom, M.D.3 , N. Shafee, M.D.3 , T. Holve, M.D.3 1 IBM Almaden Research Center, 2 Monta Vista High School, 3 Kaiser Permanente San Francisco Medical Center {stf, beymer, wangfe}@us.ibm.com,
[email protected] {Taylor.J.Holve, Navid.Shafaee, Robert.Lundstrom}@kp.org
Abstract In this paper we address the problem of automatic selection of important vessel-depicting key frames within 2D angiography videos. Two different methods of frame selection are described, one based on Frangi filter, and the other based on detecting parallel curves formed from edges in angiography images. Results are shown by comparison to physician annotation of such key frames on 2D coronary angiograms.
1. Introduction Coronary angiography is used routinely to assess coronary artery disease. It is used both pre-operatively to examine the arteries for evidence of stenosis as well as to monitor the progress of revascularization during angioplasty. The X-ray images can be either still images or videos captured at 15-30 frames per second to allow the cardiologist to evaluate the vascular anatomy and blood flow through vessels. During the analysis of the angiographic data, the cardiologist/radiographer often pauses at specific images to examine the vessels. Such images often depict the vessels with best clarity. In fact, much of their diagnosis is based on such ’keyframes’. There has been considerable work on automatically interpreting 2D coronary angiograms using a variety of methods [4, 3] including filter based methods (derivative-based filter [1], matching filter [8], etc.), deformable models, and learning-based approaches (Neural Network [6], Support Vector Machine [6] etc). Much of this work has focused on vessel tree extraction and characterization of stenosis. They have been tested in point-of-care diagnosis scenarios on images depicting the vessels, as chosen by clinicians. In this paper we address the problem of selecting frames in an angiography sequence that depict the coronary vessels with maximum visibility, which we call, ’keyframes’. This will not only eliminate unnecessary processing of a large 1051-4651/10 $26.00 © 2010 IEEE DOI 10.1109/ICPR.2010.975
number of video frames from databases, but also help focus subsequent analysis of vessel extraction and characterization on relevant images that actually depict such vessels. The key idea in our paper is to use a measure of vessel visibility and track its evolution within the sequence. Peaks in the trajectory are then chosen as the key frames of the sequence. To our knowledge, this is the first paper to address the key frame selection problem in angiography videos. While there is much work on shot detection and key frame selection for general videos [7, 11], they are not particularly applicable to angiography videos as the images have predominantly low intensities with roughly the same intensity histograms regardless of the content being depicted (background or vessels). Further, the subtle ’waxing’ and ’waning’ transition in the visibility of vessels is difficult to capture with existing shot boundary detection algorithms[7] that expect sharp changes (due to camera angle change).
2. Measuring vessel visibility To accurately measure vessel visibility in each frame, we explore two methods, (a) the Frangi filter [1], a popular approach to vessel extraction, and (b) a new vessel extraction method from edge maps by detecting explicit tubular structures in curves. In both cases, we derive a single vessel visibility measure per image whose value will then be tracked over the angiography sequence. We then compare the impact of using the different vessel extraction methods in the quality of the key frames selected.
2.1
Vessel visibility using Frangi filter
The Frangi filter is a popular filter to extract vessel structures in coronary angiograms [1]. It uses the eigenvectors of the Hessian to compute the likelihood of an image region containing vessels or image ridges. Due 3992 4012 4008
(a)
(b)
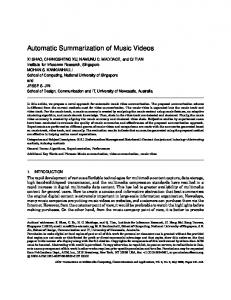
Figure 1. Illustration of the key frame detection problem in angiogram videos. The highlighted frames are the keyframes shown in red for the Frangi filter and green for parallel curves(the content is best seen at 200% zoom).
to the easy availability of its code, our first approach was to form a single vessel visibility number from an image obtained by applying the Frangi filter. The output of such filtered image is a grey scale image with brighter regions showing a higher probability of finding the ridge. Figure 3b shows the result of filtering the image of Figure 3a. As can be seen, the vessels have been delineated. However, in cases where there is no vessel depicted in an image, the filter can still find ridges although with not as much intensity. To avoid false positives, therefore, we apply a threshold to the Frangifiltered image and retain the bright regions. Specifically, Otsu’s thresholding [5] algorithm is applied to separate the foreground and background by minimizing the combined spread (intra-class variance) using the shape of the histogram of pixel intensities. The resulting thresholded image is shown in Figure 3c. The number of non zero-valued pixels in this binary image is then taken as a measure of vessel visibility.
2.2. Visibility using edge-based vessel extraction In addition to Frangi filter, we explored a new representation of angiography images by direct detection of tubular structures from edge images. For this, we first pre-process the image using a conventional edge detector (e.g. Canny edge detector). Since large intensity gradients are more likely to correspond to edges, a thresholding is applied at two levels to yield both weak (lower threshold) and strong (higher threshold) edges. We then extract curves from these edge maps using 8connected neighbors and tracing curves using depthH H first search between junctions. Let CH = {cH 1 , c2 , ...cN } be the curves formed from applying a low threshold. Similarly, let CL = {cL1 , cL2 , ...cLM } be the curves formed using a high threshold. Then starting from the curves
in CL , we retain all the curves from CH that contain the curves in CL . That is, we retain a subset CS ⊂ CH = L H {cH i |∃(x, y) ∈ ck &(x, y) ∈ c j }. This has the benefit of retaining long boundaries while still using edge strength to remove the background elements.
2.3. Extracting vessels using parallel curves Next, to detect tube-like vessel structures, we look for evidence of closely-spaced almost parallel curves[9, 2] among the retained curves. Formally, a parallel of a curve is the envelope of a family of congruent circles of a fixed radius centered on the curve. For vessel detection though, this definition has to be relaxed to accommodate occlusion, spurious interjections of curve fragments and convergence as the vessel narrows towards the end. Thus only approximate test of parallelism can be done and partial matches of curve fragments have to be allowed. We define the tubular structures as pairs of curve fragments ( f (ti ), g(t j )) over parametric intervals ti ∈ [T1 , T2 ], and t j ∈ [T3 , T4 ] that have a large number of consecutive points in shape correspondence. To determine shape correspondence, we use the positional information as well as the local shape around the features. In order to allow local shape distortions due to stenosis as well as convergent lines, we allow for gaps and insertions while still finding the longest possible pairs. To achieve this, we adapt the well-known technique of dynamic time warping used for time series matching [10] to find matching parallel curve fragments. The shape similarity needed for determining parallelism, as well as the constraints of maintaining a distance between the curves can be well-modeled in the distance function for alignment. Specifically, we consider a parametric representation of curves, and incorporate 4009 4013 3993
shape constraints into the distance function by considering each point along a curve as a four-dimensional feature f (ti ) = (x f (ti ), y f (ti ), θ f (ti ), ϕ f (ti ))
2.4. Keyframe selection To select keyframes, we analyze the trajectory formed by computing the vessel visibility measure in each frame of a video sequence. We detect peaks in this trajectory as points {l j ,V (l j )} where V (l j ) > V (l j − 1) and V (l j ) > V (l j + 1). on Then all peaks are ordered using the vessel visibility measure values V (l j ). Based on the observation of a large number of angiographic sequences, a minimum separation of at least 5 frames is desirable for key frames. In our experiments, we retained peaks that were within 80% of the strongest peak as the selected key frames.
(1)
where x(ti ), y(ti ) are pixel coordinates of the points along the curve and θ (ti ) is the included angle at the point by treating it as a corner with the adjacent pixels, and ϕ(ti ) is the orientation of the bisector of the include angle giving the local orientation at that pixel. Using the included angle ensures that narrow curvature points are not matched to wider curvature points. Similarly, orientation of the bisector ensures that the convexities do not match to shape concavities. To find matching points on candidate curves that represent parallelism, we form a dynamic programming matrix H where the element H(i, j) is the cost of matching up to the ith pixel along curve f (ti ) with the jth pixel in the curve g(t j ) as Hi−1, j−1 + d( f (ti ), g(t j )) H + d( f (ti ), 0) H(i, j) = (2) i−1, j Hi, j−1 + d(0, g(t j ))
3. Results We now present results of keyframe selection on a large database of angiogram sequences. The database was assembled from actual angiogram sequences recorded in a cardiac catheterization laboratory in our area. This data set depicts patients with various forms of coronary artery disease. Each angiogram study consists of several sequences called runs. Each run depicts the examination of a different vessel (e.g., left main, right coronary artery). In a typical study, there are 20-25 runs, with each run consisting of 15-120 images depending on the complexity of the arteries being shown and their pathology. In our database we have a collection of over 210 video sequences for a total of 5250 images. We first illustrate the extraction of vessels using the new approach. Fig. 3a shows the original image. Fig. 3d shows the fine edges using a low threshold (CH ). Fig. 3e shows the result of parallel curve detection using dynamic time warping. The highlighted points are those found to be matching to the respective parallel curves. Finally, Fig. 3f shows the set of retained curves CR that contain the tubular structures. These curves are retained for computing the vessel visibility. Comparing Fig. 3c with Fig. 3e, it can be seen that our measure not only highlights the vessels as well as the Frangi filter, but also results in accurate localization of vessel boundaries which can be helpful for stenosis characterization in the future.
with initialization as H0,0 = 0 and H0, j = ∞ and Hi,0 = ∞ for all 0 < i ≤ K, and 0 < j ≤ M, where M and K are the lengths of the candidate curves. The shape constraints for matching are incorporated in the term d(.). Here the first term d( f (ti ), g(t j )) represents the distance of feature point f (ti ) to feature point g(t j ). The second term d( f (ti ), 0) represents the choice where no match is assigned to feature f (ti ). The number of matching pairs of points between the curves is then determined by a diagonal tracing of the dynamic programming matrix (similar to finding longest common subsequence of strings). The distance d( f (ti ), g(t j )) is then given as the Euclidean distance between the two fiducial points using the 4 parameters as d( f (ti ), g(t j )) = q (x f (ti ) − xg (t j ))2 + (y f (ti ) − yg (t j ))2 +(θ (ti ) − θ (t j ))2 + (ϕ(ti ) − ϕ(t j ))2 ∞
if
q (x f (ti ) − xg (t j ))2 +
2 (y f (ti ) − yg (t j )) ≤ λ1 θ (ti ) − θ (t j ) ≤ λ2 ϕ(ti ) − ϕ(t j ) ≤ λ3 otherwise
(3) The thresholds (λ1 , λ2 , λ3 ) are determined through a prior learning phase in which the expected variations per vessel class is noted. We try all pairings of curves of length m in CS with a high H resolution curves of length n cH i in C and retain those with high score of H(m, n) as parallel curves. Thus the final set of curves retained to generate the vesselness measure is given by H H H S S CR = CS ∪ {cH i |ci ∈ C &ci ||c j ∈ C }, where the symbol || denotes the parallelism relation between the two curves. Using only curves that are within a distance of separation δ , the complexity of the parallel curve detection is kept linear in the number of curves CS . Typically, CS and hence CR is less than 200 while CH can be over a 1000 curves, thus resulting in a great reduction in the number of curves that are retained. Finally, the vessel visibility measure V (l) for image frame I is simply the number of retained curves given by V (l) = |CR |.
(a)
(b)
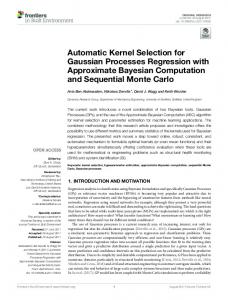
Figure 2. Comparison of vessel visibility trajectories using Frangi filter versus edge-based tubular vessel detection. Next, we illustrate the selected keyframes using the peaks in the vessel visibility trajectory. Fig. 1a and b show two angiography sequences, depicting the RCA (right coronary artery) and LAD (left anterior descending artery) respectively. 4010 4014 3994
Method Edge Frangi
Total Runs 210 210
Total frames 5250 5250
frames selected 820 1534
%age overlap 90.8% 76.2%
Avg. frame distance 1.8 4.2
Table 1. Evaluation of key frame selection. The vessel visibility trajectories using the two methods of vessel extraction are shown in Figure 2a and (b) and correspond to the runs shown in Figure 1a and b. The trajectory obtained by using the Frangi filter is shown in red while trajectory from tubular edges is shown in green in case of each run. Again, the set of frames determined to be keyframes using the vessel visibility trajectory from Frangi filtered images is shown by the frames highlighted in red. The set of keyframes determined using our edge-based vessel extraction algorithm are shown highlighted in green. As can be seen, our method detects fewer background images as keyframes, while still retaining frames with high vessel visibility.
Figure 3. Illustration of vessel extraction. (a) Original Image (b) Frangi filtered image (c) Thresholded Frangi image, (d) Fine edge map with low threshold (e) Parallel curve detection starting from the strong curves of d; (f) Extracted vessels using edge-based parallel curves.
3.1. Evaluation of key frame selection To evaluate the accuracy of key frame selection using both approaches, we conducted the following experiments. We made storyboard pages of the frames of an angiography sequence HTML (Fig. 1). We asked three cardiologists to mark the frames in the sequence that they would use for examining the arteries. Next, we showed the cardiologists our selected frames via the highlighting. We evaluated the accuracy by (a) noting the fraction of runs for which our key frames annotated contained the consensus cardiologist-selected frames, and (b) the average distance between our identified frames and the cardiologists annotated frames in case of a mismatch. The results are tabulated in Table 1. As can be seen, the number of keyframes selected is substantially smaller than the total number of frames, although our vessel extraction method results in fewer frames (84.4%=100-(820/5250) compared to 70.8%= 100-(1534/5250) using Frangi filter-based vessel extraction. The keyframes selected by our algorithm contain a physicianidentified frame in 90% of the cases, and in case of misses, our key frames were within 2 frames of the physician-identified frames. Thus we conclude that our vessel extraction based on parallel curve detection gives keyframes of both higher precision and higher recall while still achieving the goals of significant data reduction.
[2] H. H. S. Ip and W. H. Wong. Detecting perceptually parallel curves: criteria and force-driven optimization. Comput. Vis. Image Underst., 68(2):190–208, 1997. [3] C. Kirbas and F. Quek. A review of vessel extraction techniques and algorithms. ACM Comput. Surv., 36(2):81–121, 2004. [4] D. Lesage, E. Angelini, B. I., and G. Funka-Lea. A review of 3d vessel lumen segmentation techniques: Models, features, and extraction schemes. Medical Image Analysis, 13:819–845, 2009. [5] N. Otsu. A threshold selection method from gray-scale histogram. IEEE Trans. Syst., Man, Cybern., 9(1):62– 66, 1979. [6] R. Perfetti, E. Ricci, D. Casali, and G. Costantini. A cnn based algorithm for retinal vessel segmentation. In ICC’08: Proceedings of the 12th WSEAS international conference on Circuits, pages 152–157, Stevens Point, Wisconsin, USA, 2008. World Scientific and Engineering Academy and Society (WSEAS). [7] D. Ponceleon, A. Amir, S. Srinivasan, T. SyedaMahmood, and D. Petkovic. Cuevideo: automated multimedia indexing and retrieval. In ACM Multimedia, page 199. ACM, 1999. [8] Y. Sato, S. Nakajima, N. Shiraga, H. Atsumi, S. Yoshida, T. Koller, G. Gerig, and R. Kikinis. 3d multi-scale line filter for segmentation and visualization of curvilinear structures in medical images. page 143C168, 1998. [9] D. Shen, H. H. S. Ip, and E. K. Teoh. Affine invariant detection of perceptually parallel 3d planar curves. Pattern Recognition, 33(11):1909–1918, 2000. [10] T. Syeda-Mahmood, D. Beymer, and F. Wang. Shapebased matching of ECG recordings. IEEE EMBC, pages 2012–2018, 2007. [11] A. Vadivel, M. Mohan, S. Sural, and A. K. Majumdar. Object level frame comparison for video shot detection. IEEE Workshop on Motion and Video Computing, 2005.
4. Summary In this paper, we address the problem of key frame selection in angiogram videos using two different methods of vessel extraction. We show that the tubular curve method gives keyframes of higher precision and recall than those derived from the Frangi filter.
References [1] A. F. Frangi, R. F. Frangi, W. J. Niessen, K. L. Vincken, and M. A. Viergever. Multiscale vessel enhancement filtering. In Medical Image Computing and ComputerAssisted Interventation ł MICCAI98 (1998), pages 130– 137. Springer-Verlag, 1998. 4011 4015 3995