Automatic Synchronization and Segmentation of Heart Sound Signals Based on their Continuous Average Energy Maamar Ahfir (1) and Izzet Kale (2) (1)
Department of Informatics, University of Laghouat, BP: 37G, Laghouat, ALGERIA, Email:
[email protected]. (2) Applied DSP and VLSI Research Group, Department of Electronic Systems, University of Westminster, 115 New Cavendish Street, London, UK. Email:
[email protected]
Abstract - In this paper, an automatic method for heart sounds signals synchronization and segmentation is proposed. This is based on their continuous average energy rather on Shanon energy. Results for a database of adult patients, including normal and abnormal cardiac signals show a very high sensitivity of the algorithm performance. Keywords - heart sounds; countinous average energy; segmenattion ; sysnchronization; objective diagnosis.
I. INTRODUCTION Heart sounds signals which are captured by physicians from patients in primary health care settings (4 or 5 conventional chest areas) can be stored and analysed for possible alternative auscultation. Their synchronization and segmentation are still challenging phases for automatic and objective diagnosis. Phonocardiograms interpretation is mostly based on Shanon Energy [1], [2], [3], [4], because it emphasizes the medium intensity signals and attenuates the high intensity signals. This tends to make medium and high intensity signals nearly similar in amplitude, which makes the Phonocardiogram smoother for visual heart sounds localization (the first and the second heart sounds, S1/S2) and murmurs detection and classification. Early Decay Time of the normalized energy decay (EDT) for one single cardiac cycle is very promising objective criterion for possible pathology indication [5]. It can be calculated automatically in time domain, after only 10 dB or 20 dB decay of the normalized energy of the cardiac cycle signal for both systolic and diastolic components. Shanon energy is not needed in such operation, but a modified version, which is simply based on the square rather the logarithm function of the original signal, can be applied as an auxiliary signal, for synchronization and segmentation. The original cardiac signal has pseudoperiodic and non-stationary characters, as it can be seen from its auxiliary signal. That is, the continuous average energy of the original signal (envelogram). The pseudoperiodicity property of the autocorrelation function of the envelogram can be applied for one single cycle identification (period). The identified cardiac cycle segment
is divided into four components for corresponding EDT computing and comparison. These are the first heart sound S1, the second heart S2, systolic and diastolic segments. The continuous average energy is employed for this segmentation operation, because it is more suitable than Shanon energy for high peaks detection. Mostly, in non severe pathology signals, S1 and S2 have the maximum amplitudes [5], [6] (high peaks in the continuous average energy - envelogram) as compared to murmurs. The paper is organized as follows: a brief introduction is given in Section I. Section II describes the continuous average energy, which is applied on the original cardiac signal to deliver its envelogram, for synchronization and segmentation. In section III a physiological criterion is adopted for systolic and diastolic components classification. Results and comments are given in Section IV and Section V concludes the paper. II. COUNTINOUS AVERAGE ENERGY The continuous average energy is calculated every sample from fixed segments throughout the signal as:
, (1) where, is the sampled sequence with the sampling frequency Fe of the original signal, and N is the length in p second segment. Then the normalized continuous average energy is computed as follows:
, where, is the mean value of is its standard deviation.
and
(2)
The pseudo periodicity of the energy signal as shown in the example (Fig. 1) can be exploited for the period identification. It can be calculated as a difference of the indices of two consecutive peaks maxima of the autocorrelation function. This period which corresponds to the period of the original signal and represents the cardiac cycle duration, can be used for the heart rate calculation as:
6. 7.
8.
where
, (3) is the number of the heart beats per minute, and is the cardiac cycle duration in second.
Then, the first period signal (1st segment) which represents the first cardiac cycle can be identified by synchronization of the energy signal with the original signal. That is, from the index of the first detected high peak in the energy signal to the index of the next detected high peak after one period time, that is . And then consequently, all the other periods signals (cardiac cycles) are identified. The average of all the identified periods can be taken to improve the signal to noise ratio. The average cardiac cycle signal must be arranged in a format which includes the following four components: the first cardiac sound S1 segment, the second cardiac sound S2 segment, the systolic and diastolic segments. These are the basic components for further objective analysis and diagnosis, particularly EDT computing. III. SYSTOLIC AND DIASTOLIC COMPONENTS IDENTIFICATION The continuous average energy is calculated for one identified single cardiac cycle signal, resulting in two main lobes (Fig. 3). Their maxima are detected and boundaries are identified from zero-crossing of the energy signal. These are the parameters of S1, S2, systole and diastole segments. Physiological observations reported in [3], [2], [7], show that for normal heart rates of adult patients (60 to 100 beats per minute), the time interval between S2 and S1 (diastole phase) is greater than the time interval between S1 and S2 (systole phase). This criterion is adopted for systole and diastole segments identification and then S1 and S2 segments classification. The overall algorithm implementation can be briefly summarized as follows: 1. Giving a filtered original cardiac signal, , compute its envelogram as equation (1). 2. Normalization of equation (1) as equation (2). 3. Compute the autocorrelation function of . 4. Compute the period and the heart rate . 5. If the value of is normal then, identification of all the periods by synchronization of with
9.
,and segmentation to multi intervals, and compute their average period signal. Compute for the average period signal. Identify the maxima and indices of the 2 main lobes of and their boundaries, by the zerocrossing method. Synchronization of with the average period signal and segmentation of the later into 4 components, using the previous identified parameters. Classification of the 4 components into: S1, S2, systole and diastole segments, using the physiological criterion.
The algorithm performance can be evaluated using the sensitivity criterion, which is defined as follows:
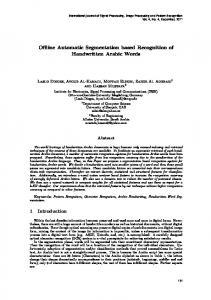
, (4) where is a variable true positive and is considered when a sound segment is correctly identified. is a variable true negative and is considered when a sound segment is not detected. IV. RESULTS Two different databases of 10 and 23 clean heart sounds recorded from adult patients are respectively available in [5] and [6] as mp3/wave files. All files were digitized with 16 bit resolution and 44.1 kHz sampling rate and down sampling later, to 11.025 kHz. They represent a total of 10 normal cardiac signals, including split of S1/S2, and 23 abnormal ones (pathologies), such as: regurgitation, stenosis, ventricular septal defect, mitral valve prolapse and gallop. Two (2) heart sounds representing respectively severe aortic stenosis and severe combined aortic stenosis with regurgitation (clinical grade 5 or 6), and one (1) other normal heart sound representing nearly only single S1 were all discarded from consideration of the algorithm performance evaluation. Because all the 3 sounds deliver one single instead of two main lobes in the envelogram (absence of S2), which makes the algorithm failed for correct segmentation. Fig.1 shows an example of abnormal cardiac signal of about 5 second of duration (typical duration of a valve auscultation), and its envelogram (with an optimum of p = 0,05second), representing then a mitral valve prolapse. The autocorrelation function of the envelogram (Fig. 2) is used for the period calculation, which is the difference between two indices corresponding to two consecutive peaks maxima, right or left the symmetry peak. Once the signal period is known, segmentation is processed and then all the segments with duration are identified and averaged to one single segment, representing one single cardiac cycle
(Fig. 3). The process of the continuous average energy is applied again on the single cardiac cycle segment (with an optimum of p=0,1second and a threshold of ), resulting in two main lobes (Fig. 3). The lobes maxima and boundaries are identified by zero-crossing method. The 4 components of one single cardiac cycle are segmented and classified, using the well known physiological criterion (Fig. 4 and Fig. 5). In Fig. 6, the normalized energy decay of the 4 components as classified into systolic and diastolic segments can be seen. Comparison of their EDT (20 dB decay) gives a difference equal to zero for diastolic segments (S2/diastole) and 60 for systolic segments (S1/systole). In an early cardiac diagnosis, this great objective value of EDT may indicate a first sign of pathology, which is located in the mitral valve.
identification and classification. Results for a database including normal and abnormal cardiac signals, and representing different possible pathologies which may affect adult patients, show a perfect sensitivity of the algorithm. This is very promising technique for a preliminary electronic implementation and then for an early objective screening of patients by primary health care physicians, or even by non-experts.
ACKNOWLEDGMENT The authors would like to thank the University Of Michigan Medical School for their very helpful heart sounds, which are evaluable in [6] and represent the most possible cardiac pathologies that may affect adult patients.
REFERENCES In the TABLE I, segmentation and classification results show a perfect sensitivity (100%) of the algorithm. The database was composed of normal cardiac signals and non severe pathology signals (clinical grade 4 and below), with a total of 30 heart sounds, excluding the 2 severe cases and the normal single S1 one. These were not considered during the evaluation of the algorithm because of the absence of the second heart sound S2. TABLE I.
SEGMENTATION AND CLASSIFICATION SENSITIVITY
%
Cardiac Signals Components Normals
Abnormals
100
100
S2
100
100
Systole
100
100
Diastole
100
100
S1
V. CONCLUSION An algorithm for automatic synchronization and segmentation of heart sounds signals is proposed. This is based on their continuous average energy, and without reference to an ECG. The well known physiological criterion is used for systolic and diastolic segments
[1] S.Choi and Z.Jiang, “Comparison of envelope extraction algorithms for cardiac sound signal segmentation”, Expert Systems with Applications 34 (2008), Sciences Direct, pp 1056–1069. [2] A.Moukadem, “Segmentation et Classification des signaux non-stationnaires, Application au traitement des sons cardiaques et à l’aide au diagnostic“, Thèse de Docteur de l’Université de Haute Alsace, France, juillet 2012. [3] Atbi A, Meziani F, Omari T and Debbal SM , “Segmentation of Phonocardiograms Signals using the Denoising by Wavelet Transform (DWT)“, Academia Journal of Scientific Research 1(3): 039-055, April 2013. [4] C.Ahlstrom, P.Hult, P.Rask, J-E.Karlsson, E.Nylander, U.Dahlstro and P.Ask, “Feature Extraction for Systolic Heart Murmur Classification“, Annals of Biomedical Engineering, Vol. 34, No. 11, November 2006, pp. 1666–1677. [5] M.Ahfir and I.kale, “A novel approach for heart murmurs detection and classification”, Electrical Engineering and Intelligent Systems, Springer, 2013. . [6] http://www.med.umich.edu/lrc/psb/heartsounds/ [7] D.Kumar, P.Carvalho, M.Antunes, P.Gil, G.Henriques and L.Eugenio, “A new algorithm for detection of S1and S2 heart sounds”, ICASSP 2006. Vol. II, pp. 1180-1183.
4 3 2 Amplitude
1 0
-1
0
1
2
3 Samples
4
5
6 x 10 4
Figure 1. Continuous average energy (red) – cardiac signal (blue) – p=0.05 sec 4
x 10 6 5 4
3 Amplitude
2 1 0
-1 0
2
6 Samples
4
8
10
4
12
x 10
Figure 2. Autocorrelation function of the envelogram 4 3.5
3 2.5
2 1.5 Amplitude
1
0.5
0 -0.5 -1 0
0.1
0.2
0.3
0.4
0.5 0.6 Samples
0.7
0.8
0.9 0.5
Figure 3. One single cardiac cycle signal (blue) and its envelogram (red) – p=0.1 sec and threshold of
10
0. 8 0. 6 0. 4 0. 2 Amplitude 0
0. 8 0. 6 0. 4 0. Amplitude 2 0
-
0.2 0.4 0.6 0 0.8
0.2
0.4
2
4
6 Samples
8
10
12 x
0.6 0.80
0.5
1
1.5
2 2.5 Samples
3
3.5
4 x
Figure 4. Systole segments (S1 in blue and systole in red) 0. 6 0. 4 0. 2
0. 6 0. 4 0. 2 Amplitude
0 Amplitude
0
-
-
0. 2 0. 4 0. 6
0. 2 0. 4
-
- 0
2
0. 8
4
6 8 Samples
10
6 12 x
0. 6 - 0 0. 8
1
2
3 4 Samples
6
5 x
Figure 5. Diastole segments (S2 in blue and diastole in red) 0
dB
1 0 2 -0 3 -0 4 -0 5 0 6 -0 7 0- 0 8 0
0
-
0.5
1
1.5 2 Samples
2.5 2 (a)
3
4 3.5
x
1 0 2 0 dB 3 -0 4 -0 5 -0 6 -0 7 -0 0 8 0
1
2
Figure 6. Normalized energy decay, systolic segments (S1 and systole) in (a) - diastolic segments (S2 and diastole ) in (b)
3 4 Samples (b)
5
3 x
6