This is the author copy of Automatic web accessibility metrics: where we are and where we can go. Interacting with Computers 23(2), 137-155. Elsevier available at http://dx.doi.org/10.1016/j.intcom.2011.01.001 Note that there might be some inconsistencies between this and the above publication so use this copy at your own risk.
Automatic web accessibility metrics: where we are and where we can go Markel Vigo
Giorgio Brajnik
School of Computer Science University of Manchester
Dipartimento di Matematica e Informatica Università di Udine
Kilburn Building, Oxford Road, M13 9PL Manchester, United Kingdom
Via delle Scienze 206. 33100 Udine, Italy
[email protected]
[email protected]
Abstract. The fact that several web accessibility metrics exist may be evidence of a lack of a comparison framework that highlights how well they work and for what purposes they are appropriate. In this paper we aim at formulating such a framework, demonstrating that it is feasible, and showing the findings we obtained when we applied it to seven existing automatic accessibility metrics. The framework encompasses validity, reliability, sensitivity, adequacy and complexity of metrics in the context of four scenarios where the metrics can be used. The experimental demonstration of the viability of the framework is based on applying seven published metrics to more than 1500 web pages and then operationalizing the notions of validity-as-conformance, adequacy and complexity. Our findings lead us to conclude that the Web Accessibility Quantitative Metric, Page Measure and Web Accessibility Barrier are the metrics that achieve the highest levels of quality (out of the seven that we examined). Finally, since we did not analyse reliability, sensitivity and validity-in-use, this paper provides guidance to address them in what are new research avenues. Keywords: web accessibility, quality framework, metrics, automatic assessment, automatic accessibility evaluation
1 Introduction Web accessibility metrics synthesize a value that is assumed to represent the accessibility level of a web resource, be it a single page, a set of pages or a website. Automatic metrics use data produced by automatic accessibility evaluation tools and automatically compute the final value. One could define “accessibility” with any of the existing definitions (Brajnik, 2008);; one choice is “the property of a site to support the same level of effectiveness for people with disabilities as it does for non-disabled people” (Slatin and Rush, 2003). In most cases, however, automatic accessibility metrics refer to a definition of accessibility based on conformance to a set of criteria. Accessibility metrics are important because they are used anytime one wants to compare two or more web resources;; this occurs, for example, when feeding accessibility observatories with data so that rankings of websites are produced, or when performing a quality assurance process that monitors accessibility of subsequent releases of a website, or when running a competition among web developers that also considers accessibility. Even when one performs a conformance review, for example using the Web Content Accessibility Guidelines 2.0 (WCAG 2.0, Caldwell et al., 2008), one applies a metric;; in this case its possible values are taken from the ordered set {“non- conformant”,“A”,“AA”,“AAA”}.
1
So far several accessibility metrics have been defined and used: some are totally automatic;; examples are WAQM, Page Measure, UWEM, etc. Others are totally manual (i.e. based on human judges who have to identify accessibility defects and synthesize a value);; for example the AIR metric used in the Accessibility Internet Rally organized by knowbility.org, based on a spreadsheet that computes global penalty points based on grading data supplied by judges. And finally, some are hybrid (i.e. based on data produced by tools, somehow later interpreted and graded by humans, and then synthesized into a value);; an example is SAMBA (Brajnik and Lomuscio, 2007). Automating the process of measuring accessibility has numerous advantages: first of all, it is a fast and easy way to obtain accessibility scores. Second, as no human intervention is required, the measurement process becomes affordable in terms of economic resources, making it suitable for processing large numbers of web pages or for producing real-time accessibility scores. Third, for the same reason it is a reliable process leading to reproducible results. However, there are drawbacks of automatic metrics as well. Since they are based on accessibility testing tools, they inherit some of their limitations. In fact testing tools are subject to low accuracy rates: they produce many false positives – i.e. warnings of non-existing problems – and they miss true problems – false negatives;; see (Brajnik, 2004) for a comparison. Metrics used (perhaps implicitly) to determine conformance (of a web resource to a standard) show an additional disadvantage. Consider, for example, that when applying EvalAccess and TAW (two of the many accessibility testing tools) on the home page of web sites like www.wikipedia.com and www.twitter.com we obtained 3 (priority 2) and 6 (priority 3) WCAG 1.0 (Chisholm et al., 1999) violations on the former site, and 42 (priority 2) and 45 (priority 3) on the latter. In addition to these automatically found apparent failures, both tools on both pages produce hundreds of additional warnings about possible violations. Based on such evaluations, and assuming that they are valid, the conclusion would be that both pages obtain an “A” conformance score. However, because of its low resolution, such a metric would not be suitable for determining if one site is more accessible than the other. In fact, a web page meeting all “A” level success criteria would obtain the same accessibility score as another page meeting all level “A” and almost all level “AA” criteria: both of them would get the “A” level conformance. Comparisons require a finer-grained scale, whose values reflect the accessibility status of pages. The existence of accessibility guidelines and success criteria that, on surface, appear to be well suited to automatic processing, and the existence of hundreds of tools that can apply these criteria, lure practitioners into thinking that accessibility is an objective property that can be measured in a reliable and valid way. In fact, this is not the case. As other studies have shown (Brajnik, 2009;; Alonso et al., 2010;; Brajnik et al., 2010) reliability and validity of conformance reviews run by humans (i.e. reproducibility and correctness of results) are far from optimal, even when accessibility experts are involved. Thus we are faced with a conundrum: on the one side we have quick reliable but potentially invalid ways to measure accessibility, on the other side we have expensive methods to evaluate accessibility, subject to a smaller degree of invalidity and unreliability, and other than conformance assessments, no ways to measure accessibility that are accepted by the research community and by practitioners. And yet there are many scenarios in which we need reliable and sound ways to measure accessibility. We think that the lack of evaluations of existing metrics and 2
criteria for deciding when to reuse them leads researchers to develop new metrics without addressing also the topic of evaluating them. Little is known regarding what exactly each automatic metric is measuring;; we do not even know how similar these metrics are. In this paper we address the quality problem of automatic web accessibility metrics. We present a framework supporting analysis of quality of the accessibility metrics, and then apply it to seven automatic ones. This framework includes quality attributes and application scenarios for accessibility metrics in addition to the identification of the key properties in each scenario. We expect the framework to be useful for people who want to evaluate or to design accessibility metrics. The findings we were able to produce could also be used to inform prospective users of metrics of some of their strengths and weaknesses. We also make our data available to others who might want to pursue additional studies.
2 Mapping accessibility requirements into application scenarios 2.1 Quality of Accessibility Metrics The main purpose of this paper is to explore how different metrics behave and find out which are the most adequate with respect to certain scenarios. In order to address this topic, we define a quality framework for accessibility metrics that is related to O’Donnell and Eggemeier’s (1986) work. They defined a set of properties that psychometric measurement tools should satisfy, including validity, reliability, sensitivity, diagnosticity, ease of use and implementation;; we adapted these to fit with the qualities that accessibility metrics should satisfy. − Validity. This attribute is related to the extent to which the measurements obtained by a metric reflect the accessibility of the website to which it is applied. It can be defined at least in two ways: how well scores produced by a metric predict all and only the effects that real accessibility problems will have on the quality of interaction as perceived by real users when interacting with real pages for achieving real goals. We will use the term validity with respect to accessibility in use when we refer to this sense. The second definition we will refer to characterizes validity in terms of how well scores mirror all and only the true violations of checkpoints/requirements of a given standard (for example, WCAG 2.0). This is validity with respect to conformance to certain guidelines. − Reliability. This attribute is related to the reproducibility and consistency of scores, i.e. the extent to which they are the same when evaluations of the same resources are carried out in different contexts (different tools, different people, different goals, different time). In this sense, we can identify two kinds of reliability: intra-tool and inter-tool. The former is related to how results change depending on the settings of the tool, which affect which pages are crawled and how guidelines are applied. The latter has to do with how reports produced by different tools differ when similar settings, and the same guidelines, are used. − Sensitivity. Sensitivity of a metric is related to the extent that changes in the output of the metric are quantitatively related to changes of the accessibility of the site being analysed. With a sensitive metric, small changes in accessibility of pages reflect in large changes of the scores. An ideal metric shows low sensitivity, in order to behave in a robust way against small changes in the input, which can be caused by many unexpected and uncontrollable factors. Too sensitive metrics lead to results that are dependent on small variations in the accessibility features or defects of pages, making comparisons very 3
difficult because score differences due to accessibility defects may be dominated by disturbance factors. Notice that reliability and sensitivity are related but are not the same thing: a reliable metric can show a high sensitivity if it gives very consistent results when applied to the same pages, but results would change dramatically when pages are slightly changed in terms of accessibility. − Adequacy. This is a general quality, encompassing several properties of accessibility metrics: the type of data used to represent scores (like ordinal WCAG conformance levels {“non-conformant”,“A”,“AA”,“AAA”} where distance between accessibility levels is not represented;; or ratio scales that include 0 and 1 and are based on the usual integer or rational numbers;; we are not aware of automatic accessibility metrics that use a categoric scales – unordered symbols like “yes” and “no” – or that use an interval scale – like the ones used for Celsius/Fahrenheit degrees);; the precision, i.e. the resolution of the scale (for example values in [0,1] or in {0,1,..., 10});; normalization, if the scale is or can easily be transformed to [0,1];; and finally actual distribution refers to the span covered by actual values of the metric (even if the scale is a certain range, for example [0,100], a metric could actually “use” only the central part of such a range). − Complexity. While some metrics are based only on the ratio between potential and actual failure-points1, others are more comprehensive since they need data such as number of tags and attributes of a page, type of the failure-point (automatically determined by the tool or needing manual checking to be confirmed), or severity of the problem. In this case, complexity can be defined as the internal complexity and is measured by the number of variables that are needed to compute it and the algorithmic complexity (time and memory requirements) of the algorithm computing it. External complexity indicates availability of tools that compute the metrics.
2.2 Usage scenarios and corresponding metrics requirements The purpose of this section is to map the quality attributes of accessibility metrics into application scenarios we identified after a literature review that are relevant for discussing accessibility metrics: Quality Assurance within Web Engineering, Benchmarking, Search Engines and User- Adapted Interaction. Three levels of fulfilment are defined for each quality attribute in the scenarios below: properties that must be fulfilled for the correct application of a metric to a scenario are marked as required (henceforth R);; when desirable (hereafter D) properties are fulfilled this leads to benefits in the application scenario, although failure to fulfil does not prevent the metric from being used in the scenario;; finally those properties that do not make a considerable difference are labelled as optional (O). For obvious reasons validity is always considered a required property a metric should have whereas low external complexity is desirable because it could facilitate the adoption and use of the metric by stakeholders. We now discuss which fulfilment levels we expect should occur within each of the four scenarios. 2.2.1 Quality Assurance within Web Engineering. Web accessibility is a property that enhances web quality: it is explicitly considered in web quality models driven by research (Mich et al, 2003) or implicitly cited as a subset of usability by those proposed by standardization organizations (ISO, 2001). When considering web accessibility from a quality control perspective there is a need for finer grades than just conformance ordinal 1
A potential failure-point is a feature of the we b resource that might be the location of an accessibility defect;; for example, any
4
levels, because developers or quality assurance testers can keep track of accessibility in the iterative development lifecycle. Moreover, in the era of Web 2.0 some authors (Olsina et al., 2008) propose to extend existing quality models not only by dealing with traditional quality attributes such as functionality, usability, reliability, efficiency or maintainability but also with content quality of rapidly changing sites, where “content quality” refers to properties like content adequacy, relevance and standardization level. In addition to focussing on content attributes, the fact that content is frequently updated/added by other users (“prosumers”), makes it even harder to monitor the overall quality of the web site, including accessibility. For these reasons, high quality automatic accessibility metrics could play crucial roles in quality management processes. In these scenarios we expect the following levels of quality attributes of metrics to be important. • Validity (R). While accessibility tests can be conducted throughout the iterative process of the development of accessible sites, testing is more effective in the early stages of development (Shelly and Barta, 2010) where poorly functional prototypes cannot be easily tested with users due to technical and logistical issues. As a result of this, we assume that validity with respect to conformance should be enough for engineering accessible prototypes. Obviously, validity with respect to accessibility in use would be better, but we believe that, at the moment, such a requirement is unfeasible. • Reliability (R). For a conformance based assessment at least two accessibility evaluation tools should be used according to the WAI (Abou-Zahra, 2010). Thus, reliability should address inter-tool inconsistencies as different values are expected because different tools have different guidelines coverage, implement guidelines in different ways and crawl a web site in different ways, resulting in different evaluation reports. • Low-Sensitivity (O). Even if the adopted metric is too sensitive, the consequences for those managing quality should not be dramatic, because as long as the metric is valid, changes in the metric will reflect changes in the underlying accessibility (although equivalent changes in terms of accessibility or conformance will have a different impact on the scores). • Adequacy. As long as the quality assessments are performed on similar systems (for example, different versions of the system under development), normalization (O) is not essential;; the nature of the scale should be ratio and precise (R) to support a fine distinction between levels;; the wider the distribution (R) the better it is. • Low-internal complexity (O). Computational complexity of the metric in terms of number of variables is unlikely to influence its usage, at least until it can be computed in reasonable time. Quality assurance processes gain advantage from interactive software, but response times in the range of some minutes should not be critical for such applications. 2.2.2 Benchmarking In countries that aim at fostering the inclusion of their citizens in the Information Society, policies have been promulgated so that users can access a barrier-free Web. While some of these policies are based on their own set of guidelines such as JIS (Japanese Industry Standards) or Stanca Act (Italian Accessibility Legislation)2, many others are based on WAI-WCAG guidelines. Because governments have to enforce the law and ensure that web pages meet their regulations, national 2
http://www.w3.org/WAI/Policy/
5
and international accessibility observatories are being developed, like the European Internet Accessibility Observatory (EIAO3) or the Vamola project in Italy (Mirri et al., 2009). These projects aim at keeping track of the accessibility level of pages and to do so they need accurate measurement methods and tools. The following levels of quality attributes should be important. • Validity (R). Even if the main objective of governmental policies is to foster accessible web pages they emphasize guidelines conformance. This is explicitly mentioned in some of the policies, and external audits do normally rely on automatic and expert testing leaving out or marginally considering end-users and user testing procedures. Thus, validity with respect to conformance would suffice in this scenario. • Reliability (R). Values produced by metrics should be consistent. This means that even if different tools are used, these should not introduce artefacts in the measured values. Inter- tool metric reliability would be demonstrated applying correlation analysis where strong correlation should be expected for the scores yielded by a number of pages using different tools. In addition, metrics should not be too dependent on small changes in the way the tool might crawl the web site (for example, small changes in the order in which links are processed which can lead to changes regarding which pages are actually processed or not);; this is especially important when the tool uses crawling algorithms based on random walks (Brajnik et al., 2007). • Low-Sensitivity (R) Because observatories are used to compare accessibility of sites or of groups of sites (like vertical sectors such as News, or by geographical areas), it is important that small changes in accessibility do not lead to large changes in the metrics, otherwise the rankings are likely to be highly variable and out of control. • Adequacy. Accessibility scores can be given either in a ratio or an ordinal scale as long as the resolution scale (R for precision) is suitable enough for a large and complex measurement process that supports comparisons over time and between many different websites. For the same reason a wider actual range is desired (D) and scores should be also preferably normalized. • Low-internal complexity (O). Observatories need to be able to run the monitoring software on chosen websites on a periodic basis, weekly or even monthly. Thus complexity of the metric is not a process bottleneck compared to other potentially limiting factors (such as the input bandwidth or storage capabilities). 2.2.3 Search engines In addition to the relevance of a web page with regard to a given query, search engines can make use of the accessibility level as a criterion to rank their results. For example, Google Accessible Search4 ranks higher those results that provide alternative text to visual content and render better for the visually impaired or blind users. Ivory et al. (2004) conducted a study with visual impaired users in order to find the factors that improve search engine results for them. They concluded that some users would like to know additional details about search results, such as whether retrieved pages are accessible to them or not. As a result, the authors recommend sorting results according to accessibility or usability criteria on the assumption that re-ranking results according to users’ visual abilities would improve their search experience. It is doubtful whether the trade-off of 3 4
http://www.eiao.net/ http://labs.google.com/accessible/
6
content ranking versus accessibility ranking is really worthwhile, given that making search results more or less easy to access in an automatic way without a direct input from users means decreasing the control they have on the system. A different solution would be if results are sorted by content relevance and each item can be labelled with its accessibility score that is, the results annotation scenario. Thus, the user would be free to decide to click on a search engine result. In any case, an automatic accessibility metric is needed. The following levels of quality attributes should be important. • Validity (R). Validity with respect to accessibility in use prevails in this scenario since it is end users who make use of accessibility values computed by the metrics. However, given that such accessibility scores have to be computed on the fly (and perhaps cached once they are computed), validity with respect to accessibility in use is unlikely to be feasible. To benefit from automatic accessibility metrics, validity with respect to conformance should be a first approach to validity. • Reliability (D). Even if different tools produce different accessibility values, when web pages are ranked according to these values or annotated with them, inter-tool reliability should be assured to guarantee a consistent user experience. However if the search engine uses a given tool, then inter-tool reliability becomes less important. Intra-tool reliability is more important in this scenario because by providing consistent results to users, it would help the user to understand what the system does. • Low-Sensitivity. The fact that small changes in accessibility reflect in large changes in scores would be an important drawback in this context. The consequence would be that a small change in accessibility can cause a big drop in accessibility rankings, reducing ranking consistency. Therefore low sensitivity is required for ranking purposes (R). Conversely, in the results annotation scenario low sensitivity is not so crucial (O) because rankings stay the same. • Adequacy. The nature of the scale could be even an ordinal one for the ranking according to accessibility ranking scenario (O), provided that users can easily make sense of such kind of scores used for annotating pages;; likewise, the metric does not need to be normalized (O), since its values are used only within the same application – search engine – and for the same purpose);; precision is desirable (D) and finally the width of the actual range (distribution) is also an optional aspect (O). Conversely, in the results annotation scenario the fulfilment of all properties is important (R): producing values in a determined range allows users to know the accessibility of a web page with respect to the rest of scores;; accurate results (precision) that spread out (distribution) are key to better compare a number of search engine results according to their accessibility score. • Low-internal complexity (R). Because accessibility scores are computed on the fly, complexity of the metric is an important factor. 2.2.4 User Adapted Interaction Adaptation techniques are believed to be effective ways to provide an accessible web environment for people with disabilities and the elderly (Kobsa, 1999;; Stephanidis, 2001). Adaptive navigation (Brusilovsky, 2007) could improve quality of the user experience of people with disabilities;; it potentially increases user orientation by providing guidance using different techniques such as link recommendation, non-relevant link hiding or link annotations. Leuthold et al. (2008) empirically validated application of these techniques by applying a set of accessibility 7
guidelines to text interfaces. They found that blind users performed much better for search tasks compared on WCAG compliant pages. Also design techniques were investigated for blind users: Goble et al. (2000) found that visually impaired users needed to be explicitly warned of obstacles while Harper et al. (2005) found that detecting and notifying users about barriers beforehand improves users’ orientation at a website. In this scenario, accessibility scores computed by a metric can be used as a criterion for an end-user to decide to follow a link or not. In fact, Vigo et al. (2009) explored link annotation with accessibility scores for the blind: they annotated links with the accessibility score of the page they pointed to. Users were more satisfied, performed better and found annotations to be helpful in determined scenarios. The following levels of quality attributes should be important. • Validity (R). Validity with respect to accessibility in use should be required since this is a user-centred scenario where accessibility scores are exploited by users when browsing the website. We believe that validity with respect to conformance is not sufficient. • Reliability (R): In such applications a single accessibility tool is likely to be deployed;; consequently inter-tool reliability should not be necessary. However, intra-tool reliability is desirable because inconsistent scores would be detrimental to user understanding and would undermine user trust on the modelling application. • Low-Sensitivity (R). High sensitivity would be detrimental to user understanding of the scores, since small changes in accessibility may lead to large changes in the scores that could result in a completely different interface arrangement. • Adequacy. Metrics used in this context need to produce values in a ratio scale;; but normalization would not be mandatory (O) because the accessibility level of a given link is only meaningful in relation to the rest of links in a page. The precision of the scale needs to be sufficient and adequate with respect to ease of understanding by end-users (D), and similarly for the width of the actual range or distribution (D). • Low-internal complexity (R). Depending on how and when the scores are computed and links or other widgets are annotated, complexity may become an important factor;; especially when scores are computed on the fly. Table 1 summarizes the requirements that metrics should fulfil in each scenario as discussed above. Table 1. Fulfilment levels of accessibility metrics requirements R stands for Required, D for Desirable and O for Optional).
QA within Web Engineering
Sufficient validity
Benchmarking
accessibility as accessibility as conformance conformance
Key reliability
inter-tool (R)
inter-tool (R)
Low-Sensitivity
O
R
ratio
ratio or ordinal
Adequacy Type of data
Search engines
User adapted interaction
accessibility as conformance
accessibility in use
intra-tool (D)
intra-tool (R)
R (rankings) O (annotations) ordinal (rankings)
8
R ratio
ratio (annotations) Normalization
O
D
O (rankings) R (annotations)
O
Precision
R
R
D (rankings) R (annotations)
D
Distribution
R
D
O (rankings) R (annotations)
D
O
O
R
R
Low internal complexity
The following sections will analyse several of the current automatic accessibility metrics to ascertain to what extent they meet the proposed quality requirements. The review focuses on a survey to assess both external and internal complexity, followed by an empirical study which assesses metric validity and adequacy. Finally we discuss how to deal with validity in use, reliability and sensitivity as well as proposing the means to address them.
3 Survey of Quantitative Accessibility Metrics Sullivan and Matson (2000) measured accessibility using the “failure-rate” (FR) between actual and potential points of failure of a subset of 8 checkpoints from the WCAG 1.0 set. While the failure-rate is adequate to quantitatively measure accessibility with regard to conformance (conformance requires a failure-rate equal to 0), it raises some concerns for measuring accessibility since more accessibility barriers entail less accessibility, but this metric does not reflect that. In fact, consider the example of a page with 10 pictures missing an appropriate textual description out of 100;; it would lead to FR = 0.1 while a second page with 5 images out of 25 without a proper text would lead to FR = 0.2, i.e. worse in terms of failure-rate. However, all things being equal, in the first case there are 10 possible barriers against which users may struggle, whereas in the latter case there would be only 5, despite a higher failure-rate. According to this argument, the failure-rate is a way to measure how good developers were in providing accessibility features. In the work by Sullivan and Matson, fifty web pages were automatically and manually evaluated and, based on their scores, they were ranked in order to be classified in four tiers (highly accessible, mostly accessible, partly accessible and inaccessible). The same procedure was followed after the pages were automatically evaluated by LIFT Online tool with respect to usability, where each problem was weighted by a four point severity scale provided by LIFT. Pages were ranked according to their score and were classified again in 4 tiers. In order to explore the relationship between rankings obtained by accessibility and usability measurements, a correlation was calculated obtaining a low but significant value (Spearman’s rho = 0.2, p < 0.05). Results thus suggest there is a low relationship between usability and accessibility when pages are ranked according to the scores obtained following such a method. González et al. (2003) developed KAI, which stands for “Kit for the Accessibility to the Internet”, a set of applications aiming at enhancing the accessibility of web pages for visually impaired users. In the context of KAI, an application to measure the accessibility level of web pages was developed so that users could be aware of the accessibility level of pages beforehand. Numerous metrics are defined with regard to WCAG 1.0 checkpoints: for instance, two metrics for 9
checkpoint 5.3 are: percentage of tables with summaries and percentage of tables with descriptive summaries. Besides metrics leading to percentages, there are also other ones yielding absolute number of items, such as the number of colours used as background, as mentioned by WCAG 1.0 checkpoint 2.2. In addition, a normalized overall accessibility value is calculated using the Web Quality Evaluation Method, Web-QEM (Olsina & Rossi, 2002). KAI makes use of the Logic Scores Preferences (LSP) method, an aggregation model to compute a global score from intermediate scores that are based on failure-rates or absolute number of accessibility problems. LSP is formulated as follows: where evaluation results produced by individual metrics are a set of normalized scores E1,..,En, where 0≤Ei≤1. When evaluated components have a different impact, a non-null convex set of weights W1,..,Wn are associated to each individual evaluation result, where 0 ≤ W i≤ 1 and !Wi = 1 .
(
! (d )
E = W1 E 1
+ .. +Wi E i
! (d )
! (d )
+ .. +Wn E n
)
1
! (d )
Values of exponents ρ(d) are defined elsewhere (Dujmovic, 1997) and they are selected on the basis of whether the required logical relationship between scores are fuzzy conjunctions or disjunctions. The fact that the metric is automatically computed and that feedback was provided by visually impaired users during the development of the project are the strong points of this approach, despite the opacity of its full definition. Fukuda et al. (2005) proposed two accessibility metrics for blind users: navigability and listenability. The former takes into account broken links, correct usage of headings and fast navigation mechanisms such as “skip-links”, adequate labelling of controls in forms and whether tables are not used for layout purposes. In addition they automatically estimate the reaching-time to a given element in a web page and a ratio between page size and reaching time is also considered in navigability. Listenability considers the existence and appropriateness of alt attributes, redundant text and how Japanese characters are arranged so that pages can be adequately be read by screen readers. Both metrics are automatically produced by the aDesigner tool (Takagi et al., 2004). Yet, there is no discussion of validity of such an approach and the way metrics are calculated is not revealed. Bailey and Burd (2005) used tree-maps to display/visualize the accessibility level of a web site. They claim that this information visualization technique is more interactive and easier to comprehend for web site accessibility maintenance. Each node within the tree represents a web page and it is visualized as an square, whose area corresponds to the inverse of value of OAM (Overall Accessibility Metric), as well as its colour (more saturated colours are used for less accessible pages). OAM is defined as: BcWc OAM = ! c N attributes + N elements where Bc is the number of violations found for checkpoint c and Wc corresponds to the weight of that checkpoint. There are four confidence levels depending on how certain is an evaluation tool when evaluating a WCAG 1.0 checkpoint: checkpoints labelled as certain weigh 10, high certainty checkpoints weigh 8, while low certainty ones weigh 4 and the most uncertain ones 1.
10
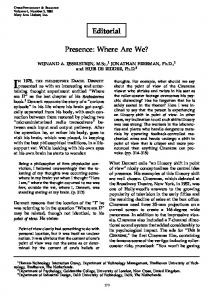
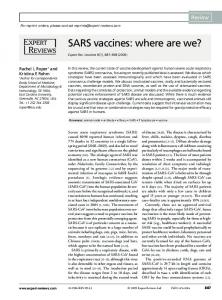
Later, Bailey and Burd (2007) proposed Page Measure (PM) in order to analyse the correlations between the accessibility of websites and the policies adopted by software companies regarding usage of Content Management Systems (CMS) or maintenance strategies. Page Measure is defined similarly to OAM, but weights correspond to checkpoint priorities as it can be observed in the formula: Bc ! priority c c Page ! Measure = !where ! priority c " {1,2,3} N attributes + N elements Hackett et al. (2004) proposed the Web Accessibility Barrier (WAB) metric aiming at quantitatively measuring the accessibility of a web site based on 25 WCAG 1.0 checkpoints. On each page p, the sum of the failure-rate of each checkpoint divided by the priority of the checkpoint (1, 2 or 3) is used;; the value of a site is the arithmetic mean over its pages. By using WAB the authors conducted a retrospective study of web accessibility concluding that in the 1997-2002 period the accessibility level of web pages decreased. In addition they also found that the metric behaved similarly to machine learning techniques when classifying pages according to their accessibility (Parmanto and Zeng, 2005). 1 fr ( p , c ) WAB = ! ! N p p c priority c where fr(p,c) is the failure-rate of checkpoint c in page p and Np is the number of pages in a web site. The most important advantage of this metric is that it is automatically computed using an automatic evaluation tool. On the other hand, the range of values is not normalized and checkpoint weighting does not have solid empirical foundations (Petrie and Kheir, 2007). The Web Accessibility Quantitative Metric (WAQM) (Vigo et al., 2007) overcomes some limitations of these metrics (namely, lack of score normalization and consideration of manual tests,) by automatically providing normalized results that consider the weights of the WCAG 1.0 priorities, and by exploiting the information in the reports produced by the evaluation tool EvalAccess (Abascal et al., 2004). Evaluation reports are based on WCAG 1.0 but WAQM also provides an accessibility value for each WCAG 2.0 guideline (Perceivable, Operable, Understandable, Robust) since results are mapped through a correspondence table between WCAG 1.0 checkpoints and WCAG 2.0 guidelines5. Once WCAG 1.0 checkpoints are grouped by their WCAG 2.0 membership and their priorities in the WCAG 1.0, failure-rates are computed for each subgroup. As WAQM relies on reports yielded by automatic tools, checkpoints that can be automatically evaluated have a stronger influence on the final scores than the semi-automatic problems. Empirically obtained data shows that failure-rates tend to pile up close to 0 -see x-axis in Figure 1 where E are actual failure-points and T potential failure-points, and E/T is the failure- rate-, reducing effective discrimination among failure-rates (Arrue et al., 2005). This might happen because EvalAccess is not very strict in filtering out potential failure-points produced by noisy test procedures. Thus, a function to spread out these values is applied to the failure-rates. The ideal approach for this function is depicted by Figure 1 where a hyperbolic function assigns higher variability scores to low failure-rates.
5
Mapping available at http://www.w3.org/WAI/WCAG20/from10/comparison/
11
Figure 1. Ideal hyperbole
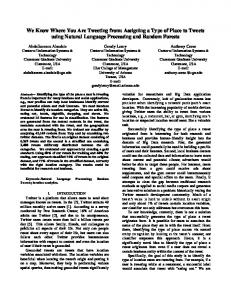
Figure 2. Approximation of the hyperbole
In WAQM the idea of the hyperbole is used but for simplicity it is approximated by two customizable straight lines (see Figure 2). If the failure-rate is less than the point x’, accessibility will be calculated using S line;; otherwise, V line is used. The two slopes and x’ depend on parameters a and b as follows:
a "100 E 100 E 100 S = 100 ! " V = a ! a " a" T b T b x’ point calculation S line formula V line formula By manipulating parameters a and b it is possible to adapt WAQM to a specific evaluation tool and obtain tool independence. Originally, WAQM was tuned to work jointly with EvalAccess (a = 20, b = 0.3) but Vigo et al. (2009b) proposed a method to tailor a and b to other specific tools. Results show that for scenarios requiring ordinal values (e.g., for ranking purposes) the tuning was not necessary because WAQM proved to be independent of the tool when conducting large- scale evaluations (approx. 1400 pages). When a ratio scale is required the proposed tuning method is successful to attain tool interchangeability. Sirithumgul et al. (2009) proposed the metric T1 that normalizes WAB and applied it to different user groups by selecting the subsets of WCAG 1.0 checkpoints that impact on the blind and the deaf. In the context of the Unified Web Evaluation Methodology6 (UWEM) a few metrics have been proposed during its development process. In the last version to date (June 2010), which is UWEM 1.2 (Velleman et al., 2007), the accessibility score of a page is the mean of the failure- rates produced by all checkpoints. ! B pt f ( p) = t ! N pt x! =
t
A3 (Bühler et al., 2006) is an extension of the UWEM 0.5 metric defined as
6
Available at http://www.wabcluster.org/
12
C pb
A 3 = 1 ! " (1 ! Fb )
b
where Fb represents the severity of barrier b (a barrier is a checkpoint violation) and Cpb is defined as follows, where Bpb and Npb, for page p, are the number of actual and potential failure-points of the checkpoint associated to b;; Bp is the total number of applicable checkpoints in page p.
C pb =
B pb N pb
+
B pb Bp
Later, Lopes and Carriço (2008) proposed the metric called Web Interaction Environments (WIE) where, given a set of checkpoints, vc is 1 if checkpoint c passes, and is 0 otherwise. WIE gives thus the proportion of checkpoints that are violated on a page.
WIE ( p ) =
!v
c
,!where ! n =! number !of !checkpoints n Table 2 summarizes the properties of the metrics described above, by focusing evaluation tool features such as guidelines coverage, targeted end-user group or guideline set, if it considers severity of the checkpoint violation, whether the metric produces normalized scores (key feature for adequacy) and tool support (crucial for external complexity). Table 3 enumerates the variables that are considered in each metric in order to assess the metric internal complexity. As previously mentioned, this property is defined in terms of variables required to implement a given metric. All metrics take into account actual failure-points although potential ones are not always considered. WAQM is the only metric that needs also the number of warnings (also called “manual tests”, that the tool assumes should be checked by a human judge). Weights are parameters that affect the computation of the metric and that are not derived from pages. Other variables refer to those variables whose value can be derived from each page. If we assume that weights cannot be easily obtained, according to Table 3, WIE and those relying on the failure-rate such as Sullivan and Matson, WAB, UWEM and T1 are the ones that are easier to use, PM requires some more extra processing compared to the aforementioned metrics due to other variables and A3, KAI and WAQM seem to be the most demanding ones because of their weights. Table 2. Characteristics of automatic web accessibility quantitative metrics where “x” means that the feature is not considered whereas “√” entails the opposite;; when the paper does not clarify whether the feature is fulfilled or not N/A is used. Features of the metric Is there tool support? Are scores normalized?
Sullivan and Matson
KAI
x
√
√
√
√
√
Fukuda et al. PM
UWEM WIE
T1
WAQM
WAB
A3
√
√
√
N/A
N/A
√
N/A
x
√
x
√
√
√
√
WCAG WCAG WCAG severity WCAG x x priorities priorities priorities function priorities WCAG WCAG WCAG WCAG WCAG WCAG WCAG WCAG WCAG WCAG Guideline-set 1.0, Sec. 1.0 1.0 1.0 1.0 1.0 1.0 1.0 1.0 1.0 508 Guideline 8 (12%) N/A N/A N/A 44 (68%) 25 (38%) N/A N/A N/A 15 (23%) Severity
x
√
N/A
13
coverage Are metrics focused on a user group?
x
blind users
blind users
x
x
any user group
x
x
x
Blind, Deaf
Table 3. Metrics and variables to assess metric internal complexity following the same notation than in Table 2 where “x” means that a feature is not necessary to compute a metric while “√” entails the opposite. Features of the metric
Sullivan and Matson
actual failure-points
√
potential failure-points
√
warnings
x
weights
x
other variables
x
KAI √ not always x ρ(d) values x
Fukuda et al.
PM
WAQ M
WA B
√
√
√
√
√
√
√
√
N/A
x
√
√
x
√
x
√
N/A
x
√
x
x
x
x
x
N/A
x
a, b
x
Fb
x
x
x
x
#elements #attributes
x
x
Bp
x
x
x
A3 UWEM WIE T1
4 Experimental Analysis A large scale experimental study was conducted in order to compare the behaviour of the following totally automatic metrics: the failure-rate of the guidelines proposed by Sullivan and Matson (2000) henceforth FR, Page Measure (Bailey and Burd, 2007), WAB (Parmanto and Zeng, 2005), A3 (Bühler et al, 2006), UWEM 1.2 (Velleman et al., 2007), WAQM (Vigo et al., 2007), and WIE (Lopes and Carriço, 2008). We did not include KAI (González et al., 2003) and the metric proposed by Fukuda et al. (2005) in this study due to the lack of implementation details. To ensure proper polarity, scores produced by WAQM have been reversed. Since we compare different metrics, the unboundedness of WAB and PM would disrupt the comparisons. For this reason we normalized them with respect to their maximum value (over all the pages). Since T1 basically normalizes WAB, results for WAB apply also to T1.
4.1 Goal of the analysis The purpose of the study is to understand how each metric behaves;; more specifically, we are interested in providing an answer to the following research questions: • Do metrics behave as expected? Do low accessibility pages get a low score and do highly accessible pages score high? (validity) • How does precision of metrics change? (scale of the metric) • How do metrics distribute the values in their range? (width of actual range) • Which ones do a better job in identifying truly accessible sites? (validity and sensitivity: discriminant power) • Is there a combination of metrics that is better suited at computing such a distinction? • Are there any differences due to taking into account manual tests in addition to automatic ones?
14
Validity, since a gold standard for accessibility is lacking, can be determined by examining the behaviour of a metric on sites that are known (or assumed) to be accessible and on sites that are presumed to be less accessible. We would expect that a valid metric would produce similar values for pages that are accessible, similar values for pages that are not accessible, and that these two sets of values be different. This indirect approach to validity estimation is called “convergent/divergent construct validity” (Trochim, 2006).
4.2 Procedure and automatic accessibility evaluation of pages A total of 1543 pages were downloaded and stored in a local server in order to keep them constant and metrics were calculated based on results produced by EvalAccess Web Service using WCAG 1.0 priority 1, 2 and 3 guidelines. Out of 1543, 75 pages originated from four websites which were presumed being highly accessible because they have traditionally been devoted to web accessibility (jimthatcher.com, w3c-wai, visionaustralia.org and rnib.co.uk). The remaining 1468 pages were fetched from 15 websites (approximately 100 pages per site in a breadth-first fashion starting from the home page). The rationale for choosing these 15 web sites was that we wanted to focus on news and university sites taken from different geographic regions (Africa, America, Europe and Oceania). Consider that in general for a given checkpoint EvalAccess may produce n automatic and m manual failure-points. From the 19 sites and the corresponding 1543 pages, EvalAccess found 2,682,168 potential failure-points, and 1,705,466 actual ones, with an average of 40 potential and 23 actual failure-points per checkpoint. For those checkpoints that can be automatically evaluated, the average number of potential failure-points is 129 (actual = 19), while for manual checkpoints, the average number of potential failure-points is 23.4. For each manual checkpoint EvalAccess produces exactly one warning for each potential failure-point;; we assumed a conservative stance, and for manual checkpoints we considered the number of actual failure-points to be the same as the number of potential failure-points. Table 4 gives the breakdown of the mean of actual and potential violations. We can notice that potential failure-points are more frequent for each WCAG 1.0 priority level, but the difference is especially large for priority 2. This is a consequence of the lack of accuracy (due to guideline ambiguity and expressiveness limitations to implement them) of EvalAccess tests that are used to implement priority 2 checkpoints. As a result there is a looser definition of what the tool understands for potential failure-point for priority 2 checkpoints compared with the rest of checkpoints and therefore more issues are produced. Over pages there is an average of 569 potential failure-points for automatic checkpoints (actual = 83), and 553 failure-points for manual checkpoints. Table 4. Mean number of failure-points per checkpoint. The column “Overall” reports the mean number of actual/potential failure-points split by type of checkpoint;; the remaining three columns give the means of actual/potential failure-points split by WCAG 1.0 priority level and type of checkpoint. Between parentheses the mean number of potential failure-points. M auto M manual Overall
Overall 19 (129) 23 23 (40)
Priority 1 37 (47) 15 16 (17)
15
Priority 2 20 (209) 22 22 (60)
Priority 3 8 (9) 48 38 (38)
4.3 Accessibility of pages Table 5 shows the number of potential failure-points per page for automatic tests, split by site and by priority levels. It can be noticed that the first five web sites – those with essentially no more than one priority 1 potential problem – compared to the last four ones show a large difference (at least 23 priority 1 potential problems, 34 priority 2 problems and 15 priority 3 problems). Table 5. Mean number of failed automatic tests per page, grouped by priority level and site, and actual number of violations found by manual inspection. site vaustralia wai cambridge rnib city jthatcher bolton kansas berkeley lancaster dundee nigeria smh calgary irish belfast pretoria outlook daily
Actual failure-points produced by automatic tests priority1 priority 2 priority 3 0 2.2 3 0 3 3 1 16.33 3.29 1 21.1 1 1.2 22.22 1.85 4 3.27 6.33 4.08 3.44 6.17 4.53 1.66 3.89 4.67 39.63 6.93 5.92 14.76 3.44 6.38 50.4 10.88 8.19 41.57 5.22 8.44 43.89 5.27 9.79 10.55 5.28 12 38.43 10.13 25.89 105.4 32.77 29.42 56.69 18.42 109.81 248.05 28.29 134.9 124.8 45.74
True violations produced by manual inspection priority 1 priority 2 priority 3 0 5 7 0 1 4 0 13 5 0 0 3 1 13 4 0 4 7 n/a n/a n/a n/a n/a n/a 3 6 2 n/a n/a n/a n/a n/a n/a n/a n/a n/a n/a n/a n/a n/a n/a n/a n/a n/a n/a 6 28 18 7 19 9 10 37 18 5 30 13
To test our assumption regarding accessibility status of these websites, we manually inspected two pages of the six top and four bottom web sites and an intermediate one. Following Nielsen and Tahir’s (2000) claim that homepage usability is predictive of the rest of the website, we manually evaluated the home page and a randomly chosen one, obtaining the number of checkpoint violations shown on the three right hand-side columns of the table. We can notice that in this case too there is a clear separation between the first six and the last four sites. Therefore we labeled the first six sites in Table 5 as “high accessibility”, the last four as “low accessibility”, and the remaining ones as “unknown accessibility”. The horizontal lines in Table 5 make this distinction between sites. Although our classification is based on data gathered by two judges (we, the authors) who independently inspected a small sample of pages, it is corroborated also by the totally objective data collected through the automatic tests of EvalAccess. We believe the classification is appropriate for the purpose of this paper. Other alternative ways to collect this kind of information (i.e., for deciding which sites are highly accessible and which are not) would require 16
setting up extremely expensive and complex experiments, due to the high level of subjectivity that is present whenever assessing accessibility, even by experts (see for example experimental data discussed in Brajnik (2009) and Brajnik et al. (2010)), due to the large number of pages to be evaluated and due to the subjectivity that affects also user testing experiments (Hornbæk and Frøkjær, 2008).
5 Analysis of results In this section we analyse to what extent metrics fulfil some of the properties we defined in the requirements section. Validity and adequacy in terms of precision and distribution of metric are thus assessed.
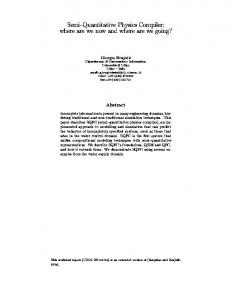
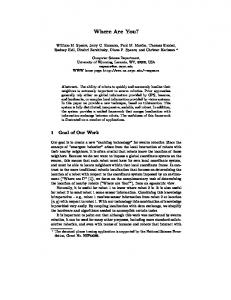
5.1 Distribution of Values and Precision of Metrics Figures 3 and 4 show the boxplots that represent the scores obtained by measuring all the 1543 pages, while Tables 6 and 7 provide the detailed values. A boxplot is a useful illustration of the distribution of a statistical variable;; the central box is delimited by the 1st and 3rd quartile;; the central thick line is the median;; the height of the box is the Inter Quartile Range (IQR), which indicates the variability of the data. Finally the horizontal lines below and above the box are located 1.5 times the IQR away from the box, and are used to identify outliers, cases that are far away from the centre and may be caused by abnormal events occurring when collecting or processing the data, or may signal abnormal cases in the data. It can be readily seen from the boxplots that the different metrics span different ranges. When considering both types of checkpoints, WAB, WAQM and PM have the largest actual range span, covering 0.88 or more of the normalized range although WAB and PM have a very small IQR < 0.09 making WAQM to stand out;; WIE and UWEM and FR produce the smallest ranges, not exceeding 0.48. The range is important because it tells whether the metric uses all the possible output values rather than squeezing all the results onto a smaller range. This quality is directly related to the distribution property when assessing the adequacy of a metric. In terms of IQR the largest one is for WAQM, at 0.34;; the other ones do not exceed 0.11. This means that 34% of the possible range includes 50% of the central observations. As far as distribution of values is concerned, the ideal metric should have a range close to 100% and an IQR close to 50%. When focussing on automatic checkpoints only (see Figure 4 and Table 7), then the best metrics in terms of actual ranges and IQR are UWEM and WAQM: they both have an actual range that exceeds 0.88 and IQR > 0.30 ;; WAB and PM have a wider range (> 0.99) but a smaller IQR (< 0.15). The ones that show a poor distribution of values are WIE (range width = 0), FR (0.40) and A3 (0.63). The boxplots tell us also that the medians are extremely different. Figure 4 and Table 7 show that the metric that is closer to having a large actual range (range width = 1.00) and IQR (range width = 0.5) for both types of tests is WAQM. The rest of metrics fail to meet this properties. When considering all the checkpoints (see Figure 3 and Table 6), the medians of FR, WAQM, WAB and PM are relatively close to each other (between 0.20 and 0.27);; the remaining ones are far away (UWEM at 0.95, WIE at 1 and A3 at 0.73). For automatic checkpoints only, the medians are somewhat more similar to each other, except for UWEM at 0.60, FR at 0.02 and WIE at 1. Finally, the distribution of values are slightly more symmetrical (for all the metrics) when using both kinds of checkpoints, compared to those based on automatic checkpoints only, which tend to 17
be negatively skewed (i.e., the distance between the median and 3rd quartile is greater than that of the 1st one, which indicates a histogram which has a longer left tail than right). This means that several of these metrics have 50% of the values that are squeezed on a very small range between 0 and the median, reducing thus the ability of the metric to clearly discriminate between pages with low values for the metric – which correspond to pages with high levels of accessibility. The exceptions are UWEM (which is positively skewed), WAQM (which is mostly symmetrical) and WIE (empty range). If we compare metrics to see what is the effect of considering manual checkpoints in addition to automatic ones, the larger effects can be seen on UWEM (the mean value drops from 0.58 to 0.94) and A3 (from 0.13 to 0.73). On the other hand, the most stable metrics are WAQM and WIE since their distribution is not markedly affected.
Figure 3. Distribution of mean values of the metrics over all the pages when computed on both types of checkpoints.
Figure 4. Distribution of mean values of the metrics over all the pages when computed on automatic checkpoints.
Table 6. Distribution of mean values of the metrics over all the pages when computed on both types of checkpoints. M SD min max Q1 median Q2 IQR range
UWEM 0.94 0.03 0.83 1 0.92 0.95 0.97 0.05 0.17
FR 0.26 0.08 0 0.48 0.21 0.27 0.31 0.09 0.48
WAQM 0.28 0.21 0 0.88 0.09 0.23 0.43 0.34 0.88
WAB 0.21 0.09 0.03 1 0.16 0.2 0.24 0.08 0.97
PM 0.2 0.08 0.02 1 0.16 0.2 0.24 0.08 0.98
WIE 1 0 1 1 1 1 1 0 0
Table 7. Distribution of mean values of the metrics over all the pages for only automatic checkpoints.
18
A3 0.73 0.11 0.28 1 0.68 0.73 0.79 0.11 0.72
M SD min max Q1 median Q2 IQR range
UWEM 0.58 0.19 0.11 1 0.42 0.6 0.72 0.3 0.89
FR 0.06 0.08 0 0.4 0 0.2 0.12 0.12 0.4
WAQM 0.29 0.21 0 0.88 0.09 0.25 0.43 0.34 0.88
WAB 0.14 0.1 0.01 1 0.06 0.11 0.21 0.14 0.99
PM 0.1 0.1 0 1 0.03 0.06 0.16 0.14 1
WIE 1 0 1 1 1 1 1 0 0
A3 0.13 0.08 0.01 0.64 0.06 0.14 0.2 0.13 0.63
The metrics that better distribute their values are PM, WAB, UWEM and WAQM. A3 and FR do not perform very well and neither does WIE because it is constantly equal to 1;; this happens because on each page each checkpoint has at least one violation. All metrics produce values in a fine resolution scale except WIE yielding only two scores, 0 and 1. 5.1.1 Similarities between Metrics Figure 5 shows the mean scores of pages in each site. The chart on the left depicts the behaviour of metrics (y-axis) in a site (x-axis) when all checkpoints are taken into account, while the right one only considers automatic checkpoints.
Figure 5. Average accessibility scores in each site considering automatic and manual accessibility problems (chart on the left) and just automatic ones (chart on the right). “LOW” marks low accessibility sites, and “HIGH” marks highly accessible ones.
Sites are sorted from left to right from those that belong to the low-accessibility group to those in the high-accessibility group. We can see that metrics produce rather different values and that they span different ranges, as already noted. Values of metrics tend to become closer when applied to 19
high-accessibility pages (except for UWEM and A3). This is especially true when focussing on automatic checkpoints, where the trend for each metric is decreasing, as expected. Notice, on the other hand, the larger variability that occurs on pages belonging to low-accessibility sites: metrics tend to diverge more when applied to low-accessibility pages. Determining similarity We carried out a correlation analysis for all the pages in order to ascertain how similar metrics are;; we used Cronbach’s α as a measure of similarity between metrics (alpha ranges from 0 to 1). On data from all checkpoints and highly accessible pages α = 0.66 (the 95% confidence interval is [0.60, 0.72]), which is a moderate value indicating that metrics tend to agree somewhat;; on low accessibility pages α = 0.29, c.i. [0.16, 0.41], which is a much smaller value indicating a very poor agreement. This shows that disagreement is higher when looking at low accessibility pages. When looking at correlations on only automatic checkpoints, for high-accessibility pages we get α = 0.59, c.i. [0.51, 0.67], and for those with low-accessibility, a slightly higher α = 0.65, c.i. [0.59, 0.71]. Thus, with automatic checkpoints only, agreement is slightly higher on low-accessibility pages;; however, because the confidence intervals overlap, we cannot generalize such a conclusion beyond our specific sample. A visual representation of which metrics are most similar to each other can be obtained through multidimensional scaling which produces two-dimensional charts that show metric closeness (see Figure 6). Metrics that are closely located can be understood as being interchangeable to some extent because they will produce similar results.
Figure 6. Closeness of metrics on all checkpoints (left) and on automatic ones (right);; arrows point from values computed on low accessibility pages to high accessibility (marked with a *)
From Figure 6 (left) it can be observed that the metrics behaviour changes when moving from low to high-accessibility pages;; A3 and WAB do not change much, whereas the largest changes are for WAQM, PM and UWEM. A large change suggests that the metrics distinguish the two kinds of pages. Notice however that PM and WAQM appear to be close on different kinds of pages. On
20
the other chart, dealing with data obtained from automatic checkpoints, we see that the differences due to low/high accessibility for WAB, A3 and UWEM are minimal.
5.2 Validity We analyse the way metrics should behave when measuring highly accessible and low accessibility pages and compare results with respect to the values we expect. When testing validity on highly accessible pages, a valid metric should show a small actual range, small IQR and median close to 0. On the other hand, when testing low accessibility pages it is expected that, a valid metric should show a small actual range, small IQR and median close to 1. 5.2.1 Testing validity on highly accessible pages We proceed now as in the previous subsection but this time only with pages that are assumed to be accessible. Figures 7 and 8, and Table 8 provide the results. In terms of ranges, when considering both types of checkpoints, the smallest ranges are produced by WIE, UWEM and WAB (not exceeding 0.19);; the largest ones are for A3 and WAQM (0.41 and 0.37). On automatic checkpoints only the smallest ranges are by WIE, PM, FR and A3 (not exceeding 0.19);; the largest ones are by UWEM and WAQM (0.72 and 0.37). Regarding IQRs, the smallest ones when considering all checkpoints are by WIE, UWEM, WAQM, WAB, PM (not exceeding 0.06), while the largest ones are by FR and A3 (0.13 and 0.11). When focussing on automatic checkpoints only, the smallest IQRs are by WIE, FR, WAB, PM (not exceeding 0.04);; the largest ones are by UWEM and WAQM (0.16 and 0.07). Finally, when considering all checkpoints, the medians of WAQM, WAB, PM and FR are below 0.20, whereas those of UWEM, WIE and A3 are greater than 0.64. On automatic checkpoints, the medians of FR, WAQM, WAB, PM and A3 are all less than 0.05, while those of UWEM and WIE exceed 0.5.
Figure 7. Distribution of mean values of the metrics over the accessible pages when computed on both types of checkpoints.
Figure 8. Distribution of mean values of the metrics over the accessible pages when computed on automatic checkpoints. As mentioned, ranges, IQRs and medians should be close to 0 although the IQR is more important
than ranges because in the latter the outliers can bias the results to a certain extent. 21
When all tests are taken into account WIE, UWEM and A3 stand out because of their high medians whereas the rest of metrics behave in more balanced and expected way. For automatic tests, WIE and UWEM again show a high median, reducing their validity. The remaining metrics perform quite well showing low values, especially FR and PM. The conclusion is that WAB, PM and WAQM behave as expected when considering both types of checkpoints;; on automatic ones also FR and A3 do so. Table 8. Distribution of range, IQR and median over the accessible pages.
all tests
UWEM FR WAQM WAB PM WIE A3
ranges 0.17 0.25 0.37 0.19 0.26 0 0.41
IQR 0.05 0.13 0.06 0.06 0.05 0 0.11
median 0.96 0.2 0.02 0.14 0.16 1 0.64
automatic tests
ranges IQR median 0.72 0.16 0.5 0.18 0 0 0.37 0.07 0.03 0.19 0.04 0.04 0.15 0.03 0.03 0 0 1 0.17 0.05 0.07
5.2.2 Testing Validity on Low-Accessibility Pages In terms of ranges (see Table 9 and Figure 9 and 10 for more details), when considering both types of checkpoints, the smallest ranges are produced by UWEM and FR (not exceeding 0.38);; the largest ones are for PM, WAB and WAQM (0.98, 0.90, 0.86). When we look at automatic checkpoints only, then the smallest ranges are by WIE and FR (0 and 0.25);; the largest ones are by PM, WAB and WAQM (0.98, 0.98, 0.86). Regarding IQRs, the smallest ones when considering all checkpoints are by WIE, UWEM and FR (not exceeding 0.05), while the largest ones are by WAQM and A3 (0.21 and 0.12). When focussing on automatic checkpoints only, the smallest IQRs are by WIE, FR, WAB (not exceeding 0.08);; the largest ones are by WAQM and PM (0.21 and 0.11). Finally, when considering all checkpoints the medians of WAB, PM and FR are below 0.27, whereas those of UWEM, WIE and A3 are greater than 0.78. On automatic checkpoints, the medians of WAB, PM, A3, and FR are all less than 0.25, while those of UWEM and WIE exceed 0.69. Table 9. Distribution of range, IQR and median over the low accessibility pages. UWEM FR WAQM WAB PM WIE A3
all tests ranges 0.14 0.38 0.86 0.9 0.98 0 0.64
IQR 0.05 0.04 0.21 0.09 0.08 0 0.12
median 0.93 0.28 0.43 0.24 0.23 1 0.78
automatic tests ranges 0.5 0.25 0.86 0.98 0.98 0 0.61
22
IQR median 0.14 0.69 0.05 0.12 0.21 0.43 0.08 0.24 0.11 0.24 0 1 0.06 0.21
When considering automatic and manual tests, WIE, UWEM and A3 show a good median, differently from PM, FR and WAB that are far from obtaining a satisfactory result;; only WAQM gets closer to them. When focussing on automatic tests, WIE and UWEM perform well although the distribution of values is very poor for the former (max = min = 1). WAQM has the next highest median and a fairly good IQR but fails to get a high range. WAB, PM, A3 and FR score very low medians. To summarize, UWEM, WIE and A3 behave as expected when considering both types of checkpoints;; when restricting to automatic checkpoints, only WIE and UWEM do so;; WAQM does not change much across checkpoint type, and lies in the middle.
Figure 9. Distribution of mean values of the metrics over the non-accessible pages when computed on both types of checkpoints.
Figure 10. Distribution of mean values of the metrics over the non-accessible pages when computed on automatic checkpoints.
In conclusion none of the metrics performs very well with both high and low accessibility pages as far as automatic tests are concerned. Those showing a good behaviour for high accessibility (FR, PM and A3) yield similar values for low accessibility pages. Similarly, those showing a good behaviour in low accessibility pages (UWEM and WIE) produce similar results for high accessibility pages. However PM, WAB and WAQM, even if they are far from being excellent, show a more balanced behaviour in both cases. When it comes to considering both types of checkpoints a similar phenomenon is observed: those that perform badly in highly accessible pages (WIE, UWEM and A3) are the ones that fit better for low accessibility pages due to their low variability. Conversely those that perform badly in low accessibility pages, behave adequately in highly accessible pages. 5.2.3 Discriminant Power While the previous section deals with behaviour of metrics on high a low accessibility pages, here we discuss how well a metric discriminates accessible from non-accessible pages. We restrict the analysis to only the high and low accessibility pages, excluding those for which the accessibility status is “unknown”. When considering both types of checkpoints, we have data for 275 high- 23
accessibility pages and for 380 low-accessibility ones;; when focussing on automatic checkpoints, the high-accessibility pages are 235 and the low-accessibility ones again 380. Since the distribution of the values of most of the metrics on such data is not normally distributed, we used more conservative non parametric techniques: the Wilcoxon rank sum test to compare medians and the bootstrap technique to compute confidence intervals (1000 replications). Comparison of the medians across the two levels of accessibility tells us if a metric produces values whose difference is statistically significant. There is a significant difference for each of the metrics due to the presumed level of accessibility when applied on manual and also on automatic checkpoints (for each metric, W > 26000, p < 0.0001). Figure 11 and 12 show graphically the 95% confidence intervals (c.i.) for the means of each metric;; The width of an interval represents the amount of uncertainty we have on the true value of the mean;; in our case the widths of the c.i. are very small and range from 0.5% to 3.9%. Table 10 provides the effect sizes for each of the metrics due to the different accessibility level. The effect size is the ratio of the difference between the means over the standard deviation;; when it is close to 0 it means that the practical implication of a difference is negligible, even though it is statistically significant. We can notice that effects are relatively large;; this is especially true for WAQM, with values greater than 3 under both conditions. Table 10. Effect size of the metrics
UWEM FR WAQM WAB PM A3
all tests
0.87
0.57
3.22
1.63 1.44 1.38
automatic tests
1.71
3.29
3.06
2.9
2.7 3.45
Figure 11. Means and confidence intervals on all checkpoints. Figure 12. Means and confidence intervals for automatic checkpoints.
It can be noticed that for almost all of metrics, values for accessible pages are located below the values obtained for non-accessible pages. This, together with the results obtained from the Wilcoxon test, means that all the considered metrics show a difference when applied to high vs. 24
low accessibility pages, both when using all the checkpoints or when using only the automatic ones. When considering all the checkpoints, we see that the confidence intervals of high- accessibility vs. low-accessibility pages are closer to each other for UWEM and FR, while they are farther away for WAQM. This means that WAQM does a better job of separating accessible from non-accessible pages. When looking at the automatic checkpoints only, we see that WAQM is the metric for which the two intervals are again farther away, followed by WAB, PM, UWEM, A3 and FR. We now would like to find out which metric is more suitable to classify pages as “highly accessible” or not. Logistic regression is a technique whereby one can fit a regression model to available data to estimate the probability of a binary outcome. In our case such a model can be used to estimate the probability that an arbitrary page belongs to the high accessibility group, based on values of each individual metric or even linear combinations of them. Since we know which page belongs to which group, we can determine which metric leads to a good model and if there is a combination of metrics that can be used jointly to reliably predict the accessibility level. The models we considered are: M_m
log(p/(1-p)) = B0+B1*m
M_best
log(p/(1-p)) = B0+B1*level
M_worst log(p/(1-p)) = B0+B1*random M_global log(p/(1-p)) = B0+B1*UWEM+B2*FR+...+B7*A3
where p is the probability that a page belongs to the high accessibility group, m is one of the metrics we studied, B0, B1,.., B7 are coefficients to be determined through regression from the data, level is the predefined classification of accessibility levels (“high” or “low”), random is a vector of random values. The models M_best and M_worst are included to provide reference values, since they represent the best classification rule that one can derive from the data (i.e. using the known levels of accessibility) and the worst one (based on random values, which are totally unrelated with pages). To assess which model fits better the data we used the Akaike Information Criterion (the smaller the AIC and the better is the fit);; as a decision rule we assumed that if p > 0.5 then the predicted group should be “high-accessibility”, otherwise “low-accessibility”. Finally, using this rule we classified each page and compared such predicted classification with the original a-priori classification. The χ2 test can be used to decide whether to reject the null hypotheses that the two classifications are independent or not;; Cohen’s φ coefficient can be used to represent how strongly associated7 the two classifications are (0 is the worst case, 1 is the best one). The accuracy rate is the proportion of classifications that are correct. When using data from both types of checkpoints, the χ2 test gave significant values for all the models, except for M_worst. This means that the classification of pages obtained from the value predicted by each of the models and the original ones are related, and this is not by chance (except for M_worst, where of course the random values are totally unrelated with the original classification). Table 11 provides the data for the different models when fitted to data, separately for both and only automatic checkpoints;;. Table 11. Accuracy rate and Cohen’s φ coefficient for each of the models, based on both types of checkpoints 7
Since we are comparing binary values normal correlation statistics cannot be used.
25
(column “all”) and only automatic checkpoints (column “auto”) all model best global optimal WAQM PM WAB UWEM A3 FR random
accuracy rate 1 0.99 0.99 0.96 0.88 0.68 0.74 0.68 0.67 0.52
auto φ model 1 0.97 0.97 0.91 0.75 0.36 0.47 0.35 0.34 0
best optimal global WAB A3 PM WAQM FR UWEM random
accuracy rate
φ
1 0.99 0.99 0.99 0.99 0.97 0.96 0.96 0.82 0.57
1 0.97 0.97 0.97 0.97 0.93 0.91 0.92 0.63 0.08
From Table 11 we can see that for data about “all checkpoints” that, as expected, the “best” and “worst” models provide the upper and lower bound for φ. Among the models based on single metrics, WAQM stands out providing a φ = 0.91, which is very close to the best one;; the accuracy rate is 96%. The worst behaving metric is FR, with φ = 0.34 and an accuracy rate of 67% (i.e. one third of the predictions are wrong). The global model (i.e. the one that is based on a linear combination of all the individual metrics) produces a φ = 0.7 (accuracy rate = 0.99), even closer to the maximum: this means that using all six metrics together leads to more accurate results than simply using the best one (WAQM). The “optimal” model is a model derived from the global one, simplified by removing one or more terms so that its predictive power is not significantly reduced. In our case the optimal model is the same as the global one, indicating that no individual metric should be removed from the model if we want to keep the same classification accuracy. Such a model is log(p/(1-p)) = -72.07-29.60*WAQM+123.33*A3-235.19*WAB-47.77*PM+17.93*FR+43.78*UWEM
When considering only automatic checkpoints, the best individual metric is WAB, followed by A3, PM and WAQM, yielding an accuracy rate that starts at 96%;; the worst metric is UWEM, whose accuracy rate is 82% although φ drops quite a bit. The global model reaches φ = 0.97. The optimal model, where UWEM has been dropped, reaches φ = 0.97 and is log(p/(1-p)) = 7.85-7.13*WAQM+90.64*A3-123.75*WAB-32.87*PM+23.32*FR
Obviously, these composite metrics (linear combination of individual ones) have the drawback of increased internal complexity.
6 Discussion As the previous section demonstrates the metrics we studied are different. Table 12 summarizes to what extent these metrics satisfy the properties of the accessibility metrics quality framework we introduced in Section 2. Results in section 5.2.3 show that when only automatic tests are considered all metrics except UWEM behave adequately as far as validity is concerned. After a deeper analysis (Sections 5.2.1 and 5.2.2) we found that WAQM, WAB and PM show the most balanced behaviour. When manual tests are considered only WAQM and PM have enough discriminative power. As a result WAQM and PM show the best behaviour (while not optimal) 26
and can be used under both conditions. WAB is only valid for automatic tests. The major drawbacks are the lack of normalization and not very good distribution of WAB and PM, and the internal complexity of WAQM. As a result of these limitations we believe that WAQM is more suitable in Web Engineering and Benchmarking scenarios whereas WAB fits better in Search engine and User adapted interaction scenario. Table 12. Fulfilment levels of accessibility metrics with respect to the requirements for automatic tests (√ indicates complete fulfilment, ~ denotes partial fulfilment and x entails no fulfilment).
WIE
A3
√ (not optimal) √ (not optimal) √ (not optimal)
x
x
x
√ (not optimal)
x
√ (not optimal)
x
x
√
√
√
√
√
x
√
Distribution of auto values both
√
x
√
~
~
x
x
x
x
√
~
~
x
~
Normalization
√
√
√
x
x
√
√
Validity (R) Adequacy
UWEM
FR
auto
x
x
both
x
Precision
Complexity
WAQM
WAB
PM
Internal
low
low
high
low
medium
low
high
External
x
x
√
√
√
√
x
Apart from validity, when considering the other quality attributes, we believe the following conclusions can be drawn: •
UWEM has no tool support although this can be easily overcome. It fits in all scenarios as long as only automatic tests are considered.
•
FR is the same as UWEM when it comes to complexity and implementation effort. Its low complexity and poor value distribution make it suitable for Search engines (rankings scenario) and User Adapted Interaction.
•
WAQM fits in all scenarios. Its weakest point is its complexity which could be a deterrent to be applied in Search engines and interface adaptation scenario.
•
WAB generally behaves very well in addition to be easy to implement. However, since its values are unbounded above (and thus not normalized unless all scores are known in advance so that they can be normalized with respect to the maximum value) it is suitable for the rankings scenario at Search engines, Quality Assurance within Web Engineering and User Adapted Interaction, but could be less suitable for the User Adapted Interaction scenario.
•
PM behaves in a similar way as WAB except that it is more complex. Thus the Information Retrieval and User Adapted Interaction scenario would be appropriate scenarios to deploy this metric.
•
WIE can hardly be used in any scenario due to its poor precision and poor distribution of values.
27
•
When all tests are considered A3 may be used in Search engines (rankings) and User Adapted Interaction scenario.
Note that validity is a very challenge property to measure. We have undertaken a initial approach to operationalize it. Additionally, reliability requires further analysis due to its complexity: different tools have to be used, with different settings and with different guideline sets. The next section gives some ideas about how to conduct the analysis of validity, sensitivity and reliability of accessibility metrics as well as describing some of the challenges one has to face when pursuing such goals.
7 The Challenges Ahead In this section we want to articulate a few possible research directions that we believe could help improving the quality of accessibility metrics.
7.1 Validation of metrics Although in this paper we suggest how to validate metrics, and show what kind of results can be obtained, the validation problem has many complex facets. We assume that validation is the most important quality criterion for metrics and therefore the most urgent issue to solve: an invalid metric produces in general values that are unrelated to accessibility. For automatic accessibility metrics, invalidity is related to impact on scores of false positives, of false negatives and of how scores are computed on the remaining true problems. The challenge in metric validation is that there is no “gold standard” with respect to which to compare the output produced by a candidate metric. First, accessibility, like usability, is much easier to be noticed when it is missing;; second, some accessibility problems can be explicitly noticed only when performing an accessibility evaluation, not during normal usage of a web site, with the consequence that only the effects of some of the accessibility problems can be noticed. This makes it very difficult to produce in a reliable way a single value that characterizes the level of accessibility. Interviewing end users and asking them to quantify the level of accessibility of a site/page is not appropriate, because of the role played by subjectivity and inability to produce such values;; for example, certain users are not aware of the accessibility problems they encounter (Takagi et al, 2009). Falsification testing (Woolrych et al., 2004) is an approach where potential false positives that emerge from an investigation, like a WCAG conformance review applied to a web site, are systematically tested to either confirm them or to build confidence that they are in fact false problems. Such an approach could be used, in principle, when validating metrics. The problem lies in the resources needed to pursue it systematically, over a large range of pages, with respect to a wide spectrum of types of problems and many user profiles. Among the two types of validity we introduced in Section 2.1, validity with respect to conformance is easier to be established. First, because it is independent from the validity of the guidelines being used. Second, it is conceivable that other, manual or hybrid metrics can be devised and used as a reference model. An example is the spreadsheet used by AIR (Accessibility Internet Rally) judges (see knowbility.org) where appropriate penalty points are subtracted when a site violates certain accessibility principle. In the end judges fill in such a spreadsheet for each candidate web site, and in such a way they obtain a numeric value which is related to accessibility. A second example is the hybrid approach of SAMBA (Brajnik and Lomuscio, 2007) where data provided by testing tools are sampled and manually evaluated by judges, obtaining in 28
such a way an estimation of the accessibility of the site with respect to certain user groups (low vision, blind, motor impaired, etc.). In addition to estimating an accessibility level, this approach produces also an estimation of the false positive error rate of the testing tool, which helps in interpreting the values produced by the metric. However, an important shortcoming of this approach is that it cannot cope with false negatives;; the SAMBA metric therefore always overestimates the level of accessibility of a site. Studies of validity with respect to conformance could focus on the following research questions, concentrating on factors affecting validity: 1. Does validity of the metric change when we change guidelines, using for example Section 508 requirements rather than WCAG 2.0? 2. Does validity change when we use a subset of the guidelines? 3. Does validity depend on the genre of the website? How dependent is validity is on content added by “prosumers”? 4. Is validity dependent on the type of data being provided by the testing tool? For example, what happens when only automatic tests are used and manual tests are simply dropped? 5. How good the tool is in extracting the correct information from Rich Internet Applications (RIA)? How much do variations of data acquired from RIA affect validity of the metric? 6. Does validity change when we switch the tool used to collect data? And what if we use data produced by merging results of two or more tools, rather than basing the metric on the data of a single tool? If validity can be enhanced by integrating more tools, then this would be a cheap solution to the problem of improving validity of metrics. 7. Are there quick ways to estimate validity of a metric? If not, then only complex and expensive experiments can be designed and run to find validity figures. Estimations could be based on error profiles of testing tools. In (Brajnik, 2004) the completeness and correctness of testing tools were operationalized: completeness relates to guidelines coverage and ability to capture all existing real problems (i.e. reduce the number of false negatives, real issues that were missed) while correctness characterizes a tool with respect of the number of false positives (found issues which are not real problems) that it produces. It was found that tools exhibited false positives rates between 0 and 21% for automatic tests, and between 11% and 32% of automatic or manual tests. Approaches like this one could be used to provide estimate of the validity of a metric, since by knowing which problems are false positives one could exclude them from computations;; and knowing which problems are typically missed by the tool would allow to reduce the computed accessibility levels. From a practical viewpoint, experiments could be set up and run to indirectly validate metrics and find answers to the above mentioned questions. For example, experiments based on indirect (i.e. convergent/divergent validity or face validity, (Trochim, 2006)) validation of metrics could be defined, extending the one we described in this paper by considering a panel of judges that would systematically evaluate all the pages using the same guidelines used by the tool(s). These experiments could provide well founded estimations of validity with respect to conformance of tested metrics. A challenge to be faced is the low reliability of human judges. The problem was recently investigated regarding WCAG 1.0 and WCAG 2.0 (Brajnik, 2009;; Alonso et al., 2010;; Brajnik et al., 2010);; it was found for example that on average 23% of the expert judges disagreed 29
on whether a WCAG 2.0 success criterion succeeded, failed or was not applicable;; expert evaluations were affected by 20% of false positives and 32% of false negatives. These results suggest that assessing conformance is far from being trivial, despite the existence of guidelines and principles that appear to be objectively formulated;; let alone accessibility. Another problem with this approach is the cost: to make sure that most of the accessibility problems are covered by judges, several experts are needed that have to evaluate many pages. A second approach to study validity could be based on the idea of artificially seeding web pages with known accessibility problems (i.e. violations of guidelines), and systematically investigate how these known problems affect the metric scores, drawing in the end some indirect conclusions about validity. This approach is definitely less expensive and complex than the previous one, but also less ecologically valid since results are heavily dependent on which accessibility problems are injected into which pages and how. The issue of manual tests, and their effect on validity, should also be explored more in depth. Automatic metrics can adopt two strategies in order to deal with them: (1) exclude them and only consider automatic violations or (2) estimating their effect. The former approach leaves out numerous accessibility issues thus introducing a bias in scores (over-estimation of accessibility). In an attempt to decrease such a bias, one could hypothesize that checkpoints that address the same accessibility issue will have a similar failure-rate, as indeed was found by Arrue et al. (2005). They discovered that when grouping WCAG 1.0 checkpoints according to their priority and WCAG 2.0 guideline membership a linear correlation was found between the failure-rate of automatic and manual tests. This was later reinforced by Casado-Martínez et al. (2009), who were able to predict the evaluation of 73% of manual tests. However their results were obtained from a sample of just 30 pages from two sites leading to no generalisable conclusion. A sound experimental verification of such a hypothesis would be one important research outcome, especially if it could lead to an understanding of which factors influence this link between automatic and manual checkpoints (for example, type of content, type of site, individual checkpoint). Validity with respect to accessibility in use, as mentioned above, is more complex to deal with. The main problem is that regardless of the guidelines/principles/rules used by the tool, we are focussing on whether the values produced by the metric reflect the accessibility of the web site. As we have seen in Section 2.2, some of the scenarios rely on this notion of validity. Open research questions in this case include: 1. Which factors affect this type of validity? For example, user groups (is the metric more valid in the context of blind people using screen readers or is it more valid for, say, motor impaired people?), type of data produced by tools, or type/genre of pages/sites? 2. Is it possible to estimate validity of the metric from other information that can be easily gathered in automatic ways or related to tool profiles? 3. Is validity with respect to accessibility in use related to validity with respect to conformance? What is the effect on such association of the specific guidelines being used? Does the type of site play a role? The most difficult challenge to be faced in performing these investigations is related to the fact that the values of the metric need to be related to the impact that accessibility problems could have on users when using the website. Several studies have shown that it is very difficult to reliably identify, in user testing experiments, the problems that users face. For instance Mankoff 30
et al. (2005) showed that the most successful method for developers not trained in accessibility was only able to find about 50% of actual problems. Additionally there was hardly any agreement on the severity rating of accessibility problems as found by Petrie and Kheir’s (2007). The work by Hornbæk and Frøkjær (2008) has shown that also for usability studies, identification of usability problems from observations of user behaviour is dependent on the evaluator. We already mentioned work by Takagi et al. (2009) showing that often end users are not aware of the accessibility problems they face while using web sites, ruling therefore out subjective assessments as an investigation method suitable for experiments aiming at validating metrics. Even if this problem could be overcome (for example by involving a large number of evaluators), from a practical viewpoint these experimental studies to be general enough should be based on many different pages/sites (to balance the effects that pages and contents might have), on different user platforms (operating system, browser, plug-ins, assistive technologies, to balance effects due to these factors), on users with different types and degrees of impairments and on users with different skill levels in using their platform and the web in general. Coping with these problems requires a very large effort. A viable approach could be incremental: first focus “on the small”, and perhaps start validating a metric with respect to blind people, experienced in using a specific version of a screen reader, while using few websites. Then move onto other user groups, until all the most representative user groups are covered.
7.2 Reliability We might expect reliability of automatic metrics to be relatively high, with very consistent results and small variability of accessibility scores. In fact this might not be the case because of several factors discussed below. The following are some of the research questions we think are relevant in this respect. 1. One factor is variability of results produced by different tools when applied to the same site. It is well known that accessibility testing tools produce different results when applied to the same site due to different guideline coverage and interpretation of guidelines. As a consequence we should expect these differences to reflect on differences on the scores. For example, Vigo et al. (2009b) discuss differences of the WAQM metric when fed with data produced by two different tools. After measuring more than 1300 web pages they found that scores produces by LIFT and EvalAccess evaluation tools were different although there was a strong correlation between the rankings of the scores. They concluded that providing the metric with tuning mechanisms (a and b variables in the case of WAQM) that are tool-dependent, tool reliability is achievable and similar scores were obtained. Additional studies are needed to characterize the variability of metrics as the tool changes. Ideally, metrics should be as independent from tools as possible, and show small variations when plugged to one or another tool. 2. Several tools are parametric with respect to guidelines. Therefore it makes sense to study the differences in the metric scores when metrics are fed with data produced by the same tool on the same web sites but when applying different guidelines (for example, WCAG 2.0 vs. Section 508). Also in this case we could hope that the best metrics are independent from the guidelines, and therefore be in a position to discuss quality aspects of the metrics by themselves. On the other hand, it may turn out that some metric is more tied to a guideline set than others, making it less trivial to characterize the quality of the metric alone, independently from the guidelines. Should we be able to safely assume that the 31
considered metrics are valid with respect to conformance, then we could reverse the problem and use valid metrics to evaluate and compare guidelines. For example, a possible result could be that using Section 508 requirements leads to significantly lower accessibility scores than when using WCAG 2.0, suggesting that Section 508 are somewhat stricter than the other guidelines. 3. Another research question is related to the effects of page sampling, a process that is necessary when dealing with large web sites or highly dynamic ones. If application of the metric is based on a stochastic process, whose outcome is by purpose non deterministic (like crawling processes based on random walks hypothesized in UWEM), then this variability is likely to reflect on the metric. An experimental study (Brajnik et al., 2007) was performed on 11 different crawling methods that were evaluated with respect to the effect that changes in the page sampling process have on WAQM, UWEM and the number of WCAG 1.0 checkpoints that fail, according to what an automatic testing tool produced. It was found that the sampling method may account for a worst case error of up to 20% of the scores of the metrics even when using relatively large samples. 4. Another facet to explore is to see if merging the data produced by two or more evaluation tools applied to the same site, and computing the accessibility metric on such data, leads to a metric that is more reliable than when applying data from a single tool only. 5. It would be interesting to see if reliability of a metric correlates with its validity. If so, then reliability could be used as an estimator for validity, which is much more complex to evaluate. To explore these questions, simple comparison experiments could be set up. For example an experiment to test the effects on a set of metrics of using two different testing tools, or two different guidelines. To explore the effects of sampling processes or of changing contents, experiments laid out as test-retest studies could be performed: the same tools could be launched on the same web sites at different times (after an hour, or a day, or a week) and see what differences this introduces on the metric values.
7.3 Sensitivity We have seen that in some scenarios low sensitivity of the metric is desired, to smooth changes in accessibility (for example, to avoid confusing end users). This should be particularly important in Web 2.0 applications, where content changes rapidly and there is no strict quality control on content. An interesting research question in this regard is to see if variability of the metric is dominated by low reliability. If it were so, for example, then changes in the metric due to small changes in content would be smaller than changes due to random sampling of pages, making it impossible to precisely monitor the accessibility of the site. If those changes are important, then the metric should be made more sensitive or, alternatively, more reliable. Experiments could be set up to perform sensitivity analysis: given a set of accessibility problems in a test website, they could systematically turned on or off, and their effects on metric values would be analysed to find out which kind of problems has the largest effect and under which circumstances. Alternatively, rather than turning on/off accessibility problems, one could systematically alter the variables used by the metric (for example, for the failure-rate metric, one could systematically 32
change, with a step of 1%, the number of potential failure-points and of actual failure-points), and from these determine the effects on the metric. Or, even better, one could devise metrics that can be tuned to achieve required levels of sensitivity.
7.4 Adequacy Provided that a metric is valid and reliable, the issue arises as to how suitable and useful its values are to users. For instance, are scores meaningful for users in the information retrieval scenario? What difference does it make for them claiming that a web page score is 54% or 57%? The research community should explore which approach (qualitative or quantitative) users prefer and which is more effective, and for which scenario. In Vigo et al. (2009), 16 blind users were queried about their preferences, no evidence was found as 50% preferred qualitative values over quantitative ones and vice versa.
7.5 Weighting Barriers for Tailoring Metrics to Users To the greater extent, accessibility guideline sets aim at covering most accessibility barriers. However, in guidelines such as WCAG or Section 508 not all checkpoints impact all users in the same way. Some checkpoints impact on several user groups, such as “use headings to structure documents”: it is a good practice for blind users since they can reach specific content by using screen readers shortcuts and it is suitable for the rest of users because they have a clearer overview of the page’s structure (Watanabe, 2007) (provided appropriate user agents are used to expose headings). However, the majority of checkpoints have different impact on different specific user groups. In order to tailor evaluation and measurement to the particular needs of users, accessibility barriers should be weighted according to the impact they have on determined user groups. For instance, following with the example of headings by Watanabe (2007), he found that the impact of the lack of headings was more severe for blind users. Guidelines may also have conflicting effects on different user groups. For instance, providing deaf users with embedded videos in Sign-Language may raise barriers for users whose screen readers might not be able to deal with Flash or Javascript components. Consequently, quantifying the impact of each barrier such as WCAG 1.0 priorities or WCAG 2.0 levels of success criteria for a universal user would not be accurate enough as demonstrated also by Petrie and Kheir (2007). As an aside, note that WCAG 2.0 levels are not a function of the expected impact that a violation has on end users, but of the ease with which the requirement can be met, how generally it can be met (across types of contents) and the limits that meeting it would pose on the look and feel8. Furthermore, considering users as member of groups with respect to their disability may not be a very accurate approach. User needs can be so specific that the effect of a given barrier is more closely related to his/her individual abilities and cannot be inferred from user disability group membership (Cassidy et al., 2005;; Vigo et al., 2007b). Individual needs may deviate considerably from groups guidelines (e.g., a motor-impaired individual having more residual physical abilities than the group guidelines foresee). For a more fine-grained approach, users’ interaction context should be considered, encompassing the Assistive Technology (AT) they are using, the specific browser, plug-ins and operating system 8
http://www.w3.org/TR/2008/WD-UNDERSTANDING-WCAG20-20081103/conformance.html#uc-levels-head
33
platform. For instance, versioning issues of ATs play a key role on evaluations (Vigo et al., 2007b): recent versions can overcome accessibility barriers making the evaluation of some guidelines obsolete while older versions are not able to convey content that conforms with accessibility guidelines (for example, this is happening right now with ARIA (Craig and Cooper, 2009) compliance and support by commonly used screen readers). If these issues are to be considered, the interaction context should be automatically captured and encapsulated as a profile. What is more, evaluation tools should be flexible enough to interoperate with these profiles and provide mechanisms to make use of user profiles as input.
8 Conclusions Accessibility metrics are going to be more and more important in the years to come due to their applicability in scenarios that benefit both developers and end-users. Their usage ranges from engineering processes to search engine re-ranking techniques. In recent years, this need for accurate measurement has been addressed by the accessibility research community and consequently a number of metrics have been proposed. Except for a few cases, metrics are not reused by different research groups, but new metrics are proposed. The reasons might be diverse: the implementation effort of existing metrics and the preference for customized new ones or the lack of information in scientific literature about existing metrics. The aim of this paper was to present the criteria that can be used to assess the quality of existing metrics and to analyse some of the automatic ones. We proposed a model with a set of qualities comprising validity, reliability, adequacy, sensitivity and complexity;; we surveyed existing metrics and selected seven of them that were experimentally analysed on 1543 pages. Results show that the framework is viable and can be operationalized;; in particular Web Accessibility Quantitative Metric (WAQM), Page Measure (PM) and Web Accessibility Barriers (WAB) are the metrics with the best behaviour with respect to validity, even though it is below optimal behaviour. PM does not perform very well regarding adequacy. Finally, we propose a research roadmap to increase the quality of accessibility metrics by addressing the aspects that have not been covered by this study so that validity, sensitivity and reliability could be further explored and hopefully increased. In conclusion, this paper provides some answers but also spurs new questions;; we believe that this could lead the research community and practitioners to focus more on quality aspects of accessibility metrics with the long-range goal of improving the effectiveness of accessibility engineering practices9.
References Abascal, J., Arrue, M., Fajardo, I., Garay, N., Tomás, J. 2004. Use of Guidelines to automatically verify Web accessibility. Universal Access in the Information Society 3(1), 71-79. Springer. Abou-Zahra, S.. 2010. Conformance Evaluation of Web Sites for Accessibility. Available at http://www.w3.org/WAI/eval/conformance. Accessed Jun 2010 Alonso, F., Fuertes, J.L., González, A.L., Martínez, L. 2010. On the testability of WCAG 2.0 for beginners. International Cross-Disciplinary Conference on Web accessibility, W4A’10, article 9. ACM Press.
9
The data we used for the experiment can be downloaded from http://158.227.112.219/EXP/index.html
34
Arrue, M., Vigo, M., Abascal, J. 2005. Quantitative Metrics for Web Accessibility Evaluation. ICWE 2005 Workshop on Web Metrics and Measurement. Bailey, J., Burd, E. 2005. Tree-Map Visualisation for Web Accessibility. Computer Software and Applications Conference, COMPSAC’05, 275-280. IEEE Press. Bailey, J., Burd, E. 2007. Towards More Mature Web Maintenance Practices for Accessibility. IEEE Workshop on Web Site Evolution, WSE’07, 81-87. IEEE Press. Brajnik, G. 2004. Comparing accessibility evaluation tools: a method for tool effectiveness. Universal Access in the Information Society 3(3-4), 252-263. Springer. Brajnik, G., Lomuscio, R. 2007. SAMBA: a Semi-Automatic Method for Measuring Barriers of Accessibility. ACM SIGACCESS Conference on Computers and Accessibility, ASSETS’07, 43-49. ACM Press. Brajnik, G., Mulas, A., Pitton, C. 2007. Effects of sampling methods on web accessibility evaluations. ACM SIGACCESS Conference on Computers and Accessibility, ASSETS’07, 59-66. ACM Press. Brajnik, G. 2008. Beyond Conformance: the role of Accessibility Evaluation Methods. 2nd International Workshop on Web Usability and Accessibility, IWWUA’08. LNCS 5176, 63-80. Springer. Brajnik, G. 2009. Validity and Reliability of Web Accessibility Guidelines. ACM SIGACCESS Conference on Computers and Accessibility, ASSETS’09, 131-138. ACM Press. Brajnik, G, Yesilada, Y., Harper, S. 2010. Testability and Validity of WCAG 2.0: The Expertise Effect. ACM SIGACCESS Conference on Computers and Accessibility, ASSETS’10, 43-50. ACM Press. Brusilovsky, P. 2007. Adaptive Navigation Support. The Adaptive Web. LNCS 4321, 263-290. Springer. Bühler, C., Heck, H., Perlick, O., Nietzio, A., Ullveit-Moe, N. 2006. Interpreting Results from Large Scale Automatic Evaluation of Web Accessibility. Computers Helping People with Special Needs, ICCHP’06. LNCS 4061, 184-191. Springer. Caldwell, B., Cooper, M., Guarino Reid, L., Vanderheiden, G. 2008. Web Content Accessibility Guidelines 2.0. W3C Accessibility Initiative. http://www.w3.org/TR/WCAG20/. Accessed Jun 2010 Casado-Martínez, C., Martínez-Normand, L., Goodwin-Olsen, M. 2009. Is It Possible to Predict the Manual Web Accessibility Result Using the Automatic Result? Universal Access in HCI, Part III, HCII’09. LNCS 5616, 645-653. Springer. Cassidy, B., Cockton, G., Bloor, C., Coventry, L. 2005. Capability, Acceptability and Aspiration for: collecting accessibility data with prototypes. Proceedings of BCS Conference on HCI’05, Volume 2, 138-143. Chisholm, W., Vanderheiden, G., Jacobs, I. 1999. Web Content Accessibility Guidelines 1.0. W3C Web Accessibility Initiative. http://www.w3.org/TR/WAI-WEBCONTENT/. Accessed Jun 2010 Craig, J., Cooper, M. 2009. Accessible Rich Internet Applications (WAI-ARIA) 1.0. W3C Working Draft. http://www.w3.org/TR/wai-aria/. Accessed Jun 2010 Dujmovic, J.J. 1996. A Method for Evaluation and Selection of Complex Hardware and Software Systems. International Computer Measurement Group Conference, Computer Measurement Group, 368-378. Fukuda, K., Saito, S., Takagi, H., Asakawa, C. 2005. Proposing new metrics to evaluate Web usability for the blind. Extended Abstracts of Proceedings of the SIGCHI Conference on Human Factors in Computing Systems, CHI’05, 1387-1390. ACM Press. Goble, C., Harper, S., Stevens, R. 2000. The Travails of Visually Impaired Web Travellers. ACM Conference on Hypertext and Hypermedia, Hypertext’00, 1-10. ACM Press. González, J., Macías, M., Rodríguez, R., Sánchez, F. 2003. Accessibility Metrics of Web Pages for Blind End-Users. Web Engineering. LNCS 2722, 374-383. Springer. Hackett, S., Parmanto, B., Zeng, X. 2004. Accessibility of Internet Web sites through time. ACM SIGACCESS Conference on Computers and Accessibility, ASSETS’04, 32-39. ACM Press. Harper, S., Goble, C., Stevens, R. 2005. Augmenting the mobility of profoundly blind Web travellers. New Review of Hypermedia and Multimedia 11(1), 103-128. Taylor & Francis. Hornbæk, K., Frøkjær, E. 2008. A study of the evaluator effect in usability testing, Human-Computer Interaction 23(3), 251-277. Taylor & Francis.
35
ISO/IEC 9126-1. 2001. Software Engineering - Software Product Quality - Part 1: Quality Model. International Standardization Organization. Ivory, M., Yu, S., and Gronemyer, K. 2004. Search result exploration: a preliminary study of blind and sighted users’ decision making and performance. Extended Abstracts of Conference on Human Factors in Computing Systems, CHI’04, 1453-1456. ACM Press. Kobsa, A., 1999. Adapting Web Information for the Disabled and the Elderly. WebNet’99, 32-37. Leuthold, S., Bargas-Avila, J.A., Opwis, K. 2008. Beyond web content accessibility guidelines: Design of enhanced text user interfaces for blind internet users. International Journal of Human-Computer Studies 66(4), 257-270. Elsevier. Lopes, R., Carriço, L. 2008. The impact of accessibility assessment in macro scale universal usability studies of the web. International Cross-Disciplinary Conference on Web accessibility, W4A’08, 5-14. ACM Press. Mankoff, J., Fait, H., Tran, T. 2005. Is Your Web Page Accessible? A Comparative Study of Methods for Assessing Web Page Accessibility for the Blind. Proceedings of the SIGCHI Conference on Human Factors in Computing Systems, CHI’05, 41-50. ACM Press. Mich, L., Franch, M., Gaio, L. 2003. Evaluating and Designing Web Site Quality. IEEE Multimedia 10(1), 34-43. IEEE Press. Mirri, S., Muratori, L.A., Roccetti, M., Salomoni, P. 2009. Metrics for Accessibility on the Vamola Project. International Cross-Disciplinary Conference on Web accessibility, W4A’09, 142-145. ACM Press. Nielsen, J., Tahir, M. 2000. Homepage Usability: 50 Websites Deconstructed. New Riders Publishing. O’Donnell, R.D., Eggemeier, F.T. 1986. Workload assessment methodology. Handbook of human perception and performance (Vol. 2, pp. 42.41-42.49). Wiley. Olsina, L., Rossi, G. 2002. Measuring Web Application Quality with WebQEM. IEEE Multimedia 9(4), 20-29. IEEE Press. Olsina, L., Sassano, R., Mich, L. 2008. Specifying Quality Requirements for the Web 2.0 Applications. International Workshop on Web-Oriented Software Technologies, IWWOST’08, 50-56. Parmanto, B., Zeng, X. 2005. Metric for Web Accessibility Evaluation. Journal of the American Society for Information Science and Technology 56(13), 1394-1404. Wiley. Petrie, H., Kheir, O. 2007. Relationship between Accessibility and Usability of Web sites. Proceedings of the SIGCHI Conference on Human Factors in Computing Systems, CHI’07, 397-406. ACM Press. Sirithumgul, P., Suchato, A., Punyabukkana, P. 2009. Quantitative evaluation for web accessibility with respect to disabled groups. International Cross-Disciplinary Conference on Web accessibility, W4A’09, 136-141. ACM Press. Shelly, C., Barta, M. (2010). Application of traditional software testing methodologies to web accessibility. International Cross-Disciplinary Conference on Web accessibility, W4A’10, article 11. ACM Press. Slatin, J., Rush, S. 2003. Maximum Accessibility: Making Your Web Site More Usable for Everyone. pp. 110–117. Addison-Wesley. Sullivan, T., Matson, R. 2000. Barriers to use: usability and content accessibility on the Web’s most popular sites. ACM Conference on Universal Usability, CUU’00, 139-144. ACM Press. Stephanidis, C. 2001. Adaptive Techniques for Universal Access. User Modeling and User- Adapted Interaction: The Journal of Personalization Research 11(1-2), 159–179. Springer. Takagi, H., Asakawa, C., Fukuda, K., Maeda, J., 2004. Accessibility Designer: Visualizing Usability for the Blind. ACM SIGACCESS Conference on Computers and Accessibility, ASSETS’04, 177-184. ACM Press. Takagi, H., Kawanaka, S., Kobayashi, M., Sato, D., Asakawa, C. 2009. Collaborative web accessibility improvement: challenges and possibilities. ACM SIGACCESS Conference on Computers and Accessibility, ASSETS’09, 195-202. ACM Press. Trochim, W.M.J., 2006. The Research Methods Knowledge Base. http://www.socialresearchmethods.net/kb/. Accessed Jun 2010 Velleman, E., Meerbeld, C., Strobbe, C., Koch, J., Velasco, C.A., Snaprud, M., Nietzio, A., 2007. D-WAB4, Unified Web Evaluation Methodology (UWEM 1.2 Core). http://www.wabcluster.org/uwem1_2/. Accessed Jun 2010
36
Vigo, M., Arrue, M., Brajnik, G., Lomuscio, R., Abascal, J. 2007. Quantitative Metrics for Measuring Web Accessibility. International Cross-Disciplinary Conference on Web accessibility, W4A’07, 99-107. ACM Press. Vigo, M., Kobsa, A., Arrue, M., Abascal, J. 2007b. User-Tailored Web Accessibility Evaluations. ACM Conference on Hypertext and Hypermedia, Hypertext’07, 95-104. ACM Press. Vigo, M., Leporini, B., Paternò, F. 2009. Enriching Web Information Scent for Blind Users. ACM SIGACCESS Conference on Computers and Accessibility, ASSETS’09, 123-130. ACM press. Vigo, M., Brajnik, G., Arrue, M., Abascal, J. 2009b. Tool Independence for the Web Accessibility Quantitative Metric. Disability and Rehabilitation: Assistive Technology 4(4), 248-263. Informa Healthcare. Watanabe, T. 2007. Experimental evaluation of usability and accessibility of heading elements. International Cross- Disciplinary Conference on Web accessibility, W4A’07, 157-164. ACM Press. Woolrych, A., Cockton, G., Hindmarch, M. 2004. Falsification Testing for Usability Inspection Method Assessment. In A. Dearden and L. Watts (Eds.) Proceedings of HCI 2004, Volume 2, 137-140. Research Press International.
37