The College of William and Mary, USA â. § .... comment ratio, the number of components, CFS, Halstead ... components, CFS, Halstead Complexity, and DMSC.
Automatically Assessing Code Understandability: How Far Are We? Simone Scalabrino∗ , Gabriele Bavota† , Christopher Vendome‡ , Mario Linares-Vásquez§ , Denys Poshyvanyk‡ and Rocco Oliveto∗ ∗
University of Molise, Italy — † Università della Svizzera italiana (USI), Switzerland College of William and Mary, USA — § Universidad de los Andes, Colombia
‡ The
Abstract—Program understanding plays a pivotal role in software maintenance and evolution: a deep understanding of code is the stepping stone for most software-related activities, such as bug fixing or testing. Being able to measure the understandability of a piece of code might help in estimating the effort required for a maintenance activity, in comparing the quality of alternative implementations, or even in predicting bugs. Unfortunately, there are no existing metrics specifically designed to assess the understandability of a given code snippet. In this paper, we perform a first step in this direction, by studying the extent to which several types of metrics computed on code, documentation, and developers correlate with code understandability. To perform such an investigation we ran a study with 46 participants who were asked to understand eight code snippets each. We collected a total of 324 evaluations aiming at assessing the perceived understandability, the actual level of understanding, and the time needed to understand a code snippet. Our results demonstrate that none of the (existing and new) metrics we considered is able to capture code understandability, not even the ones assumed to assess quality attributes strongly related with it, such as code readability and complexity. Index Terms—Software metrics, Code understandability, Empirical study, Negative result
I. I NTRODUCTION Code understanding is an important foundation to any coderelated activity. Developing new features, fixing bugs, or refactoring code requires a deep understanding of the involved code components and of their relationships. Unsurprisingly, recent studies showed that developers spend most of their time (∼70%) understanding code [1]. While the importance of code understandability is undisputed for maintenance-related activities [2], [3], [4], [5], [6], [7], there is still a lack of metrics to objectively assess the understandability of a given piece of code. Indeed, our knowledge of factors affecting (positively or negatively) code understandability is basically tied to common beliefs or is focused on the cognitive process adopted when understanding code [8], [9]. For example, we commonly assume that code complexity has a direct impact on developers’ ability to understand the code, but we do not have strong empirical evidence supporting such a belief yet. Another aspect possibly related to the understandability of a piece of code is represented by its readability. In the last years, researchers have proposed several metrics and models for assessing code readability [10], [11], [12], [13], [14]. These metrics and models are generally evaluated by assessing
their correlation with the readability perceived by developers. This typically means that the developers participating in the evaluation are just asked to read the code and assess its readability on a given scale (e.g., from 1—low to 5—high readability). However, the perceived readability is something different from the actual understandability of the code; a developer could find a piece of code readable, but still difficult to understand, for example, due to unknown APIs used. Let us consider the code fragment listed below: AsyncHttpClient client = new AsyncHttpClient () ; String cookies = CookieManager . getInstance () . getCookie ( url ); Log . e ( TAG , cookies ) ; client . addHeader ( SM . COOKIE , cookies ) ;
All readability metrics/models existing in the literature [10], [11], [12], [13], [14] would consider this snippet of code as highly readable, since it is very short, it has a low complexity, and uses meaningful and intuitive identifiers. Nevertheless, this snippet of code is not necessarily easy to understand for any given developer, because the used APIs could be unknown to her and even poorly documented. In other words, even if a developer can understand that getCookie(url) returns a cookie, she may not understand all the consequences of this call if she does not know the specifications behind that API. While we have possible proxies for code understandability, such as code complexity and readability, we (i) do not know whether these proxies actually correlate with the effort required to understand a piece of code, and (ii) do not have a metric able to provide an estimation for code understandability. Previous attempts to define a code understandability model [4], [15], [6] have not been empirically evaluated, consider understandability as a factor in a quality model [2], [16], or measure understandability at the level of a whole system [17]. Having a metric to estimate the effort required to understand a piece of code would have a strong impact on several software engineering tasks. For example, such a metric would be useful to (i) improve the estimation of the time needed to fix a bug (the lower the understandability, the higher the time to fix the bug); (ii) create search-based refactoring recommender systems using code understandability as a fitness function; or (iii) assess the quality of code changes during code reviews. In this paper, we make the first step towards the definition of a metric able to capture the understandability of a given piece of code by investigating to what extent a number of different (existing and new) metrics correlate with code understandability.
We consider three types of metrics: 1) Code-related metrics. We consider 105 metrics characterizing the code to be understood: classic code metrics such as LOC and cyclomatic complexity, as well as metrics used to assess the readability of a code component, such as text coherence [14] and the code indentation [10]; 2) Documentation-related metrics. The availability of documentation can clearly impact the understandability of a given piece of code. For this reason, we consider 11 documentation-related metrics (e.g., the availability of external documentation for the given code). Nine of them are introduced in this paper. 3) Developer-related metrics. We consider five metrics related to the developer’s experience. While developerrelated metrics could not be used to define an objective measure for code understandability, they are still useful in our study to assess to what extent the developer experience and background play a role during comprehension. We conducted a study involving 46 participants to assess the correlation of the aforementioned 121 (105 code-related + 11 documentation-related + 5 developer-related) metrics with the understandability of code snippets. Participants were required to understand eight code snippets each, for a total of 324 data points. We adopted the following experimental design to consider both the perceived and the actual code understandability. We asked participants to carefully read and to fully understand each snippet. Participants could, at any moment, select the option “I understood the snippet” or “I cannot understand the snippet”. This provided us with a first classification of snippets that are perceived by the participants as either “understandable” or “not understandable”. Also, since we monitored the time spent before selecting one of the two options, we can also measure the understandability effort (i.e., the time required to understand a code snippet). Finally, when the participants clicked on “I understood the snippet”, we verified their actual level of understanding by asking questions about the code snippet. The collected dataset, as opposed to the ones used for evaluating code readability metrics (see [10], [14]), provides indications not only about the perceived understandability, but also about the actual understandability. Our extensive statistical analysis provided us with what can be defined as a negative empirical result: none of the considered metrics exhibit a significant correlation with the understandability of code snippets. This holds for both the perceived and the actual understandability. This result was quite surprising for us, especially considering that several metrics (e.g., code complexity and readability) are supposed to influence the understandability of code. II. BACKGROUND & R ELATED W ORK In this section, we describe metrics and models that have been proposed to measure code readability. All these metrics have been included in our study. Afterwards, we briefly describe related work presenting metrics for measuring understandability (at system level) as a single quality attribute and as part of a quality model.
A. Code Readability Identifiers and comments play a crucial role in program comprehension, since developers express domain knowledge through the names that they assign to the code entities at different levels (i.e., packages, classes, methods, variables) [18], [19], [20], [21], [22]. Thus, source code lexicon impacts the psychological complexity of a program [14], [23]. Another aspect that also contributes to the readability (and potentially understandability) of source code are structural aspects such as indentation, code entities length [10], [11], and visual/spatial aspects such as syntax highlighting, code formatting, and visual areas covered by code entities [12]. All the aforementioned aspects have been used as features in binary classifiers able to predict the readability of code snippets [10], [11], [12], [13], [14]. In the model by Buse and Weimer [10], source code structural aspects (e.g., number of branches, loops, operators, blank lines, comments) represent the underlying features in the classifier. The model was trained a-priori on 100 small snippets; the snippets were tagged manually as readable or non-readable by 120 human annotators. The reported results provide evidence that readability can be estimated automatically. Posnett et al. [11] proposed a model based on a reduced set of the features introduced by Buse and Weimer. An empirical evaluation conducted on the same dataset used by Buse and Weimer [10] indicated that the model by Posnett et al. is more accurate than the one by Buse and Weimer. Dorn introduced a readability model, which relies on a larger set of features grouped in four categories: visual, spatial, alignment, and linguistic [12]. This larger set of features highlights the fact that structural aspects are not the only ones that should be considered for code readability; aspects representing and modeling how the code is read on the screen, such as syntax highlighting, variable naming standards, and operators alignment, should be also considered. Dorn trained and validated the model on a new dataset, including programs in Java, Python and CUDA, for a total of 360 snippets. Such a model achieved a higher accuracy as compared to the one by Buse and Weimer. Scalabrino et al. [14] proposed and evaluated a set of features based entirely on source code lexicon analysis (e.g., consistency between source code and comments, specificity of the identifiers, textual coherence, comments readability). The model was evaluated on the two datasets previously introduced by Buse and Weimer [10] and Dorn [12] and on a new dataset, composed by 200 Java snippets, manually evaluated by nine developers. The results indicated that combining the features (i.e., structural+textual) improves the accuracy of code readability models. B. Software/Code Understandability While readable code might directly impact program comprehension, code readability metrics are not sufficient to measure to what extent the code allows developers to understand its purpose, relationships between code entities, and the latent semantics at the low-level (e.g., statements, beacons, motifs)
and high-level structures (e.g., packages, classes). Program understanding is a non-trivial mental process that requires building high-level abstractions from code statements or visualizations/models [9], [4]. There have been several metrics designed to evaluate software understandability by focusing on complexity as well as source-level metrics. Lin et al. [4] proposed a model for assessing understandability by building an understandability matrix from fuzzy maximum membership estimation for population of fog index, comment ratio, the number of components, CFS, Halstead Complexity, and DMSP. The authors then used PCA and factor analysis to get the weights for the column vectors, which can be multiplied by the matrix to get the Synthesis Vector of Understandability. Finally, the understandability is calculated by using the fuzzy integral. The authors did not empirically evaluate the proposed metric. Misra and Akman [24] performed a comparative study between existing cognitive complexity measures and their proposed measure: cognitive weight complexity measure (CWCM), which assigns weights to software components by analyzing their control structures. The authors performed a theoretical validation of these metrics based on the properties proposed by Weyuker [25]. They found that only one metric, Cognitive Information Complexity Measure (CICM), satisfied all nine properties, while the others satisfied seven of the nine. Thongmak et al. [3] considered aspect-oriented software dependence graphs to assess understandability of aspectoriented software, while Srinivasulu et al. [6] used rough sets and rough entropy (to filter outliers) when considering the following metrics: fog index, comment ration, the number of components, CFS, Halstead Complexity, and DMSC. These metrics are computed at system level for nine projects, and subsequently the rough entropy outlier factor was calculated for the metrics to identify the outliers, which correspond to either highly understandable or not understandable software based on the metric values. Capiluppi et al. [17] proposed a measure of understandability that can be evaluated in an automated manner. The proposed measure considers: (i) the percentage of micromodules (i.e., the numbers of files) that are within the macromodules (i.e., the directories), and (ii) the relative size of the micro-modules. The authors calculated the proposed measure on the history of 19 open source projects, finding that understandability typically increased during the life-cycle of the systems. Yet, no evaluation is provided for such a measure. Understandability has also been a factor in quality models to assess software maintainability. Aggarwal et al. [2] investigated the maintainability of software and proposed a fuzzy model, which is composed of three parts: (i) readability of code, (ii) documentation quality, and (iii) understandability of the software. To quantify understandability, the authors utilize a prior work that defines language of software as the symbols used, excluding reserved words. The authors constructed rules based on the ranges of the three factors to determine maintainability.
Similarly, Chen et al. [7] investigated the COCOMO II Software Understandability factors by conducting a study with six graduate students asked to accomplish 44 maintenance tasks, and found that higher quality structure, higher quality organization, and more self-descriptive code were all correlated with less effort spent on the tasks, which leads to high maintainability. Bansiya and Davis [26] proposed a model where metrics are related to several quality attributes, including understandability. In terms of understandability, the model considers encapsulation and cohesion to have positive influences, while abstraction, coupling, polymorphism, complexity, and design size have a negative influence. The authors validated the model by analyzing several versions of two applications and found that understandability decreases as a system evolves with many new features. Additionally, 13 evaluators analyzed 14 versions of a project and the authors found a correlation between the evaluators’ overall assessment of quality and the models assessment for 11 out of 13 evaluators. It is worth noting that we do not consider the above discussed understandability metrics [4], [24], [3], [6], [17], [16], [26] in our study since they are defined at systemlevel (i.e., they provide an overall indication of the system understandability), while we are interested in studying whether it is possible to measure the understandability of a given code snippet, as already done in the literature for code readability. Instead, we included in our study the metrics used by Kasto and Whalley [27] to study the understandability of code snippets in an educational context. Specifically, Kasto and Whalley analyzed the performance of 93 students in their final examination for the Java programming course and they correlated their results with five metrics. Several studies have explored software understandability and program comprehension with either students or practitioners. Shima et al. considered the understandability of a software system by assessing the probability that a system can be correctly reconstructed from its components [28]. The authors asked eight students to reconstruct a system and the results suggest that faults tend to occur in hard to understand files or very simple files. Roehm et al. performed an observational study with 28 developers to identify the steps developers perform when understanding software and the artifacts they investigate [5]. The authors found that developers are more inclined towards relying upon source code as well as discussing with colleagues over utilizing the documentation. The authors also identified some behaviors that improve comprehension, such as consistent naming conventions or meaningful names. Understandability has been mostly analyzed from the perspective of (i) the quality attribute at the software level, i.e., understandability as the “The capability of the software product to enable the user to understand whether the software is suitable, and how it can be used for particular tasks and conditions of use" [29]; and (ii) the theories, challenges, and models for program understanding at cognitive levels [9], [8]. However, as of today, we still lack models for assessing code understandability at snippet-level, similarly to code readability.
The only work we found that relates to a code understandability model is based on complexity and size source code level metrics [4], [15]. III. C ANDIDATE P REDICTORS FOR C ODE U NDERSTANDABILITY Understandability is a multifaceted property of source code and, as well as readability, is subjective in nature. In readability, the subjectivity is represented by personal taste and habits, while in understandability it lies in the previous knowledge of a developer and in her mental models [8]. Consider a method of an Android activity in a mobile app; its understandability might be high for an Android developer, while it could be low for a Java developer with no experience in Android. In this section, we briefly discuss the 121 metrics considered in our study aimed at assessing their ability to capture the understandability of a given piece of code. Table I shows the complete list of metrics: rows contain the basic metrics and columns indicate how the metrics are aggregated (e.g., the Identifiers length for a given code snippet is computed, as suggested by previous work [10], as the average and as the maximum length of the identifiers used in the snippet). We report in boldface the new metrics introduced in this study. In the following subsections, we discuss the considered metrics grouped by their type. TABLE I C ANDIDATE PREDICTORS FOR CODE UNDERSTANDABILITY.
Devs
Docs
Code
Metric
Non-aggreg.
Cyclomatic comp. #nested blocks #parameters #statements #assignments #blank lines #characters #commas #comments #comparisons #conditionals #identifiers #keywords #literals #loops #numbers #operators #parenthesis #periods #spaces #strings #words Indentation length Identifiers length Line length #aligned blocks Ext. of alig. blocks Entropy LOC Volume NMI NM ITID TC Readability IMSQ
[27]
CR CIC CICsyn MIDQ AEDQ
[14]
EAP PEgen PEspec
Min
Avg
Max
DFT
Visual
Area
[12]
[12]
[12] [12] [12]
[12] [12] [12]
[12] [12]
[12] [12]
[12]
[12]
[27] [27] [27] [10] [10]
[12] [10]
[10] [10] [10] [10] [10] [10]
[27]
[10] [10] [10] [10] [10] [10] [10] [10] [10]
[10] [10] [10]
[10] [10] [10] [10]
[12] [12] [11] [11] [11] [14]
[14] [14] [14][12] [14]
[14] [14]
[14] [14] [new]
[new]
[new]
[new] [new]
[14] [14] [new] [new]
[14] [14] [new] [new]
[new]
[new]
[new]
[14]
[14]
[new] [new]
[12] [12] [12] [12] [12] [12] [12] [12] [12] [12] [12] [12] [12] [12]
A. Code-related metrics Most of the metrics considered in our study assess source code properties. We include the five metrics used by Kasto and Whalley [27]: cyclomatic complexity [30], which estimates the number of linear independent paths of the snippet average number of nested blocks, which measures the average codeblock nesting in the snippet, number of parameters, number of statements and number of operands, i.e., number of identifiers. We also include in this category all the code-related readability metrics defined in the literature [10], [11], [12], [14]. These include the ones by Buse and Weimer [10], assessing properties for a single line of code (e.g., number of identifiers or line length) and then aggregated (with the maximum and/or the average) to work at the level of “code snippet”. Lines of code (LOC), token entropy and Halstead’s volume are used by Posnett et al. [11] in the context of readability prediction. Dorn [12] presents a variation to the basic metrics introduced by Buse and Weimer [10], measuring the bandwidth of the Discrete Fourier Transform (DFT) of the metrics, the absolute and the relative area of characters belonging to different token categories (e.g., identifiers, keywords or comments), the alignment of characters through different lines, and the number of identifiers containing words belonging to an English dictionary. Note that the area-related metrics defined by Dorn are computed both in an absolute way (e.g., total area of comments) and in a relative way (e.g., area of comments divided by area of strings). These variants are not reported in Table I due to space constraints, but are considered in our study and listed in our replication package [31]. Scalabrino et al. [14] define Narrow Meaning Identifiers (NMI), Number of Meanings (NM), Identifiers Terms In Dictionary (ITID) and Textual Coherence (TC) to capture the readability of a code snippet. Such metrics are computed line-by-line (ITID), identifier-by-identifier (NMI and NM) or block-by-block (TC); the authors aggregate the measures using minimum, average and maximum, in order to have a single measure for the snippet. We also use code readability, as defined by Scalabrino et al. [14], as a separate metric, combining together the previously listed metrics. We followed the steps described by Scalabrino et al. to define the readability model by using a logistic classifier that we train on the 420 Java snippets available in the literature [10], [12], [14]. We also introduce a new code-related metric, the Invoked Methods Signature Quality (IMSQ), which measures the quality of the signature of the internal methods invoked by a given code snippet s (i.e., methods belonging to the same system of s) in terms of readability and representativeness. We define the Method Signature Quality (MSQ) of an invoked method m as: X 1 IQ(id) MSQ(m) = |IS (m)| id∈IS (m)
where IS(m) is the set of identifiers used in the m’s signature (i.e., method name and parameters) and IQ(id) is defined as: ( 1 (Rd (id) + Rp(id)), id is a method name IQ(id) = 2 Rd (id ), id is a parameter name
IQ(id) captures the quality of an identifier in terms of its readability (Rd) and its representativeness (Rp). The idea behind the readability is that an identifier should be composed of a (possibly small) set of meaningful words. To measure Rd for an identifier (id), we (i) split id into the words composing it, (ii) expand each word to bring it in its original form (e.g., ptr → pointer), (iii) create a new identifier idexp composed by the expanded words separated by a “_”, and (iv) measure the Levenshtein distance between id and idexp . The Levenshtein distance between two strings a and b measures the minimum number of single-character changes needed to transform a into b. The conjecture behind IQ(id) is that the higher the Levenshtein distance between id and idexp , the higher the mental effort required for the developer to understand the meaning of the identifier by mentally splitting and expanding it during program comprehension. Note also that we separate the expanded terms in idexp by using “_” in order to penalize, by increasing the Levenshtein distance, identifiers composed by several words. For example, the identifier printOnStdOut is first split into print, on, std, out; then, each word is expanded, which has no effect on the first two words, but expands std into standard and out into output. Therefore, printOnStdOut is transformed in print_on_standard_output. To have Rd(id) defined in [0, 1], we normalize the Levenshtein distance (L) between id and idexp as follows: Rd (id ) = 1 −
L(id , id exp ) max(|id |, |id exp |)
where max(|id |, |id exp |) represents the longest identifier among the two. When the distance equals zero, the readability of the identifier equals one, indicating no need for expansion/splitting (i.e., id is composed by a single expanded word). Note that in the implementation of Rd(id), we used a semiautomatic approach to split/expand identifiers. We first used a naive automatic splitting technique, based on camel case and underscores; then, we automatically checked the presence of each resulting word in an English dictionary. If the word was not found, we manually expanded/further split the specific word. For example, for the word “cmdline” there would not be automatic split. Since the word “cmdline” does not exist in the dictionary, we manually convert it to “command” and “line”. We save all the manual substitutions in order to minimize the human effort. In the literature, there are many automatic approaches for identifier splitting/expansion, but we preferred to implement a simpler and more effective strategy at this stage, since the number of identifiers to split/expand was limited and our goal was to assess the correlation of the defined metrics with the understandability effort. Thus, we wanted to be sure to avoid introducing imprecision while computing the metrics. When dealing with the identifier used to name a method, we also verify whether it is representative of what the method does (Rp). We compute the textual overlap between the terms used in the identifier and in the method body. We tokenize the method body to define its dictionary. Then, we count the
number of times each word from the identifier (expanded or not) is contained in the dictionary extracted from the method body. We consider only names and verbs from the identifiers, ignoring other parts of speech such as conjunctions, since they do not carry semantic information. Following the printOnStdOut example, we check whether the method body contains the words print, standard, std, output, and out. We measure the representativeness as the ratio between the number of words from the identifier (i.e., method name) contained in the method body, and the total number of words in the identifier. If all the words from the identifier are used in m’s body, we assume that the method name is representative of m and thus, should ease the understanding of methods invoking m. If, instead, words are not found in the method body, this could hinder the understandability of the methods invoking m. In our study, we consider the minimum, the average, and the maximum values of the MSQ metric for a given code snippet (e.g., the average MSQ of all methods invoked in the code snippet). B. Documentation-related metrics Scalabrino et al. [14] introduced three metrics to capture the quality of the internal documentation of a snippet: Comments Readability (CR) measures the readability of the comments in a snippet using the Flesch reading-ease test [32]; Comments and Identifiers Consistency (CIC) measures the consistency between comments and code; and CICsyn , a variant of CIC, which takes synonyms into account. We also introduce two new metrics aimed at capturing the quality of both the internal (MIDQ) and external (AEDQ) documentation available for code components used in a given snippet. The Methods Internal Documentation Quality (MIDQ) for a snippet s acts as a proxy for the internal documentation (i.e., Javadoc) available for the internal methods (the ones belonging to the same project as s) invoked in s. Given m an internal invoked method, we compute MIDQ(m) using a variation of the approach proposed by Schreck et al. [33]: 1 (DIR(m) + readability D (m)) 2 where DIR(m) is the Documented Items Ratio computed as the number of documented items in m divided by the number of documentable items in m. We consider as documentable items for m (i) its parameters, (ii) the exceptions it throws, and (iii) its return value. Such items are considered as documented if there is an explicit reference to them in the Javadoc through the tags @param, @throws and @returns. readabilityD (m) represents, instead, the readability of the Javadoc comments assessed using the Flesch reading-ease test [32]. The higher MIDQ the higher the internal documentation quality for m. We consider the minimum, the average, and the maximum values of the MSQ metric for a given code snippet. Concerning the API External Documentation Quality (AEDQ), it tries to capture the amount of information about APIs used in the given snippet s that can be acquired from external sources of documentation, such as Q&A websites. MIDQ(m) =
The conjecture is that if external documentation is available, it is more likely that developers are able to understand the usage of an API in a code snippet s. We compute the availability of external documentation for each external class c used in s via the AEDQ(c) metric. First, we identify all Stack Overflow discussions related to c by running the following query: “title:‘how to’ < c > hasaccepted:yes [java]” In other words, we select all Stack Overflow discussions that (i) contain “how to” and the class name in the title, (ii) have an accepted answer, and (iii) concern Java (since our study has been performed on Java snippets). Then, we sum the votes assigned by the Stack Overflow users to the question in each retrieved discussion, in order to have a quantitative information about the interest of the developers’ community in such a class. We assume that higher interest in a given API class implies a higher availability of external sources of information (e.g., discussions, code examples, etc.). We consider in our study the minimum, the average, and the maximum values of the AEDQ metric for the external classes used in s. C. Developer-related metrics Since understandability is a very subjective feature of code, we introduced three developer-related metrics. We measure the programming experience of the developer who is required to understand a snippet (PEgen and PEspec ) and the popularity of the API used in the snippet (EAP). The common wisdom is that the higher the programming experience of developers, the higher their capability of understanding code. PEgen measures the programming experience (in years) of a developer in general (i.e., in any programming language). PEspec assesses instead the programming experience (in years) of a developer in the programming language in which a given snippet s is implemented. The higher PEspec , the higher the developer’s knowledge about the libraries available for such a programming language. With External API Popularity (EAP), we aim at capturing the popularity of the external APIs used in a given snippet. The assumption is that the lower the popularity, the lower the probability that a typical developer knows the API. If the developer is not aware of the APIs used in a snippet, it is likely that she has to look for its documentation or to inspect its source code, thus spending more effort in code understanding. We rely on an external base of Java classes E to estimate the popularity of an external class. We chose as E a 10% random sample of classes from Java/Android projects hosted on GitHub in 2016, totaling ∼2M classes from ∼57K Java projects. We used Google BigQuery to extract all the imports of all the classes belonging to such projects using a regular expression. Then, we counted the number of times each class imported in E occurred in the import statements. Note that in Java it is possible to import entire packages (e.g., import java.util.∗). In this case, it is difficult to identify the actual classes imported from the package. For this reason, we applied the following strategy. Let us assume that a class, Foo, is imported only once with the statement import bar.Foo, but it is part of a quite popular package, bar, that is imported
TABLE II S YSTEMS USED IN OUR STUDY System
Java KLOC
Category
Description
ANTLR Car-report Hibernate Jenkins K9 mail MyExpenses OpenCMS Phoenix Spring Weka
178 45 948 231 121 101 1059 352 197 657
Desktop Mobile Framework Web Mobile Mobile Web Framework Framework Desktop
Lexer-parser Car costs monitoring ORM framework Continuous integration Mail client Budget monitoring Content Management System Relational database engine Generic application framework Machine-learning toolkit
100 times in E through the statement import bar.∗. The class Foo2, belonging to the same package, is imported 99 times with the statement import bar.Foo2. In this case, we increase the number of occurrences of classes belonging to imported package in a proportional way. In the presented example, we add 1 to the number of Foo’s imports, and 99 to the number of Foo2 imports. We found that imports of entire packages represent only 2.6% of all the imports and, therefore, their impact is very low. EAP(c) is defined as the number of c imports normalized over the number of imports of cmax , where cmax is the most imported class we found in E (i.e., java.util.List). IV. E MPIRICAL S TUDY D ESIGN The goal of our study is to assess the extent to which the considered 121 metrics correlate with code understandability. The perspective is of researchers interested in analyzing whether code-related, documentation-related, and developerrelated metrics can be used to assess the understandability level of a given piece of code. This study aims at answering the following major research question: What is the correlation between the 121 considered metrics and the understandability level of a given developer for a specific code snippet? Given the wide and heterogeneous set of considered metrics, answering this research question would allow us and, more in general, the research community to understand how far we are from defining a set of metrics capable of automatically and objectively assessing code understandability. A. Data collection The context of the study consists of 50 Java/Android methods extracted from ten popular systems listed in Table II (five methods from each system). We first extracted all the methods having 50±20 ELOCs (i.e., Effective Lines Of Code, excluding blank and comment lines) from the systems. The choice of the methods’ size (i.e., 50 ± 20 ELOCs) was driven by the decision of excluding methods that are too trivial or too complex to understand.
Afterwards, we computed all the metrics described in Section III for the selected methods1 . Then, we used a greedy algorithm for center selection [34] to select the 50 most representative methods based on the defined metrics. Given a set of candidate methods M and a set of already selected centers C, such algorithm chooses, in each iteration, arg maxm∈M dist(C, m), i.e., the candidate method which is the farthest possible (in terms of considered metrics) from the already selected centers. The first center is randomly selected. In order to select exactly five snippets from each system, we used the set of candidate methods from a specific system as M until the five methods for such a system were selected; then, we changed M with the set of candidate methods from another system, and so on, until |C| = 50. Note that (i) we did not empty the C set when changing the candidate methods (i.e., when moving from one system to another) to always keep track of the methods selected up to that moment, thus avoiding the risk of adding to C methods similar to the ones already in C; (ii) we did not run the algorithm on the union of all candidate methods to ensure the selection of five methods per system (thus increasing the heterogeneity of the final sample). After having selected the 50 methods and computed the values of the metrics of interest for each of these 50 methods, we needed to define a ground-truth reporting the understandability of each method. To this aim, we invited 46 Java developers and CS students to participate in a survey where they were required to understand the selected methods. The survey was implemented in a Web application and featured the following steps. First, we collected demographic data about participants: (i) years of experience in programming and more specifically in Java, and (ii) current position (e.g., CS student, developer etc.). This information was used in part to compute the developer-related metrics. After this preliminary step, each participant was required to understand a subset of eight methods randomly selected from the 50 methods. The Web application was designed to automatically balance the number of evaluations for each of the 50 methods (i.e., the number of participants understanding each method was roughly the same). In total, we collected 324 evaluations across the 50 methods (∼6.5 evaluations per method on average), since not all participants completed the survey. The eight methods were presented individually (i.e., each method in a different page) to participants, and the Web application allowed navigation of the method and access to the methods/classes invoked/used by it. Also, participants were allowed to browse the Web to collect information about types, APIs, data structures, etc. used in the method. This was done to simulate the typical understanding process performed by developers. We asked participants to carefully read and fully understand each method. Participants could, at any moment, click on the button “I understood the method” or the button “I cannot understand the method”. In both cases, the Web application stored the time spent, in seconds, by the developer 1 Excluding the “Developer programming experience” and the “Developer Java experience”.
for the method’s understanding before clicking on one of the two buttons. If the participant clicked on “I understood the method”, the method was hidden and she was required to answer three verification questions about the method she just inspected. The provided answers were stored for future analysis. An example of verification question is: “What does the invoked method X do?”. To answer such a question, the participant should have understood also all the consequences of invoking a specific external method. B. Analysis Method In the context of our study, we measure the understandability level of a given piece of code from different perspectives and correlate it with 121 considered metrics. We defined the following four different independent variables. Perceived Binary Understandability (PBU). This binary metric gets value 0 if the participant clicked on the “I cannot understand the method” button, otherwise (i.e., the participant clicked on “I understood the method”) it gets value 1. This metric simply aims at discriminating between understandable vs. non-understandable methods as perceived by participants. Time Needed for Perceived Understandability (TNPU). Measured as time, in seconds, spent by the participant while inspecting the method before clicking on “I understood the method”. This metric cannot be computed when the participant clicked on “I cannot understand the method”. Actual Understandability (AU). It gets value 0 if the participant clicked on the “I cannot understand the method” button. Otherwise, it is computed as the percentage of correct answers the participant provided to the three verification questions. The metric is defined in the range [0, 1], where 1 indicates high understandability. Timed Actual Understandability (TAU). It gets value 0 if the participant clicked on the “I cannot understand the method” button. Otherwise, it is computed as: � � T N P Uno T AU = AU 1 − max T N P Uno where AU is the percentage of correct answers, TNPU is the time needed to understand the method and TNPU no is a modified TNPU where outliers (detected using the Tukey’s test [35], with k = 3) are substituted with the maximum value of TPNU, which is not an outlier. The higher AU, the higher TAU, while the higher TNPU, the lower TAU. Also, TAU is defined in [0, 1]. We considered the relative T N P Uno time ( max T N P Uno ) instead of the absolute time so that TAU gives the same importance to both the correctness achieved (AU) and the time needed (TNPU). We removed outliers from TNPU because the maximum value of such a variable is 1,649 seconds, much greater than the third quartile (171 seconds). Using such a value as the maximum would have flattened down all the relative times. We computed these four variables for each of the 324 evaluations performed by participants (i.e., for each method each participant tried to understand). Before calculating the correlation between each of the 121 metrics described in
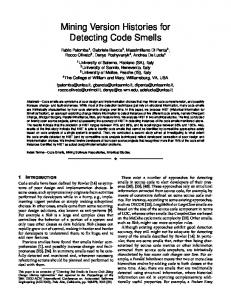
Section III and PBU, TNPU, AU, and TAU, we excluded 2 of the 121 considered metrics (i.e., NMImin and ITIDmin ), because the value of such metrics was 0 for all the snippets taken into account. Then, we verified which metrics strongly correlate among the 121. This was done to exclude from our analysis redundant metrics capturing the same information in different ways. We compute the Kendall rank correlation coefficient (i.e., Kendall’s τ ) [36] to determine whether there are pairs exhibiting a strong correlation. We adopted the Kendall’s τ , since it does not assume the data to be normally distributed nor the existence of a straight linear relationship between the analyzed pairs of metrics. Cohen [37] provided a set of guidelines for the interpretation of the correlation coefficient. It is assumed that there is no correlation when 0 ≤ |τ | < 0.1, small correlation when 0.1 ≤ |τ | < 0.3, medium correlation when 0.3 ≤ |τ | < 0.7, and strong correlation when 0.7 ≤ |τ | ≤ 1. For each pair of metrics exhibiting a strong correlation (i.e., with a Kendall’s |τ | ≥ 0.7), we excluded the ones which presented the highest number of missing values2 or, if equals, one at random. This allowed us to reduce the number of investigated metrics from 121 to 74. Note that such a removal of metrics was only done for presentation purposes, considering the high number of metrics taken into account in our study. Finally, we computed the Kendall correlation between each of the remaining 74 metrics and PBU, TNPU, AU, and TAU, to verify whether some of them are able to capture the (actual and perceived) understandability of code. C. Replication Package All the data used in our study is publicly available [31]. We provide the research community with our dataset reporting the (perceived and actual) understandability achieved by the 46 participants, hoping that the availability of such a dataset will help in fostering research on the definition of a metric to automatically assess code understandability. V. E MPIRICAL S TUDY R ESULTS Fig. 1 provides information about the participants involved in our study. Most of them (∼ 70%) are bachelor’s students— mixed in terms of years of programming experience. The sample of participants also included six master’s students, three Ph.D. students, and five professional developers. Fig. 2 reports a heat-map showing the Kendall’s τ between each metric and each understandability variable. We only show in Fig. 2 correlations having |τ | > 0.1. As it is evident by looking at Fig. 2, very few metrics have a correlation with understandability variables higher than |0.1|. Specifically nine metrics have a weak correlation with PBU, 10 with TNPU, 8 with AU and 16 with TAU. 50 out of the 74 metrics taken into account show no correlation at all. In the following, we discuss the observed correlations by understandability metric. However, it must always be kept in mind that these are all weak correlations and, as such, do not allow for making 2 Some metrics cannot be computed in some cases. For example, “Area of comments/literals” cannot be computed if the method does not contain literals.
3 5 Position Ph.D. student
6
Professional developer Master's student Bachelor's student
32
Fig. 1. Participants to the study
any strong claims about the ability of these correlated metrics to act as proxies for code understandability. A. Perceived Binary Understandability (PBU) The metric which has the highest correlation with PBU is “Max line length” (τ ≈ −0.17), one of the metrics introduced by Buse and Weimer [10] for readability prediction. Note that Buse and Weimer also found that such a metric is the most important one for readability prediction [10]. Therefore, this is a further confirmation of the fact that, generally, developers tend to perceive code with long lines as less pleasant. We also found that there is a low correlation between PEspec and PBU: developers with more experience in the specific programming language tend to have a slightly higher confidence and they tend to perceive snippets of code as understandable more frequently than developers with less experience. There is also a low correlation between PBU and AIDQmin : if the internal APIs are well documented, developers tend to answer that they understood the snippet slightly more frequently. B. Time Needed for Perceived Understandability (TNPU) The time needed to answer “I understood the snippet” is (weakly) correlated with the programming experience, both PEgen (τ ≈ 0.16), and PEspec (τ ≈ 0.15). Surprisingly, the correlation is positive: the higher the experience, the higher the time needed to complete the comprehension step (and click the button “I understood the snippet”). This result seems to suggest that experienced developers tend to take more time to understand the snippets, while less experienced developers tend to complete the comprehension process more quickly. However, it is worth remembering that TNPU assesses the time needed for the perceived understandability, and not the actual one (TAU). C. Actual Understandability (AU) The metric that has the highest correlation with AU is the average Textual Coherence of the snippet (τ ≈ −0.16). The fact that the correlation is negative is surprising, because we expected a higher Textual Coherence to imply a higher understandability. Other examples of metrics correlated with AU are Number of parameters and DFT of conditionals (τ ≈ −0.15), indicating that higher complexity reduces understandability.
Color key
−1
−0.5
0
0.5
1
Correlation
0.13
0.16
0.11
PE (gen)
#numbers (avg)
0.15
0.12
PE (spec)
#operators (avg)
0.11
−0.15
Cyclomatic Comp. IMSQ (min)
0.11
0.12
#parenthesis (avg) #periods (avg)
−0.11
MIDQ (min)
Identifiers length (max)
AEDQ (min) EAP (min)
#keywords (max) −0.17
−0.12
−0.13
#identifiers (max)
AEDQ (avg)
#characters (max)
EAP (avg)
#words (max)
IMSQ (max)
Entropy
MIDQ (max)
Volume
Readability
LOC
ITID (avg)
#assignments (dft)
NMI (avg) NMI (max)
0.11
0.12
−0.15
−0.12
#comparisons (dft)
−0.18
#conditionals (dft)
CIC (avg)
Indentation length (dft)
CICsyn (avg)
−0.11
CICsyn (max)
0.11
0.15
−0.16
−0.11
#operators (dft)
NM (avg)
−0.12
#comments (Visual X)
NM (max)
−0.11
#identifiers (Visual X)
−0.17
TC (avg)
#numbers (Visual X)
0.1
TC (min)
#strings (Visual X)
−0.16
TC (max)
#strings (Visual Y)
#assignments (avg)
#literals (Visual X)
#blank lines (avg)
#identifiers (area)
0.1
#commas (avg)
−0.11
#keywords (area)
#comments (avg) 0.1
−0.12
−0.11
−0.15
0.11
#operators (area)
Identifiers length (avg)
#keywords/#comments (area)
#conditionals (avg)
#keywords/#identifiers (area)
Indentation length (avg)
#operators/#identifiers (area) #aligned blocks
Line length (avg) −0.12
#loops (avg)
0.12 −0.12
−0.15
−0.13
#nested blocks (avg)
−0.13
#parameters
TAU
AU
TNPU
#statements PBU
TAU
AU
TNPU
#identifiers (avg) PBU
#strings (area)
#comparisons (avg)
#keywords (avg)
0.11
Line length (dft) #numbers (dft)
CR −0.11
Line length (max)
MIDQ (avg)
Fig. 2. Heat-map of the correlation among metrics and understandability proxies
D. Timed Actual Understandability (TAU) The metric with the highest correlation with TAU is DFT of conditionals (τ ≈ −0.18). Again, high complexity reduces the understandability. It should be noticed that for TAU, i.e., actual understandability, we do not observe any correlation with the programming experience. E. Discussion Given the large and diverse set of metrics considered in our study, we expected to observe some form of correlation allowing us to start designing an understandability metric/model. However, what we obtained is a clear and bold negative result: none of the investigated metrics show a significant correlation with the snippets’ understandability.
An important implication of this finding is that readability and complexity metrics are not correlated with understandability, which is a result deserving additional empirical investigations. For instance, the snippet in Fig. 3 from Weka was understood by all the participants who evaluated such a snippet during the study (i.e., mean PBU = 1). Note also that the mean TAU = 0.72, i.e., the participants answered correctly two out of three the verification questions, on average. However, the snippet is considered as unreadable (0.14) when using the readability model proposed by Scalabrino et al. [14]. Another metric that has no correlation with understandability is LOC. Even if in our study we considered snippets with a small variation of LOCs (maximum 40), it would have
private void addButtons () { JButton okBut = new JButton ( " OK " ) ; JButton cancelBut = new JButton ( " Cancel " ) ; JPanel butHolder = new JPanel () ; butHolder . setLayout ( new GridLayout ( 1 , 2 ) ) ; butHolder . add ( okBut ) ; butHolder . add ( cancelBut ) ; add ( butHolder , BorderLayout . SOUTH ) ; okBut . addActionListener ( new ActionListener () { @Override public void actionPerformed ( ActionEvent e ) { if ( m_modifyListener != null ) { m_modifyListener . setModifiedStatus ( ClassifierPerformanceEvaluatorCustomizer . this , true ) ; } if ( m_evaluationMetrics . size () > 0) { StringBuilder b = new StringBuilder () ; for ( String s : m_evaluationMetrics ) { b. append (s ) . append ( " ," ) ; } String newList = b . substring (0 , b . length () - 1) ; m_cpe . setEvaluationMetricsToOutput ( newList ) ; } if ( m_parent != null ) { m_parent . dispose () ; } } }) ; cancelBut . addActionListener ( new ActionListener () { @Override public void actionPerformed ( ActionEvent e ) { customizerClosing () ; if ( m_parent != null ) { m_parent . dispose () ; } } }) ; }
Fig. 3. Example of understandable snippet with low readability
been reasonable to expect at least a small correlation with understandability. Almost all of the metrics that we introduced in this study to capture aspects of code reasonably related to understandability do not correlate with any of the considered proxies. The only exception is AIDQmin (API Internal Documentation Quality). Indeed, such a metric has a low correlation with both PBU and TAU. This result does not completely exclude the fact that external documentation, quality of identifiers and popularity of external APIs could play a role in the automatic assessment of code understandability, but it underlines that designing metrics able to capture such an aspect is far from trivial and represents a big challenge for the research community. Finally, we should not exclude the possibility that code understandability is simply too subjective to be captured by any metric. However, the research community has been able to successfully define proxies for other highly subjective code properties in the past, such as code readability. For this reason, we believe that more research targeting the automatic assessment of code understandability still represents an important and valuable research direction. VI. T HREATS TO VALIDITY Threats to construct validity, concerning the relation between theory and observation, are mainly due to the measurements we performed, both in terms of the 121 metrics that we studied as well as when defining the four independent variables for the understandability level. Concerning the 121
metrics, we tested our implementation and, when needed (e.g., for the IM SQ metric during the identifiers splitting/expansion), relied on manual intervention to ensure the correctness of the computed metrics. As for the independent variables, we tried to capture both the perceived and the actual code understandability. However, different results might be achieved by exploiting different variables. Threats to internal validity concern external factors we did not consider that could affect the variables and the relations being investigated. Since two of the understandability proxies are time-related (i.e., they are based on the time participants spent while understanding the code), it is possible that some participants were interrupted by external events while performing the comprehension task. For this reason, we excluded outliers (i.e., participants requiring more than Q3 +(2.5×IQR) seconds to understand a code snippet, where Q3 is the third quartile and IQR is the Inter Quartile Range). Threats to conclusion validity concern the relation between the treatment and the outcome. Although this is mainly an observational study, wherever possible we used an appropriate support of statistical procedures. Threats to external validity concern the generalizability of our findings. Our study has been performed on a large, but limited, set of metrics and by involving 46 participants comprehending a subset of 50 methods extracted from 10 Java systems. Clearly, our findings hold for the considered population of participants and for Java code. Larger studies possibly involving more participants and code snippets written in other languages should be performed to corroborate or contradict our results. VII. C ONCLUSION AND F UTURE W ORK We presented an empirical study investigating the correlation between code understandability and 121 metrics related to the code itself, to the documentation available for it, and to the developer understanding it. We asked 46 developers to understand 50 Java snippets, and we gathered a total of 324 evaluations. We assessed the perceived and actual participants’ understanding for each snippet they inspected and the time they needed for the comprehension process. Our results demonstrate that, in most of the cases, there is no correlation between the considered metrics and code understandability. In the few cases where we observed a correlation, its magnitude is very small. The most important (and surprising) conclusions of our study are that (i) there is no correlation between understandability and readability, and (ii) metrics generally used for effort estimation and commonly associated with understandability, such as cyclomatic complexity, actually have low or no correlation with understandability. Our study lays the foundations for future research on new metrics actually able to capture facets of code understandability. For this reason, we publicly release our dataset to enable the research community to investigate this direction further. Acknowledgments. Bavota was supported in part by the SNF project JITRA, No. 172479.
R EFERENCES [1] R. Minelli, A. Mocci, and M. Lanza, “I know what you did last summer - an investigation of how developers spend their time,” in 23rd IEEE International Conference on Program Comprehension, 2015, pp. 25–35. [2] K. K. Aggarwal, Y. Singh, and J. K. Chhabra, “An integrated measure of software maintainability,” in Annual Reliability and Maintainability Symposium., 2002, pp. 235–241. [3] M. Thongmak and P. Muenchaisri, Measuring Understandability of Aspect-Oriented Code. Berlin, Heidelberg: Springer Berlin Heidelberg, 2011, pp. 43–54. [4] J. c. Lin and K. c. Wu, “A model for measuring software understandability,” in 6th IEEE International Conference on Computer and Information Technology, 2006, pp. 192–192. [5] T. Roehm, R. Tiarks, R. Koschke, and W. Maalej, “How do professional developers comprehend software?” in 34th International Conference on Software Engineering (ICSE), 2012, pp. 255–265. [6] D. Srinivasulu, A. Sridhar, and D. P. Mohapatra, Evaluation of Software Understandability Using Rough Sets. New Delhi: Springer India, 2014, pp. 939–946. [7] C. Chen, R. Alfayez, K. Srisopha, L. Shi, and B. Boehm, Evaluating Human-Assessed Software Maintainability Metrics. Singapore: Springer Singapore, 2016, pp. 120–132. [8] M. A. Storey, “Theories, methods and tools in program comprehension: past, present and future,” in 13th International Workshop on Program Comprehension, 2005, pp. 181–191. [9] M. A. D. Storey, K. Wong, and H. A. Muller, “How do program understanding tools affect how programmers understand programs?” in 4th Working Conference on Reverse Engineering, 1997, pp. 12–21. [10] R. P. L. Buse and W. Weimer, “Learning a metric for code readability,” IEEE Transactions on Software Engineering, vol. 36, no. 4, pp. 546–558, 2010. [11] D. Posnett, A. Hindle, and P. T. Devanbu, “A simpler model of software readability.” in 8th Working Conference on Mining Software Repositories, 2011, pp. 73–82. [12] J. Dorn, “A general software readability model,” Master’s thesis, University of Virginia, Department of Computer Science, https://www.cs.virginia.edu/~weimer/students/dorn-mcs-paper.pdf, 2012. [13] E. Daka, J. Campos, G. Fraser, J. Dorn, and W. Weimer, “Modeling readability to improve unit tests,” in 10th Joint Meeting of the European Software Engineering Conference and the ACM SIGSOFT Symposium on the Foundations of Software Engineering, 2015, pp. 107–118. [14] S. Scalabrino, M. Linares-Vásquez, D. Poshyvanyk, and R. Oliveto, “Improving code readability models with textual features,” in 24th IEEE International Conference on Program Comprehension, 2016. [15] J.-C. Lin and K.-C. Wu, “Evaluation of software understandability based on fuzzy matrix,” in IEEE International Conference on Fuzzy Systems, 2008, pp. 887–892. [16] M. Bartsch and R. Harrison, “An exploratory study of the effect of aspect-oriented programming on maintainability,” Software Quality Journal, vol. 16, no. 1, pp. 23–44, 2008.
[17] A. Capiluppi, M. Morisio, and P. Lago, “Evolution of understandability in oss projects,” in 8th European Conference on Software Maintenance and Reengineering, 2004, pp. 58–66. [18] D. Lawrie, C. Morrell, H. Feild, and D. Binkley, “Effective identifier names for comprehension and memory.” Innovations in Systems and Software Engineering, vol. 3, no. 4, pp. 303–318, 2007. [19] ——, “What’s in a name? a study of identifiers,” in 14th International Conference on Program Comprehension, 2006. [20] B. Caprile and P. Tonella, “Restructuring program identifier names,” in International Conference on Software Maintenance, 2000, pp. 97–107. [21] D. Lawrie, H. Feild, and D. Binkley, “Syntactic identifier conciseness and consistency,” in 6th International Working Conference on Source Code Analysis and Manipulation, 2006, pp. 139–148. [22] E. Enslen, E. Hill, L. L. Pollock, and K. Vijay-Shanker, “Mining source code to automatically split identifiers for software analysis,” in 6th Working Conference on Mining Software Repositories, 2009. [23] V. Arnaoudova, M. Di Penta, and G. Antoniol, “Linguistic antipatterns: What they are and how developers perceive them,” Empirical Software Engineering, vol. 21, no. 1, pp. 104–158, 2015. [24] S. Misra and I. Akman, “Comparative study of cognitive complexity measures,” in 23rd International Symposium on Computer and Information Sciences, Oct 2008, pp. 1–4. [25] E. J. Weyuker, “Evaluating software complexity measures,” IEEE Transactions on Software Engineering, vol. 14, no. 9, pp. 1357–1365, 1988. [26] J. Bansiya and C. G. Davis, “A hierarchical model for object-oriented design quality assessment,” IEEE Transactions on Software Engineering, vol. 28, no. 1, pp. 4–17, Jan 2002. [27] N. Kasto and J. Whalley, “Measuring the difficulty of code comprehension tasks using software metrics,” in 15th Australasian Computing Education Conference. Australian Computer Society, Inc., 2013, pp. 59–65. [28] K. Shima, Y. Takemura, and K. Matsumoto, “An approach to experimental evaluation of software understandability,” in International Symposium on Empirical Software Engineering, 2002, pp. 48–55. [29] ISO/IEC. Iso/iec 9126 software engineering — product quality — part 1: Quality model. [30] T. J. McCabe, “A complexity measure,” IEEE Transactions on software Engineering, no. 4, pp. 308–320, 1976. [31] S. Scalabrino, G. Bavota, C. Vendome, M. Linares-Vásquez, D. Poshyvanyk, and R. Oliveto, “Replication package.” https://dibt.unimol.it/report/understandability. [32] R. F. Flesch, How to write plain English: A book for lawyers and consumers. Harpercollins, 1979. [33] D. Schreck, V. Dallmeier, and T. Zimmermann, “How documentation evolves over time,” in Ninth International Workshop on Principles of Software Evolution. ACM, 2007, pp. 4–10. [34] J. Kleinberg and É. Tardos, Algorithm design. Pearson Education India. [35] J. W. Tukey, “Exploratory data analysis,” 1977. [36] M. G. Kendall, “A new measure of rank correlation,” Biometrika, vol. 30, no. 1-2, p. 81, 1938. [37] J. Cohen, Statistical power analysis for the behavioral sciences, 2nd ed. Lawrence Earlbaum Associates, 1988.