Automatically Detecting Pointing Performance Amy Hurst, Scott E. Hudson, Jennifer Mankoff Human Computer Interaction Institute Carnegie Mellon University 5000 Forbes Ave, Pittsburgh, PA 15213 {akhurst, scott.hudson,
[email protected]}
Shari Trewin T.J. Watson Research Center IBM P.O. Box 704, Yorktown Heights NY 10598
[email protected] One of the main reasons computers are inaccessible is that they treat all users the same, and usually do not know much about each individual user. This is particularly unfortunate given the amount of accessibility software that comes preinstalled on most computers or is available online including pointer configuration utilities, screen magnifiers, and onscreen keyboards. Not only do most users not know what technology they need to make a computer accessible, insurance limitations and high cost can prevent them from having an assistive technology clinician assess their ability. As a result, it is not uncommon for people to end up using either no accessibility tools, or tools that are not suited for their pointing abilities.
ABSTRACT
Since not all persons interact with computer systems in the same way, computer systems should not interact with all individuals in the same way. This paper presents a significant step in automatically detecting characteristics of persons with a wide range of abilities based on observing their user input events. Three datasets are used to build learned statistical models on pointing data collected in a laboratory setting from individuals with varying ability to use computer pointing devices. The first dataset is used to distinguish between pointing behaviors from individuals with pointing problems vs. individuals without with 92.7% accuracy. The second is used to distinguish between pointing data from Young Adults and Adults vs. Older Adults vs. individuals with Parkinson’s Disease with 91.6% accuracy. The final data set is used to predict the need for a specific adaptation based on a user’s performance with 94.4% accuracy. These results suggest that it may be feasible to use such models to automatically identify computer users who would benefit from accessibility tools, and to even make specific tool recommendations.
We envision making computers more accessible to a wider range of users by automatically assessing a user’s pointing performance and adapting to it. This would be accomplished by deploying software adaptations, or changes to how the pointing device interacts with on-screen elements, that could improve a user’s current performance. This approach can provide practical and affordable solutions since it does not require additional hardware or assistive technology assessments by clinicians.
Author Keywords
Accessibility, Motor Impairments, Activity Recognition, Learned Statistical Models, Interaction Techniques.
In this paper we first describe common pointing problems and discuss research and commercial technologies that have been developed to address some of these problems. Second, we discuss our work towards automatic assessment through statistical modeling of three datasets. We have constructed learned statistical models that are able to distinguish between pointing actions from individuals with and without physical impairments, that cause pointing problems, with 92.7% accuracy, and distinguish between 3 classes of users with similar ages and motor abilities with 91.6% accuracy. We next report our models that able to predict if an individual would benefit from the Steady Click [11] adaptation with 94.4% accuracy. We conclude with future work.
ACM Classification Keywords
H5.m. Information interfaces and presentation (e.g., HCI): Miscellaneous. INTRODUCTION
Computer technology has become an integral component in people’s lives for employment, recreation, and socializing. Unfortunately, computers are not universally accessible and there is a growing population of people who are motivated to use computers, but find it physically difficult to do so. Permission to make digital or hard copies of part or all of this work for personal or classroom use is granted without fee provided that copies are not made or distributed for profit or commercial advantage and that copies bear this notice and the full citation on the first page. Copyrights for components of t! his work owned by others than ACM must be honored. Abstracting with credit is permitted. To copy otherwise, to republish, to post on servers or to redistribute to lists, requires prior specific permission and/or a fee. IUI'08, January 13-16, 2008, Maspalomas, Gran Canaria, Spain. Copyright 2008 ACM 978-1-59593-987-6/ 08/ 0001 $5.00
COMMON POINTING PROBLEMS
Physical difficulty accessing a computer can be caused by many factors including a physical impairment or agerelated changes in motor coordination. Pointing errors often occur when the user knows what he or she wants to do but cannot successfully complete the physical action. Below is a list adapted from [10] which describes many common pointing problems reported in the literature, and some of the
1
software solutions that have been designed to minimize those problems. This list is divided into four categories of pointing subtasks: clicking, drag and drop, targeting, and navigation, focusing on errors that could be easily addressed with software. The problem is listed in italics followed by possible software solutions to that problem. Clicking Pressing incorrect physical button - Remap button functions or replace clicking with another style of activation such as Crossing [1]. Difficulty with double click timing - Change double click timing. Accidental click (Unintentional clicks made during another action) – Ignore clicks when pointer is moving. Repeated click (Additional clicks made during a click action)– Ignore multiple clicks on the same target, or cap the clicking rate. Drag and Drop Difficulty keeping mouse button pressed during drag (causing user to drop too early) – Click Lock setting which makes the mouse button a toggle so user can drag without keeping the button down. Targeting Errors Difficulty moving mouse to a target (Overshooting) – Make it easier to get onto a target by predicting what target the user is moving towards [7]; gravitate cursor towards possible targets [13]; or help the user “feel” the boundaries of a target [4]. Difficulty staying on target (user moves pointer before clicking) – Make it harder to leave a target once on it [4,13] (or user moves mouse during click and falls off target) – Freeze mouse cursor while button is pressed [9]. Navigation (Target Independent) Difficulty moving mouse large or small distances (Due to user’s range of motion or degree of control.) – Adjust “Gain” or ratio between physical movement to cursor movement [6] Difficulty keeping mouse motion steady (may be result of tremor or spasticity) - Filter spurious mouse movements or aggregate mouse movements to infer direction or predict target. Many of these errors can cause a user to restart or undo subsequent actions, which usually increases the total time to complete the action. AUTOMATICALLY DETECTING MOTOR PERFORMANCE
Several of the technology solutions described in the previous section are readily available for users to download or are built in to modern operating systems. However, while
these technologies have improved access for many users, they have not solved all accessibility problems. Many users do not know that these facilities are available or do not know how to tune the software to their needs. Such problems are frequently solved by assistive technology experts who perform an assessment of an individual’s abilities and help select and configure accessibility technology. Unfortunately, this can be an expensive process and not available to everyone. Frequent assessments are important because most users’ performance abilities change over time, for example, with the progression of a degenerative disease. Unfortunately, tuning these technologies to one’s performance is not easy, as many of these technologies require the user to make decisions about unfamiliar settings, or assume a default average value. Creating software that is able to provide frequent assessment, or automatically tune the parameters of a software utility is a very practical solution in terms of cost to an individual. Static adaptations can be especially problematic for individuals with frequently changing abilities. For example, an individual with Parkinson’s disease may experience dramatic performance differences due to their medication. As a result, the range of abilities a person exhibits throughout a day can be huge: e.g., medications may temporarily completely suppress the tremor of someone who could not use a mouse at other times. Even if expert assessments were widely available, they could not provide dynamic adaptation to support high variability performance changes, such as fatigue. Many of the adaptations described in our list can be extremely helpful in addressing the specific need they were designed for, however some can sometimes inhibit efficient performance of pointing tasks. For example, if a long click adaptation is used such that short, accidental clicks can be filtered out, then the user must make all of their clicks long. However, if accidental clicks could be identified based on features of the movement, then this adaptation could only be deployed when the user needed it; without requiring the user to change their deliberate clicking behavior. Overall, in order to be most successful, assistive computer technology must be able to adjust to the user and adapt to their current performance dynamically. We are working to automatically detect pointing performance to learn how to deploy adaptations at the correct time. Our approach relies on building general models that could be deployed to make classifications without prior knowledge of the participant’s ability. The best way to build models that will generalize is to use large datasets of pointing actions that represent a wide range of problems. Ideally these examples are representative of problems that happen in everyday or real world computer use. Unfortunately, extracting movement trajectories and target sizes from real world data is not easy (although it can be done through hand coding, programmatic accessibility
hooks, computer vision or hybrid techniques [4]). While validation with real world data will be needed, an important first step is to demonstrate the feasibility of this approach with laboratory data.
Tree learning algorithm [12] as implemented in the WEKA machine learning environment [14]. In addition to classification accuracy, we use the Kappa Statistic [14] to measure the agreement between predicted and observed classifications of the dataset. This measure corrects for agreement that occurs by chance, and is reported as a number between 0 and 1, where 1 is 100% agreement, and a value of 0.7 is acceptable agreement [8]. The prior probability, or simply prior, is also important to understanding the accuracy of a prediction. The prior is the accuracy one would obtain using a trivial classifier which always selected the most frequent class as it’s prediction.
Methodology In the following sections we will describe learned statistical models we constructed from three datasets to distinguish between pointing performance in different populations. All three of these datasets were collected in independent laboratory studies [5,6,11], (in two cases also augmented with additional new data from able-bodied participants) and reanalyzed here to test the feasibility of creating predictive models. Participants in all of these studies performed pointing tasks where they were told to move to a specific target and click on it.
We test the generalizability of the learned statistical models with two methods: per-person and random hold out cross validation. These techniques are used to provide an estimation of how the classifier will perform on new data, through multiple groupings and tests of the existing data. In both of these types of cross validation, a subset of data is withheld, and the remainder, or training set, is used to build a model. The subsequent model is then used to predict the held out data, or test set, that was not used to build the model. This process is performed several times with different data held out to get the most reliable estimates. For both approaches, the accuracy of the classifier is reported as an average of the accuracy of each test set on its corresponding training set.
Machine learning techniques were employed to distinguish between different levels of performance. Each dataset was segmented into a set of movement trials which served as training instances (or simply instances for short). All three of the datasets we analyzed define an instance as movement followed by a click on the target. Each such instance is labeled with an indication of the properties of the user who performed it, for example whether subsequent tests indicated that the user would benefit from a particular adaptation. It is these labels that our statistical models, or classifiers, attempt to predict.
In per-person hold out, the model is built with a training set from all data but one randomly selected participant, and then tested with that participant’s data. This procedure is repeated with 10 individuals from each group to be classified. To perform a random hold out 10-fold cross validation, 90% of the total data (from all participants) is randomly selected as the training set and is used to build a classifier. The remaining 10% is then used as a test set on that classifier. This process is performed 10 times with 10 disjoint hold out test sets and the average accuracy of these 10 trials is reported.
Information associated with the details of each movement instance is summarized into a set of features that quantify the performance of each interaction. Examples of potential features to describe a pointing task include the amount of time it took to perform the instance, the number of pauses during movement, or a count of the number of times the mouse button was pressed. A statistical model works by finding correlations between the occurrence of certain features and the occurrence of the property it tries to predict (the label for each instance). Once a statistical model has been created (learned), it can take the features associated with a new motion and use these to make a prediction about the properties of the user who made that motion and if they would benefit from a particular adaptation.
We report results for both types of hold out to simulate what would happen after a constructed model is deployed and encounters new data. Per-person hold out is analogous to the situation where a completely new user appears whose data was not used to create the models. It tends to produce more realistic results for settings in which we expect high individual variation and/or low independence between training instances taken from the same individual. However, it is not possible or practical to apply per-person hold out tests for some types of problems or datasets. For example, per person holdout tests tend to be overly pessimistic when there are small numbers of users or where a single individual provides a notable fraction of all data in a particular class. On the other hand, one can almost always do random hold out 10-fold validation. Since it is applicable to almost all problems and can work well even with small datasets, 10-fold random holdout has emerged as the standard reporting method.
Since our analysis primarily makes use of the features gathered in the original studies, each dataset has a slightly different set of features. Since not all features necessarily contribute to creating a good classifier, we employ feature selection algorithms to provide an indication of how valuable each feature may be at constructing a classifier. To select features that are finely tuned to a particular learning algorithm, while taking into account any information overlap, we employ a wrapper-based feature selection approach [6]. This approach performs a combinatoric optimization to choose the subset of features that produces the best accuracy for a given type of classifier. All classifiers were built with the C4.5 Decision 3
Movement Difficulties
Behaviors
of
People
With
Pointing
We will first discuss our success at identifying pointer movements from individuals who have difficulty pointing with a mouse. This analysis is performed on a range of individuals who are grouped according to whether or not they have difficulty with pointing tasks on a computer versus those who do not have difficulty.
•
Features Related to the Click •
Participants completed Fitts’ Law-style pointing tasks using the IDA Software Suite [6]. IDA is a software tool to assess an individual’s ability to access a computer based on performance with a range of computer skill tasks. To evaluate pointing performance, all participants completed 32 trials of a pointing task with at least 10 different mouse gain settings. Each trial presented the user with a square box that varied in size and distance from the box in a previous trial. All participants started the tasks with a mouse gain of 10, and Enhanced Pointer Precision on. After each block of 32 targets at a given gain setting, IDA would calculate the user’s performance using an algorithm described in [6] and would then try another gain setting until it had enough data to predict the “best” one. Features This section presents the features, or details of each movement instance in this dataset. The features are organized into four categories that will be used in all three datasets, including features calculated from the movement that are specific to this task, features that describe what happened during the click, features that describe the pointer’s motion, and features that describe pauses in the pointer’s motion. Task Specific Features •
Did the user correctly select the target?
•
How long did it take to finish the trial?
•
How many times did the cursor enter the target?
Count of “Missed” or accidental clicks
Features Related to Movement •
Deceleration time, or how long it took to move from peak velocity to maximum displacement, divided by total movement duration
•
Total distance traveled during trial
•
Mean instantaneous velocity during initial movement towards target
•
Number of direction changes
Methodology As a first step to learn about performance differences between people who have difficulty with pointing and clicking versus those who do not, we analyzed laboratory data from both groups. We used the dataset described in [6] which was gathered from individuals who had physical impairments which affected their ability to use a mouse, and collected a corresponding new dataset from students at our university. The combined dataset included data from 33 participants (21 able bodied, 17 female). The diagnoses in the motor impaired group varied included the following conditions {6 Spinal Cord Injury (2 C4/5, 2 C5/6, 1 C7, 1 unknown), 1 Traumatic Brain Injury, 2 Cerebral Palsy, 1 Friedrich’s Ataxia, 1 Multiple Sclerosis, 1 Muscular Dystrophy}. All but two of the motor impaired participants completed these trials using a standard mouse.
Maximum distance traveled beyond the target, or “Overshoot”
Pause Features •
Time spent before first movement of the trial, or “Reaction Time”
Model Building We constructed a decision tree classifier using wrapperbased feature selection using data from all of the participants in the motor impaired group, and with an equal number of randomly selected participants from the other group. As illustrated in the confusion matrix below (Table 1) we were able to build classifiers that were able to correctly identify the class with 92.7% accuracy (Kappa = .85) as measured by per-person hold out. Since 24 separate models were constructed (one for each person held out) slightly different feature sets were selected for each of these models. However, all of these feature selection runs selected the total time it took to complete the action and the number of clicks that occurred during the action. We also conducted analysis with random 10-fold cross validation and wrapper selected features which correctly classified the instances with 94.5% accuracy (Kappa = .89). This feature selection also chose in each case the total time to complete the action, number of clicks that occurred during the action, and in addition chose the number of times Classified as Actual Motor problems No motor problems
Motor problems 3779
No motor problems 477
138
4278
Accuracy: 92.7% Prior: 50.9% Table 1. Confusion matrix for classification distinguishing between motor impaired individuals that have pointing problems versus able bodied users
the cursor entered the target, as the features to use in the model. MOVEMENT BEHAVIORS OF YOUNG ADULTS, ADULTS, OLDER ADULTS AND INDIVIDUALS WITH PARKINSON’S DISEASE
The previous result indicated that the statistical models are capable of identifying user’s ease of pointing with high accuracy. While it is an important and valuable first step to distinguish between groups with and without pointing difficulties, this classification may be too broad to make many accommodations. Instead, we need to be able to make a finer distinction based on what kinds of errors those individuals are making. Unfortunately, the dataset discussed in the previous section does not have enough examples of particular types of motor impaired performance to confidently distinguish multiple classes of performance. As a second step, in this section we look at another dataset from four groups of users, three of whom have significantly different performance abilities.
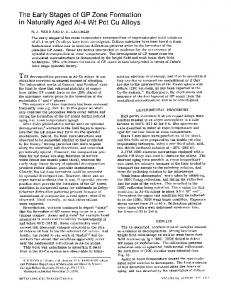
Figure 1. Augmented screenshot of the click task showing an example sequence of the first 4 targets out of a series of 37. Each target has a random angle of approach, and one of 3 size/distance pairs.
Methodology This data was gathered in a study that examined the effects of age and Parkinson’s Disease on a point-and-click task using a mouse [5]. It includes pointing performance from the following four groups: Young Adults (8 participants, ages 20-30), Adults (8 participants, ages 35-65), Older Adults (7 participants, ages 70 and older), and individuals with Parkinson’s Disease (6 participants, ages 48-63). A more detailed summary of this population is described in [5].
•
Length of click
•
Distance and angle moved during the click, or “Slips”
•
Time between mouse down event and preceding movement
•
Count of “Missed” or accidental clicks
Features Related to Movement
In a statistical analysis of the original dataset, Keates and Trewin found that older adults took longer to complete the task and they paused more than the other three groups. Additionally it took older adults four times as long to reach peak velocity as it did adults and young adults. Individuals with Parkinson’s Disease showed the lowest peak velocity out of all the groups; less than half of that of the young adults and adults. Finally, individuals with Parkinson’s Disease tended to pause towards the end of the movement.
•
Average and peak velocity and acceleration during the movement phase of the trial.
•
Number of direction changes
•
Total distance traveled during trial
•
Movement error, offset and variability
Pause Features •
Count of the number of pauses of different lengths (from 0 msec to 2500+ msec) during the trial
Features
Model Building
This data set provided detailed recordings of point-andclick task performances, allowing a more sophisticated set of features to be employed. This feature set differs from the previous one because it has more features describing when the pauses occurred, as well as features related to acceleration and velocity changes. Having these additional features enabled us to build a more detailed picture of the difference between groups.
We were able to reproduce the high accuracy of distinguishing motor impaired from able-bodied use in this dataset even though it involved a slightly different task, and feature set. In a two-way classification between a group of adults and young adults versus a group of older adults and Parkinson’s individuals a learned statistical model gave a classification accuracy of 94.6% (Kappa = .89) using a decision tree and validated with random 10-fold cross validation.
Task Specific Features •
Total time trial time
•
Number of times the cursor entered the target
A similarly constructed model was able to distinguish differences between the Parkinson’s and older adult group with 91.4% accuracy (Kappa = .83). In a 3-way classification with the adult and younger adult vs. Parkinson’s vs. older adult groups, we were able to build a learned statistical model with a decision tree and wrapper-
Features Related to the Click
5
based feature selection that performed with 91.6% accuracy (Kappa = .85) as validated with random 10-fold cross validation. Table 2 shows the results of other possible 3 way pairings. Labels
Classification Accuracy
Kappa Statistic
YA + A, P, OA
91.6
.85
A, P, OA
89.7
.84
YA, P, OA
98.9
.85
Table 2. Performance of statistical models using 3-way analysis {YA = Young Adult, A = Adult, OA = Older Adult, P = Individual with Parkinson’s Disease}
Unfortunately this level of accuracy did not appear for this dataset when we leveled per-person holdout. We conducted a 3-way classification of this data using per-person holdout using 7 randomly selected young adults or adults, the 7 older adults, and the 6 individuals with Parkinson’s Disease as testing data. Predictions were made with a decision tree using wrapper selected features. The models were able to predict the test participant’s class with 74.1% accuracy (Kappa = .58). We believe the performance of this model is not as high as with the random holdout because there was high variability in the data due to the small number of participants in each group, and performance differences between a few of the older adults and individuals with Parkinson’s Disease (Table 3). Classified as
Classified as Actual
A
YA
OA
P
YA
711
352
38
8 18
A
498
599
53
OA
58
48
755
P
22
13 45 Accuracy: 70.0% Prior: 28.8%
61 770
Table 4. Random 10-fold 4-way prediction {YA = Young Adult, A = adult, OA = Older Adult, P = Individual with Parkinson’s Disease}. Note the confusion between Adult and Young Adults.
Kappa = .95), and the lowest accuracy at distinguishing between the Adult and Young Adults (59.3%, Kappa = .19). The low accuracy at distinguishing between the young adult and adult groups suggests (not surprisingly) that these groups perform very similarly and are hard to distinguish. The wrapper based feature selection selected the following features for all pairs: length of the click, a count of amount of continuous movement, a count of pauses between 1500 and 2000 milliseconds before target. Labels
Classification Accuracy
Kappa
A, P
97.6
.95
A, OA
93.8
.87
A, YA
59.3
.19
P, OA
91.4
.83
Actual
YA + A
OA
P
YA + A
977
17
8
P, YA
96.7
.93
OA
105
533
207
OA, YA
93.3
.86
P
182
306
439
Accuracy: 74.1% Prior 36.1% Table 3. Per-person holdout confusion matrix {YA = Young Adult, A = Adult, OA = Older Adult, P = Individual with Parkinson’s Disease}
A 4-way classification using a decision tree with random 10-fold cross validation distinguished between the four groups with 70.0% accuracy (Kappa = .59). Not surprisingly, analysis of the confusion matrix (Table 4) for this classification problem shows that the classifier had the most difficulty distinguishing between the young adult and adult groups. In order to further understand how well learned statistical models behaved on this dataset, we built models to distinguish between each pairing of the groups We used features selected with a wrapper based feature selection to build a statistical model using a decision tree and random 10-fold cross validation for each paring of the groups (Table 5). These models found the highest accuracy when distinguishing between the Adult and Parkinson’s (96.7%,
Table 5. Classification results for all pairings {YA = Young Adult, A = adult, OA = Older Adult, P = Individual with Parkinson’s Disease} ANALYZING MOVEMENT BEHAVIORS TO PREDICT IF AN ADAPTATION IS NEEDED
Given our success at predicting with high likelihood which group a given movement instance came from, we wanted to learn how well we could predict if an individual would benefit from one of the adaptations based on data from their unadapted use. This classification is exactly the type a system would use to assess whether an adaptation should be deployed. In order to investigate this problem, we looked at a dataset that had data from individuals with and without a pointing adaptation. This dataset was collected to evaluate the performance of the “Steady Click” [11] adaptation that was designed to minimize pointer slips during a click. This adaptation creates a “Steady Click” by disabling dragging during a click (i.e. the user is not able to move the pointer, or slip, while one of the buttons is pressed). It was found
Features Related to the Click •
Duration of click
•
Number of other button events that occurred during a click
•
Distance pointer moved during the click
Features Related to Movement
Figure 2. Screen shot of study task showing how target cell is highlighted and how the user’s current location is also highlighted.
•
Velocity and acceleration at mouse down and mouse up events.
•
Peak velocity reached during the movement
•
How far did the pointer travel during movement?
that this adaptation significantly reduced slipping errors for 8 of the 11 participants, and lead to significantly improved target acquisition times for 5 participants. For some participants, suppression of slipping errors did not significantly improve performance because other targeting errors remained. For others, target acquisition times were reduced, but the improvement was not statistically significant, perhaps due to insufficient data. The work presented here uses error rates as the fundamental measure of the “helpfulness” of Steady Clicks.
Pause Features
Methodology
These features measure the state of the cursor at the time of the last pause before the click. There are 5 categories of features, with individual features varying the definition of a pause (in 50 msec increments between 100 and 300 msecs).
The Steady Click dataset consists of 18 participants performing clicking tasks. This dataset consists of 11 motor impaired adults (5 female, mean age 49) who were pre-screened as having slipping problems, or self reported such problems, and 7 able-bodied adults (4 female, mean age 41) who did not. Two of the participants with disabilities had Parkinson’s Disease, two had Cerebral Palsy, three had impairments results from a stroke, one had Multiple Sclerosis, another had spinal cord damage resulting from a gunshot accident, and two had impaired manual dexterity cause by unspecified neuromuscular conditions. All were familiar with a standard mouse and used that as their input device. All participants completed a task where they were presented with a 19-column and 30row grid of rectangles. Each rectangle was 52 pixels wide and 22 pixels tall and contained a 2 to 5 character word in it. For each trial one of the rectangles would be highlighted in blue and the user would need to move their mouse to that target and click in the rectangle (Figure 2).
How long did it take to complete the move-click sequence?
How far away was the cursor from the target at the start of the pause?
•
How much time was spent moving between the pause and the click?
•
How far did the cursor move between the end of the pause and the click?
•
What was the peak velocity between the pause and the click?
We used a two-level classifier to predict if individuals would benefit from the Steady Click adaptation. The first level of this classifier is a 3-way decision tree classification. The results of this 3-way classification, performed on each instance, are then used to classify each person (as “helped” or “not helped”) by considering whether the majority of
Task Specific Features
•
•
All the participants were grouped into three categories based on whether or not they had a motor impairment and whether the Steady Clicks adaptation significantly reduced their slip errors: Group 1: (H-I) Steady Clicks helped and they were motor impaired (8 participants) Group 2: (NH-I) Steady Clicks did not help and they were motor impaired (3 participants) Group 3: (NH-A) Steady Clicks did not help and no motor impairment (7 participants). Essentially, those who were helped by Steady Clicks were those who frequently slipped while clicking the mouse. We divide this data into three groups (instead of two) because early analysis indicated that the NH-I and NH-A had fairly different characteristics. Attempting to treat these disparate groups as a single category proved problematic for the classifier. The disabilities of those for whom Steady Clicks was not helpful were Parkinson’s Disease (2 individuals) and Cerebral Palsy.
In addition to many of the features that were represented in the previously discussed datasets, this dataset has many additional features relating to the last pause that occurred before the user moved the mouse. Was the click on the target?
How long was the last pause prior to the click?
Model Building
Features
•
•
7
Classified as Actual
H-I
NH-I
NH-A 11
H-I
716
96
NH-I
145
116
8
NH-A
11
8
506
Accuracy: 82.7% Prior: 51.0% Table 6. Confusion matrix for 3-way group classification (the first level in our overall two-level Steady Click improvement classifier).
their movement trials predicted them to be in the H-I group vs. the NH-I or NH-A groups. First we employed per-person hold out to build train/test sets, which were used to build decision trees using wrapper based feature selection for each participant. The most common features selected by the wrapper-based feature selection algorithm were the distance the participant slipped, the total time it took to complete the trial, and the length of the click. This 3-way classification distinguished between instances from these three groups with 82.7% accuracy (Kappa = .71), illustrated in Table 6. As indicated above, since our goal is to predict if Steady Clicks would help a given individual, in the second level of our model, we aggregated the results fo r the NH-I and NHA groups, and then classified each person based on the most frequently predicted group among their individual movements. Using this technique, we were able to correctly predict if Steady Clicks would reduce the user’s clicking errors 17 out of 18 times, or 94.4% accuracy. A random 10-fold cross validation of with wrapper based feature selection distinguished between these three groups with 92.0% (Kappa = .87). It selected the distance in the X direction the user was from the target during the last pause, the velocity at the time of the mouse release, length of the click, distance the participant slipped, peak velocity, duration of the trial, and total distance traveled during the trial as features. CONCLUSION AND FUTURE WORK
In this paper we described several learned statistical models that were constructed to detect pointing problems. We were able to distinguish between actions performed by users with pointing problems and users without pointing problems with 92.7% accuracy. We were also able to distinguish pointing actions made by young adults and adults vs. older adults vs. individuals with Parkinson’s Disease with 91.6% accuracy. Finally we presented a learned statistical model that was able to predict whether the Steady Click adaptation would help an individual to prevent slipping errors with 94.4% accuracy. Each of these results provide an important first steps towards our goal of developing software to automatically assess a user’s performance and deploy adaptations to make the computer more accessible.
Our future work includes testing the accuracy of these models on real world data and developing software to automatically detect pointing problems in the wild. We plan on collecting and analyzing data from motor impaired users who are performing real world computer tasks, and comparing those findings to these laboratory results. This data will also be used as a test set to develop techniques to automatically learn target locations in the interface, since this knowledge will make more adaptations possible. Finally we will combine all this knowledge to build learned statistical models that are able to predict what adaptations should be used for different levels of performance. ACKNOWLEDGMENTS
We would like the thank Heidi Koester, Ed Lopresti, and Rich Simpson for their contribution of motor impaired IDA data [6]. We also thank Jenny Hwang, Anish Mathur, Kelly Phouyaphone, and Austin Sung, for their help in collecting the IDA able-bodied dataset. This work was supported in part by the National Science Foundation under grants EEC-0540865, IIS-0713509, IIS0325351, the first author's NSF Graduate Student Research Fellowship; IBM Research; and the Pennsylvania Infrastructure Technology Alliance. REFERENCES
1. Accost, J. and Zhai, S. (2002) More than dotting the i’s – Foundations for crossing-based interfaces. In Proceeding CHI 2002, Minnesota, USA, April 2002, pp 73–80. 2. Grossman, T. and Balakrishnan, R. (2005) The bubble cursor: Enhancing target acquisition by dynamic resizing of the cursor’s activation area. In Proceedings of CHI ‘05, Portland, OR, USA, pp 281–290. 3. Hurst, A., Hudson, S. E., and Mankoff, J. 2007. Dynamic detection of novice vs. skilled use without a task model. In Proceedings of the SIGCHI Conference on Human Factors in Computing Systems (San Jose, California, USA, April 28 - May 03, 2007). CHI '07. ACM Press, New York, NY, 271-280. 4. Hurst, A., Mankoff, J., Dey, A. K., Hudson, S. E. 2007. Dirty Desktops: Using a Patina of Magnetic Mouse Dust To Make Common Interactor Targets Easier To Select. In Proceedings of the 20th Annual ACM Symposium on User interface Software and Technology (Newport, Rhode Island, USA, October 7-10, 2007). UIST ‘07. ACM Press, New York, NY. 5. Keates, S. and Trewin, S. 2005. Effect of age and Parkinson's disease on cursor positioning using a mouse. In Proceedings of the 7th international ACM SIGACCESS Conference on Computers and Accessibility (Baltimore, MD, USA, October 09 - 12, 2005). Assets '05. ACM Press, New York, NY, 68-75. 6. Koester, H. H., LoPresti, E., and Simpson, R. C. 2005. Toward Goldilocks' pointing device: determining a "just
right" gain setting for users with physical impairments. In Proceedings of the 7th international ACM SIGACCESS Conference on Computers and Accessibility (Baltimore, MD, USA, October 09 - 12, 2005). Assets '05. ACM Press, New York, NY, 84-89.
Strategies Employed. In Proceedings of the 3rd International Conference on Universal Access in Human-Computer Interaction. 11. Trewin, S., Keates, S., and Moffatt, K. 2007. Individual responses to a method of cursor assistance. In Disability and Rehabilitation: Assistive Technology, May 2007.
7. Kohavi, R., John, G. H. (1997). Wrappers for feature subset selection. Artificial Intelligence, 1-2, 273324.Learning, Morgan Kaufmann.
12. Quinlan, J.R. (1993). C4.5: Programs for Machine Learning, Morgan Kaufmann.
8. Krippendorff, Klaus, 1980. Content Analysis: an Introduction to its Methodology. Beverly Hills: Sage Publications.
13. Worden, A., Walker, N., Bharat, A., and Hudson, S. (1997) Making computers easier for older adults to use: Area cursors and sticky icons. In Proceedings of CHI ‘97, Atlanta GA, pp 266–271.
9. Lank, E., Cheng, Y. N., and Ruiz, J. 2007. Endpoint prediction using motion kinematics. In Proceedings of the SIGCHI Conference on Human Factors in Computing Systems (San Jose, California, USA, April 28 - May 03, 2007). CHI '07. ACM Press, New York, NY, 637-646.
14. Witten, I.H., Frank, E. (2005). Data Mining: Practical machine learning tools and techniques, 2nd Edition, Morgan Kaufmann, San Francisco.
10. Paradise, J., Trewin, S., & Keates, S. (2005). Using Pointing Devices: Difficulties Encountered and
9