Proceedings of the 37th Hawaii International Conference on System Sciences - 2004
Automating Power System Fault Diagnosis through Multi-Agent System Technology S. D. J. McArthur, E. M. Davidson, J.A. Hossack and J. R. McDonald Institute for Energy and Environment, University of Strathclyde, Glasgow, UK.
[email protected]
Abstract Fault diagnosis within electrical power systems is a time consuming and complex task. SCADA systems, digital fault recorders, travelling wave fault locators and other monitoring devices are drawn upon to inform the engineers of incidents, problems and faults. Extensive research by the authors has led to the conclusion that there are two issues which must be overcome. Firstly, the data capture and analysis activity is unmanageable in terms of time. Secondly, the data volume leads to engineers being overloaded with data to interpret. This paper describes how multi-agent system technology, combined with intelligent systems, can be used to automate the fault diagnosis activity. Within the multi-agent system, knowledge-based and modelbased reasoning are employed to automatically interpret SCADA system data and fault records. These techniques and the design of the multi-agent system architecture that integrates them are described. Consequently, the use of Engineering Assistant agents as a means of providing engineers with decision support, in terms of timely and summarised diagnostic information tailored to meet their personal requirements, is discussed. .
1. Introduction Protection engineers use data from a range of monitoring devices to perform post-fault disturbance diagnosis. The objective is to identify faults or disturbances on the power system and ascertain whether or not the relevant protection schemes responded correctly. Through this, maloperation and faulty components can be identified and the relevant action taken, e.g. review of protection settings. A number of useful protection analysis tools have been developed by the research community to provide assistance with the tasks undertaken during disturbance diagnosis, such as alarm interpretation [1][2][3], fault
classification [4] and the assessment of protection performance [4][5] from digital fault recorder (DFR) data. Although these standalone intelligent systems assist with particular aspects of the diagnostic process, manual intervention is still required to collate and interpret much of the information generated. During storm conditions DFR data can be particularly problematic. Firstly there is the problem of data overload; DFRs on circuits other than those directly experiencing a disturbance may trigger due to voltage dips caused by the fault, and generate fault records of no immediate interest. Secondly, there is the problem of lost data; when fault records are retrieved by ‘autopolling’ it may be several hours before the DFR of interest is polled. If the transmission network experiences a large number of disturbances over a short period, records can be overwritten by the DFR’s ‘rolling buffer’ before they have been retrieved for analysis. While existing protection analysis tools can be used to analyse disparate data sources, the entire process, including data gathering and timely presentation of the information to engineers, requires automation. Recognising that Multi-Agent Systems (MAS) [6] provide an effective means of integrating protection analysis tools into a flexible and scalable architecture, the authors have undertaken research concerning the design and implementation of a MAS to meet the requirements for comprehensive and automated postfault diagnosis for utility protection engineers. The multi-agent architecture resulting from this research is entitled Protection Engineering Diagnostic Agents (PEDA) [7]. This paper describes PEDA, which was designed for deployment in a UK utility, SP Power Systems. The paper also briefly details how each agent performs its data interpretation.
2. Post-fault Diagnosis Using SCADA and Digital Fault Recorder Data The most common situation where engineers experience an overload of data is during or just after a
0-7695-2056-1/04 $17.00 (C) 2004 IEEE
1
Proceedings of the 37th Hawaii International Conference on System Sciences - 2004
storm. For example, for a storm lasting 24 hours, SP Power Systems monitoring systems can generate in excess of 15000 alarms and hundreds of fault records. Assessment of protection operation begins with analysis of the SCADA data, which allows engineers to: • Identify power systems disturbances and the circuits affected by the disturbance; and • Validate some aspects of protection operation, e.g. missing protection or inter-trip alarms suggest that part of the protection scheme may have failed to operate. Protection engineers at SP Power Systems currently use a Knowledge-based System (KBS), known as the ‘Telemetry Processor’ to automate the analysis of SCADA and produce this information. Knowledge of which circuits have been affected by a particular disturbance can then be used to focus the retrieval of the relevant fault records. Once retrieved, the operation of protection can be assessed using detailed timing information derived from the records. The authors have developed a software-based set of tools [8] which employs model-based reasoning (MBR) to validate the operation of protection using a library of protection models. The tool-set propagates the DFR data through a model of the protection scheme under test, compares the actual relay behaviour with that predicted by the model and identifies any protection scheme components that may not have operated correctly. However, before the DFR data can be analysed using MBR techniques, it requires some processing. The data has to be transformed from the COMTRADE format to the format used by the tool-set. The module that prepares the fault records also provides interpretation of the fault records, identifying the type of fault and clearance times.
Protection Protection Engineering Decision Support ProtectionEngineering EngineeringDecision DecisionSupport Support Validated Protection
Interpreted SCADA
MBR Analysis of Protection Validation & Diagnosis DFR data
KBS Incident Analysis & Event of Identification SCADA
Interpreted Fault Records
Provide Interpreted Disturbance Fault Records
Circuit affected by the
SCADA
Fault Data Record Interpretation Preparation Indicate Disturbance Fault Records Fault FaultRecord Record Retrieval Retrieval
fault
DialupDFR’s associated with the fault and retrieve records DFR 3
Transmission Transmission Network Network DFR 1
DFR 2
SubC cb3 DFR 3
cb1 SubA
R-Y-E R-Y-E Fault Fault
cb2
SubD SubB cb4
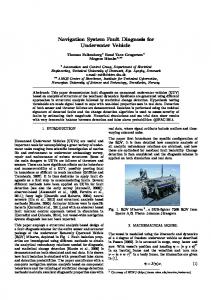
Fig 1. Post-fault disturbance diagnosis using existing tools for analysis. Each tool produces information that is valuable for decision support and information that can be used to focus the next stage of the analysis of the data.
Figure 1 shows the entire post-fault diagnosis process using these tools. Earlier research by the authors showed how integrating these tools could automate and enhance decision support for engineers [5]. However, traditional software architectures for integrating these different tools proved too inflexible for the following reasons: • Integrating new data sources and analysis tools could prove difficult due to the hardwiring of interfaces between tools; and • Dealing with intermittent communications between the different tools could be problematic. This led the authors to investigate the use of multiagent systems to overcome these difficulties. .
3. Integration Using Multi-agent Systems Multi-agent system technology provides an ideal means of achieving systems integration by ‘wrapping’ disparate systems as ‘intelligent agents’ (Fig. 2).
0-7695-2056-1/04 $17.00 (C) 2004 IEEE
2
Proceedings of the 37th Hawaii International Conference on System Sciences - 2004
The facilitator agent is one of two utility agents in the PEDA multi-agent system. It acts as a yellow pages and provides a list of all the abilities and resources which the agents within the multi-agent system can provide. A PEDA agents uses the facilitator to find agents which can provide it with the information it needs in order to perform its particular core task.
IS IS Intelligent System
IS
Reasoning Knowledge
IS
Messaging Functionality IS
Intelligent Agent
Multi-agent System
Fig. 2. Using agent wrappers, legacy intelligent systems can be ‘wrapped’ as agents and introduced multi-agent systems. Each of the functional modules in fig. 1 are wrapped as agents as in this figure.
The agent wrapper provides the system being wrapped with rules and knowledge enabling it to react within its environment and automate its internal function and reasoning. By giving the agent this autonomy, it possible to overcome the problems associated with intermittent communications between tools. Agents communicate with each other using a standardised agent communication language (ACL). The mulit-agent system presented in this paper uses the Foundation for Intelligent Physical Agents (FIPA) Agent Communication Language [9]. The flexibility of FIPA ACL means that new agents can be introduced to an agent community relatively easily. A detailed description of the methodology used for the design of PEDA can be found in [10]. The following section describes the PEDA architecture, agents within the architecture and a brief description of how each agent performs its analysis of the data.
4. Protection Engineering Diagnostic Agents
4.2. The Nameserver Agent The nameserver agent is the second utility agent used by the PEDA system. It contains the network locations of all the PEDA agents. A PEDA agent can query the nameserver to ascertain the location of other agents with which it wishes to communicate.
4.3. Incident and Event Identification Agent The incident and event identification (IEI) agent is tasked with processing SCADA data to identify ‘incidents’ and ‘events’, terms which protection engineers at SP Power Systems wish to interpret from SCADA data. An incident is a grouping of alarms that relate to a disturbance on a particular circuit. Events are alarms or groups of alarms that make up a part of an incident. The core functionality of the IEI agent is provided by the Telemetry Processor, a rule-based expert system designed to analyze SCADA data for protection engineers. The telemetry processor uses inference engines provided by the Java Expert System Shell (JESS) [8] in conjunction with three separate rulebases. Each rule-base contains JESS rules, derived from knowledge elicited from protection engineers, which are fired by certain patterns of alarms (Fig. 3). These rule-bases are used for incident identification, incident closure and event identification.
The PDA system currently consists of 6 core agents: a Facilitator agent; a Nameserver agent; an ‘Incident and Event Identification (IEI) agent that ‘wraps’ the KBS used for the analysis of SCADA; • a ‘Fault Record Retrieval’ agent; • a ‘Fault Record Interpretation’ agent that ‘wraps’ data preparation module of the MBR tool-set;and • a ‘Protection Validation and Diagnosis’ agent that ‘wraps’ the tools used for the MBR analysis of the DFR data The functionality of each agent is described below. • • •
4.1. The Facilitator Agent
0-7695-2056-1/04 $17.00 (C) 2004 IEEE
3
Proceedings of the 37th Hawaii International Conference on System Sciences - 2004
4.3.1. Incident Identification. A single inference engine scans the alarms for patterns indicating incident inception, i.e. protection relay operation followed by a circuit breaker opening. When a new incident has been identified, an ‘open incident’ is created. Subsequent alarms are then added to the appropriate ‘open incident’ group based on time and topology. 4.3.2 Incidents Closure. Each ‘open incident’ has its own inference engine that uses the incident closure rule-base to identify patterns of alarms indicating incident conclusion. Once an incident has deemed to be closed, for example by the identification of a completed delayed auto-reclose sequence, the open incident is closed and passed on for event identification. 4.3.3. Identification of Events within Incidents. A new inference engine is created for each closed incident. Operating on the grouped incident alarms, the inference engine uses the event identification rule-base to identify important alarms, provide summary information and diagnose any faults indicated by the alarms (Fig. 7). The output of the telemetry processor is made available to engineers as a web page across the company’s intranet. Only minor modifications to the original telemetry processor code were required to allow the IEI agent wrapper to start the telemetry processor and output the identified incidents and events in a suitable format. The IEI agent wrapper was also designed to allow other agents to subscribe for the incident information the telemetry processor produces. The IEI agent can refuse to provide subscription services to a requesting agent by sending a ‘refuse’ message. This is based on permissions, to prevent inappropriate access to incident data. Successfully subscribed agents are informed of new incidents by the IEI agent, which sends messages that contain the new incident information.
Alarm Buffer Management
Incident Population
Incident Closure
Alarms Maintained in Buffer
alarm buffer Alarms Added to Incidents
Open Incidents
Check Closed Incidents
Open Incidents
Rule-base
Identified Incidents
IncidentClosure ClosureJESS JESSEngines Engines Incident Rule-base
Closed Incidents Incident Event Checking
Incident Start JESS Engine
Closed Incidents Event EventsIdentification JESS Engines JESS Engines
Check Closed Incidents for Events Incidents with Events
Rule-base Incident Events
Fig. 3. Telemetry Processor reasoning mechanism.
4.4. Fault Record Retrieval Agent The principal objective of the fault record retrieval (FRR) agent is to poll available DFRs for new records and to prioritise retrieval based on incident information received from the IEI agent. The FRR agent has the ability to perform the following tasks: • monitoring device availability; • creation of a polling schedule; • selection of the next fault to be retrieved ; • retrieval of a fault record; and • rescheduling of the retrieval of a fault record. 4.4.1 Monitoring Device Availability. At present, to monitor device availability, the FRR agent reads a database containing all possible sources and selects those categorised by engineers as available. In the future a more accurate assessment of device availability will be achieved by monitoring the communications to remote DFRs. 4.4.2. Creation of a Polling Schedule. To create a polling schedule, the list of available sources produced by the previous task is used. The order of sources on this list dictates the retrieval order. 4.4.3 Selection of the Next Fault Record to be Retrieved. Only when all new records have been retrieved from a particular DFR source will retrieval move on to the next source. 4.4.4. Retrieval of a Fault Record. When a fault record is to be retrieved, the FRR agent establishes the
0-7695-2056-1/04 $17.00 (C) 2004 IEEE
4
Proceedings of the 37th Hawaii International Conference on System Sciences - 2004
connection and communications with the remote DFR and initiates retrieval of any new records. When the records have been retrieved from the DFR they are archived and the pathname of each retrieved fault record held within the FRR agent. This enables the FRR agent to reply to external requests for fault records by forwarding a reference to the records avoiding the need to pass large DFR records between agents. 4.4.5. Rescheduling the Retrieval of Fault Records.If the FRR agent receives information from either the IEI agent or a request for a record from another agent, it has to reschedule and prioritise the polling of the relevant fault recorders. The execution of these tasks is controlled by a set of rules within the agent wrapper. The agent wrapper also controls communication with other agents and response to requests of other agents.
trims fault records to have the same number of prefault samples. The main component of the tool-set is the diagnostic engine (Fig. 4). The diagnostic engine is responsible for running models, comparing data sets and computing diagnoses. Protection schemes and component models are described in a set of XML (eXtensible Mark-up Language) documents which the diagnostic engine uses to co-ordinate the running of the models and the flow of data between models. Since there is a substantial base of protection models already in existence [12][13][14], the diagnostic engine supports flexible integration of different model types, running on different simulation platforms [15]. Synchronized DFR Data MATLAB DPM
XML docs
4.6. Protection Validation and Diagnosis Agent The protection validation and diagnosis (PVD) agent ‘wraps’ elements of a model-based reasoning tool-set, these include: • a fault record synchronisation module; • a diagnostic engine; and • a protection validation report generator. In order to assess the performance of some protection schemes, e.g. unit protection or intertrip schemes, records from more than one circuit end may be required. As fault recorder often run on their own internal clock, synchronisation of the DFR data may be necessary. Using the fault inception as a common point of reference, the fault record synchronisation module
Model Library
Diagnosis
4.5. Fault Record Interpretation Agent The Fault Record Interpretation (FRI) agent ‘wraps’ the fault record interpretation module of the modelbased reasoning tool-set [8]. As mentioned earlier in this paper, DFR records require processing before they can be analysed using MBR techniques. Similarly to the IEI agent, only minor modifications to the original code were required to allow the agent wrapper to control the fault record interpretation module. The FRI agent’s wrapper also controls the prioritisation of the interpretation of the fault records. When a fault records is interpreted, in addition to the processing required for the MBR tool-set, the fault type, fault inception and clearance times are identified.
Diagnostic Engine
Fig. 4. Model-based reasoning diagnostic engine draws on a library of protection models to validate protection operation.
Once the diagnostic engine has calculated a diagnosis, this diagnosis is passed to a report generator which produced a report in the form of a web-page that can be viewed over the company’s intranet. In a similar manner to the other agents, the agent wrapper contains the appropriated rules and logic form managing the control of the tool-set modules and the communication with other agents.
5. Case Study To illustrate the PEDA approach to disturbance diagnosis an actual power system disturbance will be used as a case study.
5.1. PEDA Initialisation Before PEDA can commence with disturbance diagnosis it must go through an initialisation phase. This involves the following stages: 5.1.1. Registration with the Utility Agents. Each agent must register their location with the Nameserver Agent and the types of resources and abilities they can provide with the facilitator. 5.1.2. Subscription. The FRR, FRI and PVD agent each know that they need incident information in order to perform their individual functions. Each agent sends
0-7695-2056-1/04 $17.00 (C) 2004 IEEE
5
Proceedings of the 37th Hawaii International Conference on System Sciences - 2004
a query to the facilitator to find an agent that can offer incident information. The facilitator replies that the IEI agent can provide them with this information. Before the other agents can subscribe to the IEI agent for information, they have to find its location. They obtain this by querying the nameserver. Each agent then sends a message to the IEI agent requesting subscription for incident information. The IEI agent responds with a message indicating confirmation, failure or refusal of subscription. In a similar manner, the FRI agent has to subscribe to with FRR for information about retrieved fault records. Once the subscription process is complete PEDA can start performing online disturbance diagnosis.
SCADA Alarms and Indications 13:54:14:720 SUBA SUBB 13:54:14:730 SUBA SUBB 13:54:14:730 SUBF 13:54:14:750 SUBF 13:54:14:760 SUBA SUBB 13:54:14:760 SUBA cb1 13:54:14:790 SUBB SUBA 13:54:14:800 SUBC T1 13:54:14:800 SUBD 13:54:14:800 SUBB SUBA 13:54:14:810 SUBD 13:54:14:810 SUBB SUBA 13:54:14:810 SUBE 13:54:14:820 SUBB cb2 13:54:14:830 SUBA SUBB 13:54:14:850 SUBC cb3 13:54:14:860 SUBB SUBA 13:54:14:860 SUBB SUBA 13:54:14:890 SUBB SUBA 13:54:14:900 SUBC T1
13:54:35:470 SUBC T3 Autoswitching Complete 13:54:35:490 SUBC cb3 CLOSED 13:54:37:710 SUBB cb2 CLOSED 13:54:38:210 SUBA SUBB Autoswitching Complete 13:54:38:300 SUBA cb1 CLOSED
5.2. Disturbance Diagnosis Process A disturbance on the circuit between substation A and substation B causes monitoring systems to produces the SCADA and DFR data in Fig 5.
DFR Records 13:54:14.740 DFR1 Triggered on Protection 13:54:14.740 DFR4 Triggered on low volts 13:54:14.740 DFR5 Triggered on low volts 13:54:14.810 DFR2 Triggered on Protection 13:54:14.810 DFR6 Triggered on low volts 13:54:14.850 DFR3 Triggered on CB OPEN
SUB C
DFR 2
DFR 6
cb3 cb2
SUB F
DFR 3
SUB B DFR Schematic
T1
Fig. 6. Case Study Alarm and DFR data
CT I
DFR n Digital Inputs
Unit Protection Optd ON Trip Relays Optd ON Battery Volts Low ON Battery Volts Low OFF Second Intertrip Optd ON OPEN Distance Protection Optd ON Trip Relays Optd ON Pilot Faulty ON Trip Relays Optd ON Pilot Faulty OFF Unit Protection Optd ON Metering Alarms ON OPEN Autoswitching in Progress OPEN Second Intertrip Optd ON First Intertrip Optd ON Autoswitching in Progress Autoswitching in Progress
V
VT
Analogue Inputs
DFR 1 cb1 SUB A DFR 4
SUB D
DFR 5 SUB E
Fig. 5. Case Study – Transient Fault on circuit SUBA / SUBB
On entering PEDA, the IEI agent connects to the real-time SCADA alarms database and starts the telemetry processor interpreting the alarms. Given the alarm stream in Fig. 6., the incident identification rules recognise the ‘Unit Protection Optd’, ‘Trip Relays Optd’ and ‘cb1 OPEN’ alarms on the SUBA SUBB circuit. These indicate the start of an incident. Subsequent alarms received for that circuit are added to the incident grouping of the alarms. Incident closure rules then interpret the incident alarms for incident closure, recognising a complete autoswitching sequence on the circuit. This closes the incident and generates the incident summary indicated at the top of Fig. 7. Event identification rules will then further interpret the incident alarms and generate information on events of interest to the engineers. Incident:
“13:54:14.720 SUB A / SUB B / SUB C Autoswitching Sequence Complete”
Events:
13:54:14.720 “Unit Protection Operated Successfully at SUBA -> SUBB 13:54:14.810 “Unit & Distance Protection Operated Successfully ay SUBB -> SUBA 13:54:14.860 “1st and 2nd Intertrips received at SUBB from SUBA 13: 54:38.300 “Distance Protection at SUBA -> SUBB failed to operate
Fig. 7. Output of the telemetry processor given the data in figure 6.
0-7695-2056-1/04 $17.00 (C) 2004 IEEE
6
Proceedings of the 37th Hawaii International Conference on System Sciences - 2004
Having identified an incident, the IEI agent’s message handling rules will automatically inform all subscribed agents of the new incident. In this case the FRR, FRI and PVD agents will each receive a message indicating the date, time, circuit and a summary of the incident. Having subscribed to the IEI agent, the FRR Reschedule Retrieval task is executed, prioritising retrieval of records from DFRs on the same circuit as the incident, i.e. DFR1, DFR2 and DFR3. The retrieval process may take anywhere from tens of seconds to several minutes depending on the quality of the communications to the remote fault recorders. The FRI agent also receives the incident information and queries the FRR agent to see if it has the fault records related to the incident. Since retrieval is still underway, the FRR agent replies with a message indicating that the fault records are not yet available. As a result the FRI agent sends a message to the FRR agent requesting the retrieval of the required fault records. When the FRR agent has completed retrieval from the requested devices a message is sent to the FRI agent informing it of completed retrieval To obtain the fault records retrieved from DFR1, DFR2 and DFR3, the FRI agent sends a message to the FRR agent requesting the retrieved fault records. The FRR agent then sends a message containing the location of the fault records to the FRI agent, which then schedules interpretation of the records. The PVD agent also received the same incident information message as the FRR and FRI agents. Therefore, it proceeds to obtain the interpreted fault records from the FRI agent. At this point in time the FRI agent will have requested, but not received, the fault records from the FRR agent. The PVD agent will then send a ‘request’ message to the FRI agent requesting interpretation of fault records from DFR1, DFR2 and DFR3. When the FRI agent has received and interpreted the fault records a ‘confirm’ message is sent to the PVD agent in response to each ‘request’ message. To obtain the requested records the PVD agent sends a message to the FRI agent. The FRI agent responds with a message containing the paths to the fault record. Once the PVD agent has obtained all the fault records required, it runs the diagnostic engine and generates a protection validation report. For the example in the case study the protection validation module found that all protection components operated correctly. Given that the telemetry processor diagnosed the failure of distance protection to operate (Fig.7), further investigation may be required, e.g. review of the protection settings.
6. Engineering Assistant Agents Previous sections have described the data interpretation achieved by the PEDA system. However problem of data overload is not exclusive to protection engineers. Engineers in operational and asset management roles often have to use information produced by a number of different systems e.g. asset management databases, fault reporting systems and condition monitoring systems. The authors are researching Engineering Assistant Agents (EAA) as a means of providing engineers with information tailored to meet their requirements given their role in the business. Each engineer would have their own personal engineering assistant agent which they would keep locally on their PC. The agent would act as a personal interface to the company’s information systems.
6.1. User Modelling Each EAA maintains a ‘user model’ of it owner. The purpose of the user model is to capture the engineer’s responsibilities and operational functions. Based on this knowledge, the EAA could proactively and adaptively provide its user with information relevant to particular business role. Rather than simply using set profiles for different types of engineer, the EAA would employ machine learning techniques to track the users interests over time; as a particular business role changes, then the engineer may become less or more interested in certain information. When new agents are added to the agent community, the EAA is responsible for informing its user about the information which is available. Using the user model, the agent will be able to decide whether or not its owner may be interested in that data, If it lacks knowledge on user preference it may communicate with other EAAs whose users have similar roles, to see if their user was interested or not.
6.2. Engineers Assistant Agents within PEDA The authors are currently developing a prototype engineer assistant agent that acts as an interface with PEDA. In addition to protection engineers, asset managers, field engineers and those responsible for administering the PEDA (IT support) are interested in some of information PEDA provides. Field engineers may, for example be interested in the incident information provided by the telemetry processor, whereas this may be of less interest to asset managers. On the other hand, asset managers may be interested on statistics collated on correct/faulty protection
0-7695-2056-1/04 $17.00 (C) 2004 IEEE
7
Proceedings of the 37th Hawaii International Conference on System Sciences - 2004
operation. IT support engineers may wish to be informed of any fault record retrieval problems. When the EAA enters the PEDA community it can use the facilitator agent to discover what information the PEDA agents can provide. The user is presented with a list of this information and picks the ones he/she is interested in. The EAA then subscribes with the PEDA agents for the appropriate information. When the other agents generate relevant information, it is automatically sent to the EAA (Fig. 8). In the future the EAA may also be used to retrieve data from fault reporting systems and asset management databases. Engineering Assistant
Engineering Assistant
[8]
[9]
[10]
[11]
[12] Protection Validation
Fault Record Interpretation
Incident/Event Identification
Fault Record Retrieval
[13] Fig. 8. Engineering assistant agents introduced to the PEDA system
7. References
[14]
[1] Z.A. Vale, and M.F. Ferandes, “Better KBS for real-time applications in power system control centers: the experience of the SPARSE project”, Computers in Industry, vol. 37, pp. 97 –111, 1998. [2] J. Jung, C-C. Liu, M. Hong, M. Gallanti, G. Tornielli, “Multiple Hypotheses and Their Credibility in On-Line Fault Diagnosis”, IEEE Transactions on Power Delivery, v16, n2, April 2002, pp 225 – 230. [3] J.H. Hossack, G.M. Burt, J.R. McDonald, T. Cumming, and J. Stoke, “Progressive Power System Data Interpretation and Information Dissemination”, in Proc. 2001 IEEE Transmission and Distribution Conference and Exposition. [4] M. Kezunovic, I. Rikalo, B. Vesovic, S.L. Goiffon, “The Next Generation System for Automated DFR File Classification”, Fault & Disturbance Analysis Conference, May 1998. [5] S.C. Bell, S.D.J. McArthur, J.R. McDonald, G.M. Burt, et. al., “Model Based Analysis of Protection System Performance”, IEE Proc. Gen. Trans. & Dist., vol. 145, n 3, pp 547-552, 1998. [6] M. Wooldridge, et al, “Intelligent Agents: Theory and Practice”, The Knowledge Engineering Review, vol. 10, n 2, pp. 115-152, 1995 [7] .J.A. Hossack, J. Menal, S.D.J. McArthur, J.R. McDonald, “A Multi-Agent Architecture for
[15]
Protection Engineering Diagnostic Assistance”, IEEE Transactions on Power Systems, Vol. 18, no. 2, May 2003. E. Davidson, S.D.J. McArthur, J.R. McDonald, “A Tool-Set for Applying Model Based Reasoning Techniques to Diagnostics of Power Systems Protection”, IEEE Transactions on Power Systems, Vol. 18, no. 2, May 2003. “FIPA Communicative Act Library Specification”, XC00037H, Available: http://www.fipa.org/repository/index.html S.D.J McArthur, J.R. McDonald, J.A. Hossack “A multi-agent approach to power system disturbance diagnosis” Book Chapter in Autonomous systems and intelligent agents in power system control and operation (ed. Christian Rehantz) Springer Verlag 2003 E.J. Friedman-Hill, “Jess, The Java Expert System Shell”, http://heerzberg.ca.sandia.gov/jess, version 6.1a5, 15th January 2003. A. Dysko, J.R. McDonald, G.M. Burt, J. Goody, B. Gwyn, “Integrated Modeling Environment A Platform For Dynamic Protection Modelling And Advanced Functionality”, IEEE Power Engineering Society Transmission and Distribution Conference, April 1999 M. Kezunovic, S. Vasilic, "Advanced Software Environment for Evaluating the Protection Performance Using Modeling and Simulation," CIGRE SC 34 Colloquium Sibiu, Romania, September 2001. P.G. McLaren, C. Henville, V. Skendzic, A. Girgis, M. Sachdev, G. Benmouyal, K. Mustaphi, M. Kezunovic, Lj. Kojovic, M. Meisinger, C. Simon, T. Sidhu, R. Marttila, D. Tziouvaras, "Software Models for Relays" IEEE Transactions on Power Delivery Vol. 16, No. 2, pp. 238-246, April 2001 S.D.J McArthur, E.M. Davidson, G.W. Dudgeon, J.R. McDonald “Towards a model integration methodology for advanced applications in power engineering” IEEE PES letter August 2003
0-7695-2056-1/04 $17.00 (C) 2004 IEEE
8