marketing of the product. These opinions are biased in nature and can be disastrous if other influencing factors such as pressure and deadlines are present.
IS&T's 2002 PICS Conference
Automating the Rank Order Test for Printing
Quality Evaluation
Chengwu Cui, Laurence G. Hassebrook*, Chun Guan* and Shaun Love
Lexmark International, Inc., Lexington, Kentucky
*University of Kentucky, Lexington, Kentucky
Abstract
statistical modeling. As a result, a well-organized printing quality test can be remarkably costly and time-consuming. While the participation of human observers is inevitable for a subjective test, the rest of the process can be automated to reduce cost and improve test efficiency. Printing quality evaluation often involves the visual comparison of prints from several competitive printers, which makes the rank order the method of choice. Although from a strict psychometric point of view, the method of paired comparison is a more robust method, there are 1,2 reports to support that a well-conducted rank order test is equivalent to a much more time-consuming paired comparison test. Consequently, modeling theories developed for paired comparison can be used to derive scaled data to describe printing quality effectively. In this report, we present some of our successful efforts in rank order subjective printing quality test automation.
Before the Holy Grail of replacing human observers with scanning systems and cognitive models for printing quality evaluations is found, subjective measurements will have to be used. Among various subjective test methods, the ranking test is a straightforward, convenient, and theoretically sound test for printing quality evaluation. However, the ranking procedure involves a process that demands much human interfacing from the test administrator, including recording the test on Talley sheet, reading instructions, and entering and processing the data. These human interfacing can be time consuming and prone to errors. Here we report some successful efforts on automating the ranking test with computer software and automatic input devices such as barcode readers and cameras. We prove that by using these tools, we can automate the ranking process and significantly improve the efficiency, cost and reliability of the ranking test.
The Rank Order Test
Introduction
The first stage of a printing quality rank order test involves test sample preparations, test planning, and some form of pilot testing to identify the adequacy of the intended rank order test. The second stage involves conducting the test and collecting observer responses. The final stage of the test is data analysis and test result reporting. Traditionally, samples are labeled and results recorded in specially designed forms. These forms are then entered into a spreadsheet to process the data and output the results for reporting. In addition to the interest in printing quality competitiveness analysis, design engineers often desire to know the reason of the ranking by the observers so that improvement can be made. The traditional method normally resorts to recording of observer’s comments. Ranking of potential quality attributes by the observers based on their importance when the ranking decisions of the samples were made would be ideal. This is often found to be unrealistic due to the time constraint when there are a large number of test images. With improved efficiency by automation, such attribute ranking is possible. An array of attributes can be arranged in a form such that they can be easily identified by both the observer and the automated input system. For example, the printing quality attributes can be described and labeled on a set of cards, which can be conveniently ranked at the same time the print samples are ranked. The most
Despite the active research activities on vision model based imaging systems for printing quality assessment, subjective printing quality evaluation seems likely, at least for a long time to come, to remain the primary method of printing quality assurance. When printing technology has advanced to the stages that many printing artifacts have been controlled to the visual perception thresholds, both physical measurement and visual modeling can become difficult. Perception preference further complicates vision modeling, which is particularly relevant in color printing. Primitive subjective printing quality assurance relies on individual or collective opinions of a small group, mostly of whom are associated with the design, production, or marketing of the product. These opinions are biased in nature and can be disastrous if other influencing factors such as pressure and deadlines are present. The scientific development of subjective evaluation is called psychometrics. Over a century of effort in various relevant fields provides a variety of psychometric techniques to scientifically derive measurement data that can lead to statistics informative of the perceived printing quality. These techniques stress the need for controlled testing conditions, adequate sampling, and proper perceptual and
99
IS&T's 2002 PICS Conference
through dedicated serial communication port. Proper programming may be required for multiple user threading, error trapping and correction, etc. The following four dimensions of the test data need to be tagged with barcodes: observer index; test image index; printer index; attributes index. The observer index is used to link to the observer’s data record when the observer has finished a ranking task and is ready to scan in the rank order. The test image index is used to identify the image for the test. A specific image tag page needs to be prepared with corresponding barcodes. Before scanning in a rank order, the observer scans the corresponding image barcode to inform the host computer of the specific image. The printer and attribute indices are solely for the input device to identify the printers and the attributes to record the ranking results. Each print sample is tagged with a specific barcode to indicate with which printer it was printed. Similarly, attribute cards are also uniquely tagged with barcodes for identification. One other advantage of using barcodes is that they are unreadable to human observers, so no effort is needed to deliberately scramble the print sample identification labels to avoid test bias.
appealing benefit of an automated system for ranking the attributes is perhaps that the information will be stored in the same database and therefore can be viewed simultaneously with the sample ranking.
Test Automation Multimedia personal computers and various potential input devices provide the hardware tools to automate the rank order test. Readily available development tools make it possible to write software to facilitate and automate the step-by-step process of a rank order test. A database can be designed to store observer profile, printer, and sample information, and rank data as shown in Figure 1. With such a database design, later reporting of the test results can be made interactive.
O b server i: T est inform ation: D a te, tim e u sed P rofile: sex; ag e; exp erience C om m ent: Im a g e Im a g e Im a g e . . . Im a g e
ID S a m p le ra nk o rd er 1 : s 1 1 s 12 … … … .s 1 p 2 : s 2 1 s 22 … … … .s 2 p
A ttrib utes ran k order a 11 a 1 2 … … … … a 1 q a 21 a 2 2 … … … … a 2 q
t: s t1 s t2 … … … .s tp
a t1 a t2 … … … … a tq
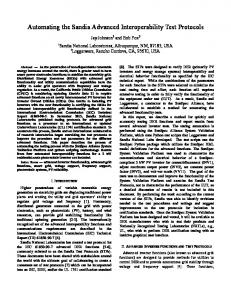
Using Video Camera as the Input Device Another automation approach to input the rank orders of samples and attributes is to use a camera interface. The scheme discussed below allows rapid test setup, automated test-observer interaction and rank order recording. The algorithm involves the use of a tree structure of operators we refer to as partitions. The partitions in the camera scene shown in Fig. 3(a) are interpreted as a “family tree” structure in Fig. 3(b). The whole camera scene is the base cell, which is the parent of all its child partitions. There are two kinds of children from the base cell. One is the static partition, where the quality attribute cards are located. The purpose of the static partitions is to act as virtual "buttons." They function by detecting temporal intensity variations when the observer touches these regions with their hand. The static partitions for the quality attribute cards are labeled as S1 to S10 in Fig. 3. Another kind of child is the "search" partition, which is labeled as T1 in Fig.3. The search partition defines the spatial region that contains the test samples. T1 and S1 through S10 are the same generation from their parent and are referred as sibling cells. A third type of cell is the "tracker" partition. Four trackers, t1 to t4, are placed within the search partition and therefore are the children of T1. In general, parent cells pass information to their children, which includes spatial size and position coordinates. The children use these spatial parameters as part of their function. Each of the trackers is characterized by the 2-dimensional barcode marked on individual print sample and then tracks the sample within the region of its parent search partition T1. The host computer monitors the locations of each test sample and begins an audio dialog with the observer when the test sample order changes.
Figure 1. An example of the data structure to store rank order test record of an individual observer i.
Test instructions can be recorded in voice and replayed on a step-by-step basis. Data processing including modeling and elaborate statistical test can be incorporated. If the database is adequately designed, it allows analysis of the data in a fashion that is not possible with traditional spreadsheet methods. The database can be deployed over local networks or even the Internet for remote testing or presentation of test results. Using the Barcode Scanner as the Input Device Barcode scanners are adequate input device for test automation. They are readily available, robust, and easy to use. If the cordless versions are used, one scanner can be shared by many observers at one location. The incorporation of the barcode scanner to a host computer is straightforward. Most barcode scanners can be used either as a wedge device connected via the keyboard connection or
100
IS&T's 2002 PICS Conference
T e s t p rep aratio n : 1 . P rin t sa m p le s (t es t im a g e s , p rin te rs ) 2 . V i ew in g en v i ro n m en t 3 . In s t ru c tio n s (c ri te ria ) 4 . In te res t e d p o p u la tio n
R a n d o m ly s a m p le n o b s e r v e r f ro m popula tio n, g e t c o m m itm e n t fo r te st
E ach o b s erv e r
Figure 3 a). Partition settings of camera scene. E ach te s t im ag e
base cell
R an k a ll sa m p le s; R a n k th e im p o rt an c e o f attrib u t es
T1
S can in th e b a rc o d es i n ra n k o r d e r fo r S a m p le s a n d a ttrib u te s
t1
S1
t2
t3
S2
S3
…..
S10
t4
D o n e all im ag e s ? No
Figure 3 b). “Family Tree” structure layout of camera scene
Y es C o m p u te s c ale d v a lu e s fo r p rin te rs C o m pute tes t signific an c e
Figure 4 shows an example of how the automated ranking test via camera is implemented. In Figure 4, the test sample index is labeled as "n" near the detected location. Notice that the observer reordered the test samples and touched the quality attribute card to give the reason for this ranking. Furthermore, the automated ranking test can record each step the observer changes in the ranking as well as the reasons of preference. The system uses audio sound sequences to prompt and interact with the observer. For example, if the observer switches the order from n = {0, 1, 2, 3} to n = {0, 2, 3, 1}, as shown in Figure 4, then a sound prompt would respond with "Please touch the cards that best matches your reason for reordering the images" The observer then touches the card representing the reason and the computer verifies the selection with an audio prompt which asks the observer to touch an "enter" card or an "undo" card as a response. A test administrator uses a simple GUI interface to enter the number of cards and trackers. The spatial partitions are then positioned and sized by using a mouse. A single calibration of button and tracker parameters is done once and is not repeated for additional experimental layouts.
S cale d v a lu e s ig n ific a n c e te s t T h e B ootstra p
Y es S ignific a n t? Y es
No
M o re? No
E n d te s t R ep ort test resu lts
Figure 2. Flowchart of an automated rank order test using barcode scanners
101
IS&T's 2002 PICS Conference
Automated Test of Significance With data recorded on the fly, it is possible and convenient to perform significance test while the test is in the progress. With such information, the test can be terminated if it answers the questions of concern prior to the planned number of observers. Alternatively, if the results obtained with the planned number of observer cannot answer the questions, the test can either be extended or modified promptly. For paired comparison based scaling analysis, there are 3,4 methods to directly estimate the potential scale errors and significance of scale difference can therefore be known by plotting the scaled values with confidence intervals. The bootstrap test can be even more useful for an automated test. The bootstrap is a relatively new statistical method that randomly resamples the sample with replacement for a large number of times to reveal the statistical properties of the 5 sample. Here we use an example to illustrate the power of the bootstrap test and its use to test the data during the automated rank order test.
Figure 4. Implementation of the automated ranking test via camera. P rinter 1 S caled value distributions when rea ching 10 ob servers
Scaled value distributions when reaching 30 observers
Printer 1
P rinter 2
Printer 2 Printer 3
P rinter 3 1400
P rinter 4
Printer 4
P rinter 5
Printer 5 1200
P rinter 6
1400
P rinter 8
1200 F requency out of 5000 trials
Frequency out of 5000 trials
P rinter 7
1000 800 600
Printer 6 Printer 7 Printer 8
1000
800
600
400
400 200
200 0 0
0 0
0.5
1
1.5
2
2.5
0.5
1
1.5
2
2.5
3
Scaled value (relative)
3
c)
S caled value (re lative)
a) S c a le d va lue d is trib utio ns w he n re a c hing 5 0 o b s e rve rs S caled va lue distrib utions when reaching 20 ob serve rs
P rinte r 1
P rinter 1
P rinte r 2
P rinter 2 P rinter 3
14 00
P rinter 4 P rinter 5 P rinter 6 P rinter 7 P rinter 8
10 00
P rinte r 4 P rinte r 5 P rinte r 6
1200 F re q ue nc y o ut o f 5 0 0 0 tri a
F re q ue ncy o ut o f 5 0 0 0 triasl
12 00
P rinte r 3
1400
80 0
60 0
40 0
20 0
P rinte r 7 P rinte r 8
1000
800
600
400
200
0 0
0.5
1
1.5 2 S caled va lue (relative)
2.5
0
3
0
0 .5
1
1 .5
2
2 .5
3
S c a le d va lue (re la tive )
b)
d)
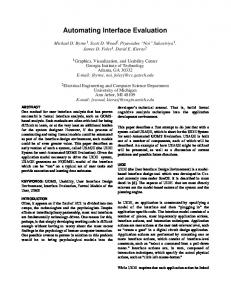
Figure 5. Scaled values distributions of the eight printers for a specific test image with the first a) 10, b) 20, c) 30, d) 50 observers, respectively. The distributions are generated by resampling the observers with replacement for 5000 times.
102
IS&T's 2002 PICS Conference
Acknowledgement
In one test, we tested the printing quality competitiveness of eight competitive printers. Here the result of one image is used to demonstrate the bootstrap test of significance on the fly. Figure 5 a)-d) show the bootstrap test results of the estimated scaled values variances when the total number of observers reached 10, 20, 30, and 50, respectively. As can be expected, the variances of the scaled values reduce as the number of the observer increase. Interestingly, the means of the scaled values did not change as much as the number of observers increases except the changes from 10 to 20 observers in this particular case. During the test for this image, increasing the number of observers beyond 50 will not likely reveal more information. Noticeable is that the scaled values of the eight printers span a wide range indicating the difference in the print samples are relatively obviously. In fact, the image is a test case of skin tone and it was obvious that some printers printed skin tones in clearly unfavorable ways. In other cases, the appearance differences among the competing print samples may not be apparent and may also involve multiple image attributes, then the transition from 10 observers to 20 observers may not only include decreasing variances, the means of the scaled values may also fluctuate and even exchange orders. Such mean scaled values order fluctuation when the number of observers increase during the test would indicate more observers are needed to be confident that the results do represent the intended population.
We would like to thank Mr. Ross McFarland, Mr. Tyler Barnett at Lexmark International, inc. for helpful discussion on using the barcode scanner. We would also like to thank Daniel Lau of the University of Kentucky for discussions on the camera interface automation.
References 1. C. Cui, Comparison of the method of paired comparison and the method of rank order, Proceedings of Color Imaging Conference, IS&T, Nov. 2000, Scottsdale. P.200-203. 2. Kate Hevner, An empirical study of three psychophysical methods, J. Gen. Psychol., 4, 191-212. (1930). 3. C. Cui, On the repeatability of paired comparison based scaling method, Proceedings of PICS2001, April 2001. Montreal, IS&T. P. 113-117. 4. John C. Hanley, Comparative analysis of Bradley-Terry and Thurstone-Mosteller paired comparison models for image quality assessment, Proceedings of PICS2001, April 2001. Montreal, IS&T. P. 108-112. 5. Bradley Efron and Robert J. Tibshirani, ‘An Introduction to the Bootstrap’, Chapman & Hall/CRC, New York, 1993.
Biography Chengwu Cui received his BS degree in optics from Shandong University, MS in color science from Chinese Academy of Science and PhD in vision science from the University of Waterloo. From 1995 to 1999, he worked for GretagMacbeth as a color scientist. He currently works for Lexmark International, Inc. His research interests include human vision, ocular optics, color science, lighting, computer color formulation, image quality, psychophysics, and digital color imaging.
Summary We have shown that the rank order test for printing quality can be automated to a great degree by using modern programming tools, input hardware, and statistical methods available. Such automation also makes it possible to answer questions in regard to the competitiveness of a printer that was difficult to answer with the traditional approach.
103