teleoperated gathering to an automated on-board analysis with improvements in ... which search campaigns are presently carried out with lim- ited effectiveness ...
AUTONOMOUS DETECTION OF DUST DEVILS AND CLOUDS ON MARS Andres Castano, Alex Fukunaga, Jeffrey Biesiadecki, Lynn Neakrase ∗ , Patrick Whelley∗ , Ronald Greeley∗ , Mark Lemmon+ , Rebecca Castano and Steve Chien Jet Propulsion Laboratory, 4800 Oak Grove Dr., Pasadena, CA 91109 Dept. of Geological Sciences, Arizona State University, P.O. Box 871404, Tempe, AZ 85287 + Dept. of Atmospheric Sciences, Texas A&M University, 3150 TAMU, College Station, TX 77843 ∗
ABSTRACT
2. CURRENT AND FUTURE SCENARIOS
Acquisition of science in space applications is shifting from teleoperated gathering to an automated on-board analysis with improvements in the use of on-board memory, CPU, bandwidth and data quality. In this paper, we describe algorithms to autonomously detect dust devils and clouds from a rover and summarize the results. These algorithms meet high hitto-miss ratios and satisfy strict requirements of CPU, memory usage and bandwidth. The detectors have been scheduled for upload to the Mars Exploration Rovers (MER) in 2006. These are the first autonomous science processes in the rovers.
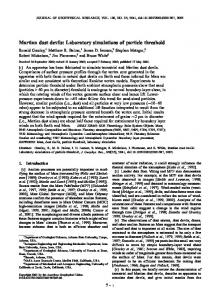
Martian dust devils and clouds are geological events that provide direct and indirect information about the Mars atmosphere [1]. Currently, both events are acquired using the estimates of when the events might occur. In the case of clouds, sequences of images of the Martian sky are taken at specific times and transmitted to Earth with the expectation that some of them might have captured the event. Presently, with a current success rate of imaging clouds between 10% and 25% of the time (estimates from MER scientists), the cloud campaigns are expensive in terms of bandwidth and rover resources. It is possible to download the thumbnails first (i.e., 8-bit 64x64 reductions of the image) to decide whether it is worthwhile to download the high resolution image but they are not useful unless the image has an evident cloud (i.e., wispy and soft clouds can be missed). In Fig. 1(a) we can see the thumbnail of an image that contains an evident cloud. In the case of dust devils, a sequence of around 20 frames is acquired. The first, middle and last images of the set are sent to Earth and, based on those, a decision for the download or deletion of the full set is made. Thus, dust devils present in the sequence that fail to appear in one of the downloaded frames are lost. Likewise, the full sequence is downloaded despite the fact that the dust devil might have appeared in only a few of the frames. Again, it is not possible to resolve medium, small or faint dust devils using thumbnails. The dust devil detector (DDD) and the cloud detector (CD) improve the quality of the science acquisition of the events under very general conditions. Both detectors use gray-scale imagery (vs. color or multi-spectral) so they can use images from the panoramic, navigation or hazard cameras of the rovers. In the case of clouds, the CD estimates whether an image contains clouds. If it does not (or if instructed to do so), the image is deleted; otherwise, the CD creates a binary thumbnail that shows the skyline and the detections. These binary thumbnails, in contrast to the standard thumbnails available without the detectors, highlight the events in an eighth of the size of a standard thumbnail (binary thumbnails are 1-bit 64x64 images), as shown in Fig. 1(b). The scientists can either download the binary thumbnail to have additional
1. INTRODUCTION The use of on-board automated image processing in space applications is changing the way the rover and lander missions are operated. In this paper we describe the automation of the detection of dust devils and clouds, two science events for which search campaigns are presently carried out with limited effectiveness, in terms of success in capturing the events and use of the bandwidth and rover resources. The detectors use well-known image processing techniques. Still, the project is interesting because first, it describes an application of simple techniques to highly constrained tasks in terms of CPU and execution time, and second, in spite of the simplicity, lack of case-by-case tuning, and uncertainties of each scene, it achieves accuracies that allow geologists to delegate some decisions to the rover. Mars data is so valuable that the attitude of scientists has been to download it all and then decide which data contains valuable science. With the dust devil and cloud detectors, it is possible for the first time to reduce that amount of data downloaded (the rover can discard the images that do not contain science events) and increase its science value (the ratio of science events imaged per bit downloaded). In addition, autonomous detection not only replaces the current campaigns scheduled when the event is likely to occur but enables searches when the event is not likely or not known to occur (i.e., discovery) which could not be done before because of operation costs. The detectors were designed for MER but they can be used by any rover or lander.
4. THE DUST DEVIL DETECTOR
(a) Standard thumbnail - 4Kb (b) Binary thumbnail - 0.5Kb Fig. 1. Standard and binary thumbnails of an evident cloud information about the image or directly download the highresolution image, which has already been deemed by the CD to have a high probability of containing a cloud. For the dust devil case, we developed two detection modes based on change detection. In the first mode, called one-shot, we detect dust devils in a sequence of 4 to 8 images, all stored in memory at the same time. If a dust devil is present, a set of binary thumbnails that summarizes their detections in the images is prepared. The scientists can download the binary thumbnails to have additional information about the sequence or directly download the sequence, which has already been deemed by the DDD to have a high probability of containing a dust devil in at least one frame. In the second mode, called continuous-feed, we process large sequences by having in memory one image at a time, i.e., change detection is carried out by updating history records. In this case, individual frames are tagged as containing a dust devil or not. 3. IMAGE CONDITIONING The DDD and CD share an image conditioning step that reduces the amount of data that needs to be analyzed and the image noise. The images, which have a 1024 × 1024 resolution and are 16-bit deep, go through a process of border cropping and minimization. A standard border cropping of about 5 pixels per side prevents border effects introduced by the frame grabber from affecting the image statistics. Border cropping is also used to restrict the detection to a portion of the image, e.g., as shown in Fig. 2, only the top 256 rows of the image are commonly used during dust devil campaigns. The minified images are formed using the median filtered values of the cropped image over a k × k window, with 3 ≤ k ≤ 7; image depth is reduced to 8-bit. This minification reduces the execution time and increases the S/N ratio. In all cases, the standard deviation of noise of the minified images is estimated as a difference of Laplacians [2]. Since the sequences used by the detectors are acquired within a few minutes, we assume that there are no illumination changes in the scene and fix the exposure to that suitable for the first image of the sequence.
All dust devil and clouds campaigns are carried out while the rover and camera are not moving. In this case, the two common methods for detecting dust devils are the comparison of two or more spectral bands of the scene and the detection of change in a sequence. In practice, the time lapse between acquisition of different bands (a minimum of 20s) reduces the spectral method to change detection in a sequence whose images differ not only in time but also in spectral bands. Thus we decided to use change detection that can be applied to panoramic, navigation and hazard camera sequences. The spectral method could have only been used with imagery from the panoramic cameras, the only ones equipped with a filter wheel. In theory, detecting change in the scene is not equal to detecting dust devils as clouds also move. In practice, if image noise can be accounted for, the vast majority of changes in a static Martian scene are caused by dust devils. To a great extent, the problem of detecting change between two images is reduced to taking the difference between the images and thresholding the result [3]. If we know a priori that the moving objects have a distinctive albedo (e.g., a bright dust devil moving over a dark martian scene) then the difference of the images produces a difference in intensity that can be thresholded with confidence. Indeed, large evident dust devils can be extracted using this method. The problem lies when the intensity of the change is comparable in magnitude to the noise of the image. This is the case whenever the dust devil is faint (most common dust devils are faint) and can only be observed by a person when the sequence is played out (usually equalization or other remapping is also required). In this case, the threshold cannot be selected easily as it will invariably consider image noise as change (false positive), actual change as noise (false negative) or both. As noise is a function of parameters over which we have no control (time of day, direction of camera with respect to sun, etc.), a fixed threshold is bound to perform correctly only under a narrow set of conditions. The detection of faint dust devils takes into account the noise of the image and uses the fact that a dust devil is bounded within a small portion of the image. In the one-shot mode, motion in a frame is detected using a method equivalent to subtracting the frame from the average of the set and thresholding the result; this slower than pairwise frame differencing (the simplest possible approach) but more robust. To complement this approach we bias the threshold using the local noise; we do not compensate for the noise but instead, take the magnitude of the noise as a measure of lack of confidence. Finally, we use blob filters to make sure that there are more than a given number of detections within a local region. For the continuous-feed mode, the difference of frame and average is replaced by a running average. The detections in a frame where the one-shot mode was used is shown in Fig. 2. Two dust devils are evident while three either are faint or
Fig. 2. Dust devil detections. Areas under 3rd and 5th rectangles show the corresponding histogram equalized versions. are ghosts, i.e., faint changes due to strong dust devil signals present in another image of the sequence. 5. THE CLOUD DETECTOR The detection of clouds has difficulties similar to those of the dust devils, i.e., clouds that can be easily observed in the sky can be detected easily while those that are extremely faint cannot, as their values approach the noise levels of the image. The set of images from MER available for the design of the CD consisted of single images or sequences of up to 3 images each. This precludes a change detection approach to cloud detection, which regardless would have had only partial success as the motion of the clouds is a function of the wind, i.e., even evident clouds might not exhibit detectable motion under low wind conditions. Thus, the CD uses single gray-scale images. The approach to detect clouds is to assume that any large changes in the intensity of the sky must correspond to the presence of clouds; this assumption holds true with the exception of large changes of local intensity due to noise (e.g., at dusk and dawn) and large changes of global intensity due to camera effects (e.g., vignetting-like effects that darken the corner of the images). Unavoidable image effects like artifacts caused by lens inter-reflections or saturations caused by images taken while aiming at or close to the sun can lead to errors in the detection. The first step to analyze the sky is to separate it from the ground. We used a sky detector composed of three steps. First, we place sky seeds in a window that slides along the top of the image whenever the homogeneity of the window is high. The size of the window, a function of the image reduction k, is 5% of with image height by 10% of the image width. Then we grow the seeds into areas of low variance to form a region S (not necessarily connected). The high variance of the skyline (the pixels at the interface between sky and ground) prevents the growth of S into the ground area. Finally, we set every pixel above every pixel of S as part of S extending S to reach the top of the image; this adds to S the sky regions with high noise and clouds that the growing
algorithm might have missed. During this process we determine the skyline and the horizon (the image row below which there are no sky pixels). We then create a buffer zone about the skyline to eliminate undesired intensity gradients, e.g., in Fig. 1, the skyline in the binary thumbnail is slightly higher than that of the standard thumbnail denoting a buffer zone of a few pixels. Once the sky has been segmented, we search for variations in the sky using an edge detector; strong edges indicate large gradients in the sky that are caused by the presence of clouds. Again, the threshold that determines the value of the edge that corresponds to a cloud is weighted by the noise of the image. Two examples of images with evident clouds and the corresponding detected clouds are shown in Fig. 3 6. RESULTS The operations constraints are determined by the rover resources and the time allocated to the task. Presently, the resources consumed by a search campaign are image acquisition time (e.g., about 20 s per image), the memory used by the images while the scientists decide on the science value of the set, and the bandwidth used by the down-link. Tests on the Surface System Testbed (SSTB - a rover functionally identical to the MERs, with a 30 MHz CPU) show that the running time of the cloud detector is under 20 s and that of the dust devil detector is approximately 15 s per image in one-shot mode (times exclude image acquisition); in continuous-feed mode, after an overhead needed to set the trailing average, the analysis of each new image takes 10 s. For both the clouds and the dust devils, the full size images will be stored on-board with the important difference, with respect to the present campaigns, that it is possible to gray-out the portions of the image that do not contain science data, i.e., the area outside the rectangles for the dust devil case and area below the horizon line for the cloud case. Since the images are stored on-board after compression, there is a gain in both storage size and used bandwidth while preserving the original size and resolution of the image, allowing it to be treated as any standard mission image. The DDD allows downloading of the full first and/or
N
tuples
+
-
4
279
120
159
6
228
121
107
8
180
116
64
correct 237 (84.9%) 190 (83.3%) 155 (86.1%)
false -
false +
10
32
14
24
10
15
Table 1. Dust devil detection results (385 images). (a) Minified image
(b) Detected clouds
type evident cloud wispy cloud uncertain no cloud
N 29 13 5 163
correct (%) 29 (100%) 13 (100%) 3 (60%) 152 (93.2%)
false 0 0 3 0
false + 0 0 0 11
Table 2. Cloud detection results (210 images total).
(c) Minified image
(d) Detected clouds
Fig. 3. Examples of cloud detection on images with evident clouds. (a) and (c) are original images and (b) and (d) are the corresponding results of the detection algorithm
ages with sky but without clouds. The images with clouds were further divided into 29 images that contained evident clouds, 13 images that contained soft hard-to-see wispy clouds and 5 images for which the scientists could not decide if there was a cloud or not. The results are presented in Table 2. Presently, the algorithms have been integrated to the flight code of the MERs and are scheduled for upload in 2006. 7. ACKNOWLEDGMENTS
last image of the sequence, over which the rectangular areas of the results of the detection can be pasted after download. The science constraints were set by the scientists that are currently carrying out the dust devil and cloud search campaigns. Their specifications were a hit ratio above 80%, a maximum false positive ratio of 20% (low, to avoid downloading images that do not have science events) and a maximum false negative ratio of 10% (very low, to avoid missing images that have science events). These ratios had to be met for a test set of their selection, which contained Mars images acquired during the campaigns, under a variety of conditions in terms of noise, relative direction of the sun, time of day, resolution and level of compression. For the dust devil detection case, the algorithm was tested on 385 images divided into 25 image sequences, all acquired from the left navigation camera of the Spirit rover. Each sequence had a length that varied between 6 and 20 images. The set of sequences was biased toward faint dust devils, i.e., barely perceptible at the naked eye, even if played as a video sequence (many of the dust devils could not be seen without further processing of the sets). Given these sequences, we analyzed all the possible subsets of a given number of contiguous images for 4, 6, and 8 images. The results are presented in Table 1. For the cloud detection case, the algorithm was tested on 210 images, divided into 47 images with clouds and 163 im-
The research in this paper was carried out at the Jet Propulsion Laboratory, California Institute of Technology, under a contract with the National Aeronautics and Space Administration. This work was supported by NASA as follows: algorithm prototyping and testing by the Software Intelligent Systems and Modeling (SISM) program under the OASIS task, flight code integration by the Mars Technology program (MTP) under the MER On-board Science task and, MER testing and operation by the New Millennium Program (NMP) under the MER Infusion Studies task. 8. REFERENCES [1] R. Greeley et al., “Gusev crater: Wind-related features and processes observed by the Mars Exploration Rover Spirit,” J. Geophys. Res, vol. 111(E02S09), doi:10.129/2005JE002491, 2006. [2] J. Immerkær, “Fast noise variance estimation,” Computer Vision and Image Understanding, vol. 64, no. 2, pp. 300– 302, sep 1996. [3] Richard Radke, Srinivas Andra, Omar Al-Kofahi, and Badrinath Roysam, “Image change detection algorithms: A systematic survey,” IEEE Trans. Image Processing, vol. 14, no. 3, pp. 294–307, march 2005.