This article was downloaded by: [144.76.82.197] On: 26 August 2015, At: 21:14 Publisher: Taylor & Francis Informa Ltd Registered in England and Wales Registered Number: 1072954 Registered office: 5 Howick Place, London, SW1P 1WG
Autophagy Publication details, including instructions for authors and subscription information: http://www.tandfonline.com/loi/kaup20
Label-free detection and dynamic monitoring of druginduced intracellular vesicle formation enabled using a 2-dimensional matched filter a
a
b
b
a
Obaid Aftab , Mårten Fryknäs , Xiaonan Zhang , Angelo De Milito , Ulf Hammerling , Stig b
a
Linder , Rolf Larsson & Mats G Gustafsson
a
a
Uppsala University; Department of Medical Sciences; Cancer Pharmacology and Computational Medicine; University Hospital; Uppsala, Sweden b
Department of Oncology-Pathology; Cancer Center Karolinska; Karolinska Institute; Stockholm, Sweden Published online: 01 Jan 2013.
Click for updates To cite this article: Obaid Aftab, Mårten Fryknäs, Xiaonan Zhang, Angelo De Milito, Ulf Hammerling, Stig Linder, Rolf Larsson & Mats G Gustafsson (2014) Label-free detection and dynamic monitoring of drug-induced intracellular vesicle formation enabled using a 2-dimensional matched filter, Autophagy, 10:1, 57-69, DOI: 10.4161/auto.26678 To link to this article: http://dx.doi.org/10.4161/auto.26678
PLEASE SCROLL DOWN FOR ARTICLE Taylor & Francis makes every effort to ensure the accuracy of all the information (the “Content”) contained in the publications on our platform. However, Taylor & Francis, our agents, and our licensors make no representations or warranties whatsoever as to the accuracy, completeness, or suitability for any purpose of the Content. Any opinions and views expressed in this publication are the opinions and views of the authors, and are not the views of or endorsed by Taylor & Francis. The accuracy of the Content should not be relied upon and should be independently verified with primary sources of information. Taylor and Francis shall not be liable for any losses, actions, claims, proceedings, demands, costs, expenses, damages, and other liabilities whatsoever or howsoever caused arising directly or indirectly in connection with, in relation to or arising out of the use of the Content. This article may be used for research, teaching, and private study purposes. Any substantial or systematic reproduction, redistribution, reselling, loan, sub-licensing, systematic supply, or distribution in any form to anyone is expressly forbidden. Terms & Conditions of access and use can be found at http:// www.tandfonline.com/page/terms-and-conditions
Basic Research Paper
Basic Research Paper
Autophagy 10:1, 57–69; January 2014; © 2014 Landes Bioscience
Label-free detection and dynamic monitoring of drug-induced intracellular vesicle formation enabled using a 2-dimensional matched filter Obaid Aftab,1 Mårten Fryknäs,1 Xiaonan Zhang,2 Angelo De Milito,2 Ulf Hammerling,1 Stig Linder,2 Rolf Larsson,1 and Mats G Gustafsson1,* Uppsala University; Department of Medical Sciences; Cancer Pharmacology and Computational Medicine; University Hospital; Uppsala, Sweden; 2 Department of Oncology-Pathology; Cancer Center Karolinska; Karolinska Institute; Stockholm, Sweden
Keywords: phase-contrast microscopy, automated microscopy, vesicle detection, autophagy, image processing
Downloaded by [144.76.82.197] at 21:14 26 August 2015
Abbreviations: LFVD, label-free vesicle detector; FMCA, fluorometric microculture cytotoxicity assay; HCS, high-content screening; LOPAC1280, Library of Pharmacologically Active Compounds; PCM, phase-contrast microscopy
Analysis of vesicle formation and degradation is a central issue in autophagy research and microscopy imaging is revolutionizing the study of such dynamic events inside living cells. A limiting factor is the need for labeling techniques that are labor intensive, expensive, and not always completely reliable. To enable label-free analyses we introduced a generic computational algorithm, the label-free vesicle detector (LFVD), which relies on a matched filter designed to identify circular vesicles within cells using only phase-contrast microscopy images. First, the usefulness of the LFVD is illustrated by presenting successful detections of autophagy modulating drugs found by analyzing the human colorectal carcinoma cell line HCT116 exposed to each substance among 1266 pharmacologically active compounds. Some top hits were characterized with respect to their activity as autophagy modulators using independent in vitro labeling of acidic organelles, detection of LC3-II protein, and analysis of the autophagic flux. Selected detection results for 2 additional cell lines (DLD1 and RKO) demonstrate the generality of the method. In a second experiment, label-free monitoring of dose-dependent vesicle formation kinetics is demonstrated by recorded detection of vesicles over time at different drug concentrations. In conclusion, label-free detection and dynamic monitoring of vesicle formation during autophagy is enabled using the LFVD approach introduced.
Introduction Time-lapse microscopy imaging based on various molecular labeling techniques has revolutionized the study of dynamic events taking place inside living cells.1 However, many standard procedures are often too costly and time consuming for highthroughput analyses. One reason is high expenses for antibodies or other molecular labeling reagents, another reason is that many conventional experimental designs in this context involve a need for repeated manual transfer of cell sample fractions to a labeling procedure. The introduction of labeling reagents also imposes a risk for spurious experimental results, due to chemical perturbation of the biological systems under scrutiny. Finally, labelingbased settings may not always be readily available for a particular analysis of interest. Thus, there is an apparent need for label-free alternatives that can offer cost-efficient and fast monitoring and quantification of subcellular events over time. Analyzing microscopic images and videos to extract useful information is becoming an increasingly important activity in many scientific laboratories.2 Time-lapse microscopy imaging
is broadly applied to record living cells over an extended period ranging from days to weeks. Recent advances in this field have made it possible to study various cell processes including apoptosis, cell division, and cell migration. This technique provides an insight into the nature of cellular functions that can help research areas like drug discovery, stem cell research, genomics, and proteomics.3,4 However, as there is a rapid increase in amount of data generated, our ability to fully interpret this information remains limited. Manual analysis of such massive data files can take weeks of tedious work, with considerable risk of losing vital information stored in these images. Therefore, there is a great need for automated systems that can facilitate the analysis of massive biological data, in particular for label-free methods, such as phase-contrast microscopy (PCM) imaging. PCM is an optical-microscopy, contrast-enhancing technique that is used to produce high-contrast images of transparent specimens, such as living cells.5 A subcellular event of particular interest in the context of autophagy is the formation and degradation of different types of vesicles associated with the different steps of the autophagic
*Correspondence to: Mats G Gustafsson; Email:
[email protected] Submitted: 10/01/2012; Revised: 09/30/2013; Accepted: 10/02/2013 http://dx.doi.org/10.4161/auto.26678 www.landesbioscience.com Autophagy 57
©2014 Landes Bioscience. Do not distribute.
1
Downloaded by [144.76.82.197] at 21:14 26 August 2015
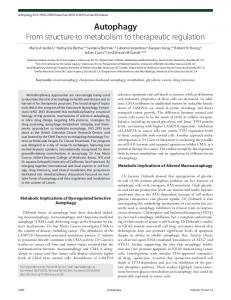
Results Automated microscopy screen Human colorectal carcinoma cell line HCT116 was used to screen the LOPAC1280 chemical library. All drugs were tested at a concentration of 10 µM in complete cell culture medium and imaged each 2nd h over 3 consecutive d, using IncuCyte HD Figure 1. Comparison of images processed with and without using covariance matrix inverse. (A) Image (see Materials and Methods section). displaying HCT116 cells treated with compound 1,10-phenanthroline monohydrate (10 µM) at timepoint Images from each of the drug-treated 48 h. (B) An enlarged image showing vesicle formation which is analyzed through the LFVD using the wells were transferred to a database covariance matrix inverse (C) and without using the covariance matrix inverse (D) at the particular false and a LFVD was then applied to alarm level of 5%. Yellow color shows detections (above threshold) being made in both (C and D). Green screen for drugs capable of induccolor shows detections that are common to (C) and purple color shows detections that are common to (D). In (D) (no covariance matrix inverse), many of the desired detections made in (C) are missing and ing circular vesicles. For the current almost all detections unique to (D), not existing in (C), occur at undesirable locations, typically inside analysis a filter of size 5 × 5 pixels elongated structures that do not seem to correspond to cells. (M = 5) was adopted to match vesicle size. The stabilized covariance process.6-11 Today there is an apparent lack of label-free meth- matrix inverse of the LFVD was calculated by first applying the ods in autophagy research for detection and monitoring of these LFVD on a single control well associated with 36 images of size dynamic processes. For example in the context of drug discov- 1024 × 1280 pixels. This corresponds to approximately 1.3 milery, recent studies have shown different ways of screening for lion windows of size 5 × 5 pixels. The detection threshold level chemical modulators of autophagy but all of them are tied to corresponding to 5% false alarms was determined by applying biomolecular assays.12-14 To enable label-free analyses we intro- the designed detector to wells that contain nontreated growing duced a generic computational algorithm, the label-free vesicle cells (controls). For each such control well, the total number of detector, which relies on matched filter designed to identify cir- detections made in the corresponding movie (consisting of 36 cular vesicles (bubbles, vacuoles) within cells using only PCM images) was recorded. Then the 5% false alarm level was identiimages. In a first experiment, the usefulness of the LFVD for fied as the 95% percentile of the resulting histogram. The LFVD was first applied to test images using settings, detection of autophagy modulating drugs was demonstrated by analyzing the human colorectal carcinoma cell line HCT116 which in separate experiments either included or excluded the when exposed to each substance in the annotated compound stabilized covariance matrix inverse. The performance of the 2 Library of Pharmacologically Active Compounds (LOPAC1280), detectors was compared on the basis of true positive detections which consists of 1266 pharmacologically active compounds. made. Based on visual inspection, the LFVD with the covariance The LFVD was shown to make statistically significant detections matrix inverse selected yielded a detection rate of approximately of compounds that thereby are suggested to induce formation of 75%, while that of LFVD without such post-processing showed circular vesicles. For some of the top hits found, 2 high-content approximately 55%. Figure 1 shows an example of cropped screening (HCS) kits were used in-house to confirm that the images, from HCT116 cell line treated with 1,10-phenanthrovesicles detected are acidic and contain the LC3-II protein well line monohydrate, processed with (C), and without (D) using the known for being present on autophagosomes. Western blotting covariance matrix inverse. Clearly, these images show a higher and the GFP-LC3-HOS cell line was used to detect endogenous number of true positive detections (green color) when the covariLC3 levels. More detailed proofs that these top hits are indeed ance matrix inverse is incorporated in the analysis (C), seemingly
58 Autophagy
Volume 10 Issue 1
©2014 Landes Bioscience. Do not distribute.
modulating the autophagic process can be found in several recently reported studies.15-17 Detection results for 2 additional cell lines (DLD1 and RKO) demonstrated the generality of the method. In a second experiment, label-free monitoring of dose-dependent vesicle formation kinetics was demonstrated for one of the hits (1,10-phenanthroline monohydrate) by recording detection of vesicles over time at different drug concentrations.
www.landesbioscience.com Autophagy 59
©2014 Landes Bioscience. Do not distribute.
Downloaded by [144.76.82.197] at 21:14 26 August 2015
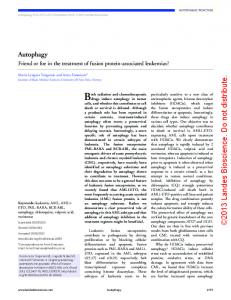
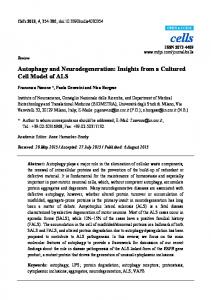
owing to more efficient suppression of background signals. According to the procedure for defining the detection threshold as described above, a compound was assigned to be a hit if, in the sequence of 36 time-lapse microscopy images collected for that particular drug, the total number of detections made was higher than the 5% false alarm threshold employed. A flowchart of the procedure is displayed in Figure 2. Using the covariance matrix inverse, the LFVD made 350 significant detections in a screen of the LOPAC1280 library (1266 drugs) with 63 of them (5% of 1266) expected to be false detections. The 10 top (most significant) hits are summarized in Figure 3. Selecting top hits The top 10 most significant hits from the screening campaign were selected for further analysis using molecular assays. Among the top 5 hits are 1,10-phenanthroline monohydrate, rottlerin, and methotrexate. These 3 have previously been shown to modulate the autophagy process. Treatment with 1,10-phenanthroline monohydrate, a metal chelator, increases autophagy by inducing mitochondrial fragmentation and mitochondrial dysfunctions in a Drp1-dependent manner.16 Rottlerin, a PRKCD/protein kinase C, delta signaling pathway inhibitor, stimulates Figure 2. Flowchart of the automated microscopy-based screen. Drugs were added to HCT116 autophagy by inhibiting MTORC1 signalcells at a final concentration of 10 µM and incubated for 72 h. Phase-contrast images were taken ing.12,15 In osteosarcoma cells methotrexate every 2 h and moved to a database. The LFVD was then applied first on test images first using covariance matrix and then without the covariance matrix. Detection thresholds corresponding to increased mRNA and protein expression 5% false alarms were determined for the two detectors by applying them to control wells. Finally, of HMGB1, a known positive regulator the 2 detectors were compared according to the number of true positive detections made in the of autophagosome maturation and autoremaining wells. phagy.17 The cytotoxic activities of the hit compounds were determined on HCT116 Visualizing the LC3-II protein cells using the fluorometric microculture cytotoxicity assay LC3, a mammalian ortholog of yeast Atg8, appears in 2 (FMCA) and the dose-response curves are presented in Figure 4. Similar results were obtained using another cell viability assay forms: cleaved LC3-I (cytosolic) and subsequently lipidated (AlamarBlue™) and are available in the supplementary material LC3-II (membrane bound), the latter reported as an autophagosomal marker owing to its localization to phagophores and (Fig. S1). autophagosomes. The amount of LC3-II is correlated with the Labeling of acidic organelles Lysosomes and autolysosomes are acidic in nature. In order extent of autophagosome formation.18-22 More generally, LC3-II to determine if the top hits induce an increase in acidic cellular is present in many steps of the autophagic process including the compartments cells were labeled with LysoTracker® Red DND- final autolysosomes.20 Top hits from the screen were further 99 dye (see Materials and Methods section) and imaged by inspected using HCS for presence of the LC3-II protein and means of an ArrayScan® HCS reader (Cellomics). Top 10 hits the results are presented in Figure 6. Chloroquine monohydrate from the screen were analyzed for quantification of LysoTracker and DMSO were used as positive and negative controls, respecdye staining. Wells showing 3-fold or higher increase in staining tively. Cell microcultures were exposed to compounds for 48 h over controls were assigned as hits. This experimental validation, followed by labeling with Celomics® LC3B Detection Kit. The shown in Figure 5, confirmed that all compounds, except chlor- results showed that all the compounds tested have the ability mezanone and SB 224289 Hydrochloride increased the number to induce LC3-II positive vesicles, except chlormezanone and of acidic cellular compartment. ancitabine hydrochloride, which were similar to the control
60 Autophagy
Volume 10 Issue 1
©2014 Landes Bioscience. Do not distribute.
Downloaded by [144.76.82.197] at 21:14 26 August 2015
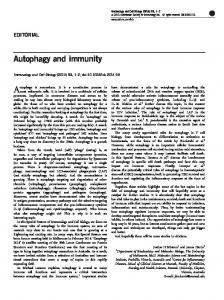
wells where only diffused LC3 staining was observed. In order to show the accuracy of detection and the nature of identified vesicles, LFVD was applied to brightfield images obtained from array scan during LC3-II visualization at 48 h drug exposure (Fig. 7). Notably, the LFVD is designed for analyzing phase-contrast images, which are of high resolution obtained from IncuCyte HD. The images obtained from the ArrayScan reader are bright-field and thus of lower quality. Results showed that 12 out of 15 regions identified as vesicles (80%) in cells treated with 1,10-phenanthroline were positive for LC3-II staining (Fig. 7). Effects of hit compounds on autophagic flux In order to determine the nature of the LC3 accumulation in presence of the hit compounds we used western blot to Figure 4. Dose-response curves for top 10 hit compounds in the colon carcinoma cell line HCT116. detect endogenous LC3 levels. As stated Cells were exposed to drugs for 72 h. For each concentration, the survival index is presented as the earlier, the levels of LC3-II reflect both mean ± SEM (standard error of the mean) from 3 different experiments. synthesis and consumption of the protein through the autophagic pathway (autophagosomes and autolysosomes). The use of lysosomal confirm that 3 out of the 5 strongest hits (1,10-phenanthroline inhibitors like chloroquine contributes to establish more precisely monohydrate, methotrexate, ancitabine) induce a significantly the effects of a treatment on the autophagic flux.23 We treated increased autophagic flux. Overall, these 2 methods indicate that HCT116 cells with the 10 hit compounds for 24 h and CQ (50 the strongest hits identified through the LFVD analysis induce µM) was added during the last 4 h incubation in order to mea- significant accumulation of autophagosomes. sure the autophagic flux. CQ was used at a saturating concentraResults for different cell lines tion (Fig. S2A) and in these conditions it induced full inhibition To illustrate the generality of the proposed LFVD approach, of the autophagic flux similar to that mediated by bafilomycin in addition to our findings in HCT116, the algorithm was also A1 (Fig. S2B) Nutrient starvation was used as positive control by applied to the human cell lines DLD1 and RKO. Thus, images treating cells with EBSS for 4 h. As depicted in Figure 8A, the were recorded for all 3 cell lines, subsequent to exposure to either addition of CQ did induce accumulation of LC3-II in all com- control culture medium or each of 1,10-phenanthroline monohypounds tested, indicating that autophagic flux was detectable in drate, rottlerin, L-703,606 oxalate and ancitabine hydrochloride, all conditions. Interestingly, some compounds (1,10-phenanthro- at 10 µM concentration for 72 h. The LFVD was then applied to line monohydrate, rottlerin, methotrexate, ancitabine, quipazine, images from the entire set of cell lines and treatments. Time point fiduxosine) clearly induced accumulation of LC3-II in absence of 48 h was taken into account for quantification of vesicles and the CQ, suggesting that they also induce autophagosome formation. results shown in Figure 9 confirm that the LFVD approach can Notably, 1,10-phenantroline monohydrate strongly enhanced the be successfully applied to different cell lines for identification of autophagosomes’ content and the autophagic flux as indicated by circular vesicles. a large difference in LC3-II levels in the presence and absence of Dose-dependent kinetics chloroquine (Fig. 8A). To further confirm the role of these comTo demonstrate its potential in the study time-lapse data, pounds as autophagy modulators, we used an additional method LFVD was employed to detect dose-dependent kinetics for one to evaluate autophagic flux using the GFP-LC3-HOS cell line. of the top hits, namely 1,10-phenanthroline monohydrate. We Cells were treated as described above and CQ was added dur- used 3 different concentrations of the drug (2.5 µM, 5 µM, and ing the last 4 h incubation time. After mild saponin extraction, 10 µM), added 24 h after cell seeding. Images were recorded autophagosome-associated LC3 fluorescence was measured by every 2 h for 3 d. As shown in Figure 10, the number of vesflow cytometry (Fig. S2C). The data summarized in Figure 8B icle detections made by the LFVD increased with time and
www.landesbioscience.com Autophagy 61
©2014 Landes Bioscience. Do not distribute.
Downloaded by [144.76.82.197] at 21:14 26 August 2015
Figure 3 (See opposite page). The 10 statistically most significant hits in the LFVD-based screening of the LOPAC1280 compound library, obtained at the false alarm level 5%, in the colon carcinoma cell line HCT116.
©2014 Landes Bioscience. Do not distribute.
Downloaded by [144.76.82.197] at 21:14 26 August 2015
Figure 5. HCT116 cells exposed to top 10 hits for 48 h were labeled with Cellomics® LysoTracker® Red DND-99 dye acquired using the ArrayScan® HCS reader. Images from left to right: nuclear channel, fluorescence channel (LysoTracker staining), composite (merge) channel and an enlarged image from the composite channel. In composite channel blue color represent nucleus and red color represent LysoTracker staining.
62 Autophagy
Volume 10 Issue 1
©2014 Landes Bioscience. Do not distribute.
Downloaded by [144.76.82.197] at 21:14 26 August 2015
Figure 6. HCT116 cells exposed to top 10 hits for 48 h using IC50 concentrations were labeled with Cellomics® LC3B Detection Kits and images were acquired using the ArrayScan® HCS reader. Images from left to right: nuclear channel, fluorescence channel (LC3-II), composite channel and an enlarged image from the composite channel. In composite channel blue color represent nucleus and green color represent LC3-II.
www.landesbioscience.com Autophagy 63
concentration until about 60 h, followed by a declining slope presumably because the cells start to die at a high rate. The 2 insets in Figure 10 show the LC3-II staining for the untreated cells (red) and the cells treated with 10 µM 1,10-phenanthroline monohydrate (green) at 72 h.
Discussion Over the past decade autophagy, currently perceived as including 3 operationally distinct processes—macro-, micro-, and chaperone-mediated autophagy—has become recognized as a key cellular process in the programmed recycling of cytoplasmic components. Especially macroautophagy, involving highly conserved and regulated degradation of intracellular proteins and organelles, is generally seen as being of pivotal importance to cellular survival and integrity.10,21 Moreover, macroautophagy is implicated in multiple disorders, including neurodegeneration, skeletal muscle atrophy, and cancer.10 In the latter area, suppression of autophagy activity in nutrition-starved tumor mass expansions is envisioned as a promising direction, whereas the former disease clusters seem to preferentially need enhancers. The understanding of autophagy interplay and defects under various ailments is, however, still incomplete and disorders thus may involve deregulated autophagy in mutually opposing directions. Already accumulated insight in the autophagy regulation pathways has opened new avenues to pharmacological intervention of the process, including those going beyond direct interference with the MTOR complex, rapamycin being an archetypal example of those directly interfering with MTOR.22 Therefore, access to methods offering label-free detection and monitoring of vesicle formation and degradation would be useful for drug discovery as well basic research related to autophagy.
The present study introduces the first label-free method reported to successfully detect and quantify vesicle formation by using an image processing algorithm applied to PCM images. The results presented demonstrated that this computational approach can be successfully used for detection and monitoring of drug-induced vesicle formation in human cells. Due to the generality of this approach, the same computational procedure should of course also be applicable for detection of monitoring of vesicles induced due to different diseases and disease states. Except for images of electron microscopy, there is no gold standard to unequivocally verify cellular presence of autophagosomes, but multiple assays are recommended to show autophagic response.23 Acidophilic and certain fluorescent dyes are reagents typically used for this purpose. Using these methods, several among the top hits found using the LFVD assay were validated with respect to their potential modulation of the autophagic process. In the current literature, there are several recent reports from independent researchers showing that the top hits analyzed by us are indeed modulating the autophagic process.12,15-17,24 Moreover, we provided biochemical evidence that many of the top hits identified induced accumulation of autophagosomes and/or increased the autophagic flux. In conclusion, although the method we describe is not specific for detection of autophagic vesicles, our data support the use of this assay for preliminary screening of autophagy-modulating agents. Compared with other methods for detection of vesicles, for example autophagosomes, the current approach is automated and does not require any assay reagent. Moreover, it needs little manual input only, thereby rendering it cost and time effective. Furthermore, kinetic measurement over time is enabled, providing another dimension to the measurements. However, the labelfree approach introduced also has some obvious limitations:
64 Autophagy
Volume 10 Issue 1
©2014 Landes Bioscience. Do not distribute.
Downloaded by [144.76.82.197] at 21:14 26 August 2015
Figure 7. HCT116 cells exposed to 1,10-phenanthroline monohydrate (10 µM) and chloroquine (12.5 µM) for 48 h were labeled with Cellomics® LC3B Detection Kits and images were acquired using the ArrayScan® HCS reader. (A) Bright field image obtained from ArrayScan® HCS reader. (B) An enlarged image to show vesicle formation. (C) Image scanned through LFVD where red spots indicate detections been made. (D) Composite channel where blue color represents nucleus and green color represent LC3-II. (E) A Merged LC3/LFVD image showing colocalization between the vesicles detected and the LC3B signal. Red arrow indicates true positive detection, white arrow indicates false negative detection and blue arrow indicates false positive detection.
(1) The modest resolution of the images limits the detection of small vesicles, i.e., those that occupy a few pixels only. (2) The proposed 2-dimensional matched filter (the LFVD) is known to be optimal for detection of a single signal prototype embedded in an additive Gaussian background. Assuming that the statistical structure of the image background cannot be described well by a Gaussian distribution, the matched filters used here are not likely to yield optimal performance. Nonetheless, the filters are indeed taking second order statistics (variances and covariances) of the image background into account. Several inroads to future improvement of the LFVD design are identified: (1) Rather than adjusting the K dimensions to a variance ratio of 1/1000 (standard deviation ratio 1/32), the latter value may be tuned algorithmically, for example using a cross-validation procedure that optimizes the detection performance and/or estimates the true number of significant dimensions. (2) More reliable estimates of the covariance matrix would be obtained by using a larger number of images and/or different covariance matrices for a broader range of image backgrounds. (3) The current design as a single vesicle detector the LFVD has potential for enhancement to encompassing an array of matched filters corresponding to a diverse set of signals of interest (different sizes/scales in this case).25-27 (4) The current use of a linear matched filter is optimal for detection of a single signal prototype embedded in an additive Gaussian background. A further possible improvement would involve design of a detector based on a more general statistical model for the image background, relative to that of a multidimensional normal distribution. However, a well-known problem tied to this approach to enhanced overall resolution is rooted in a considerable uncertainty associated with the required multi-dimensional
density estimate. Another related potential improvement involves the use of detectors for more general (nonGaussian) signals.28,29 A third related potential direction is to design optimal detectors in the time-frequency domain.30
Materials and Methods Cell cultures and seeding Cells from the 3 different cell lines HCT116 (human colon carcinoma), DLD1 (human colorectal adenocarcinoma) and RKO (human rectal carcinoma) were used in the study. Cell culture reagents were purchased from Sigma Aldrich, unless stated otherwise. The cells were grown in McCoy’s 5A medium (M8403) supplemented with 10% heat inactivated fetal calf serum (F6131), 2 mM glutamine (G7513), 100 µg/ml streptomycin and
www.landesbioscience.com Autophagy 65
©2014 Landes Bioscience. Do not distribute.
Downloaded by [144.76.82.197] at 21:14 26 August 2015
Figure 8. Analysis of autophagic flux in compound-treated cells. (A) HCT116 cells were treated at the indicated doses of the 10 hit compounds for 24 h or nutrient-starved with EBSS. CQ (50 µM) was added during the last 4 h of incubation and WB analysis of LC3 expression was performed. (B) GFP-LC3-HOS cells were treated as above and analyzed by flow cytometry to quantify the levels of autophagosome-associated LC3 fluorescence. Data are reported as mean ± standard deviation of 3 independent experiments and * indicates P < 0.05
Figure 10. Dose-dependent kinetics of 1,10-phenanthroline monohydrate from phase-contrast images. The horizontal axis shows time in hours and the horizontal axis represents number of vesicle detections at each time point. Cells with medium only served as control (red). Three concentrations of the drug used, 2.5 µM (black), 5 µM (blue), 10 µM (green). Insets are HCS images for LC3-II staining performed at the 72 h time point for untreated cells (A) and the cells treated with 10 µM 1,10-phenanthroline monohydrate (B).
66 Autophagy
where fsample denotes the fluorescence signal from the well of the sample, f blank denotes the fluorescence signal from the well of the blanks (average) and fcontrol denotes the fluorescence signal from the control wells (average). Image-based screening for detection of circular vesicles HCT116 wild-type cells were seeded at a density of 2500 cells per well using our pipetting robot
Volume 10 Issue 1
©2014 Landes Bioscience. Do not distribute.
Downloaded by [144.76.82.197] at 21:14 26 August 2015
Figure 9. Number of detections made using the cell lines HCT116 (blue), DLD1 (red) and RKO (gray) after 48 h of compound exposure. The 4 compounds 1,10-phenanthroline monohydrate, rottlerin, L-703606 oxalate and ancitabine hydrochloride were used at the concentration 10 µM. Clearly, the number of vesicles detected in the control wells is 4 to 6 times smaller than for these four drugs. For each compound, the number of detections is presented as the mean ± SEM (standard error of the mean) from 3 different experiments.
100 U/ml penicillin (P0781) at 37 °C in humidified air containing 5% CO2. The cells were plated at a density of 6000 cells per well. Compound library The LOPAC1280 library from SigmaAldrich encompasses 1266 compounds distributed over 56 pharmacological classes. The compounds were dissolved in dimethyl sulphoxide (DMSO) (Sigma Aldrich, D5879) and were further diluted with phosphate buffered saline (Sigma Aldrich, D8537), transferred to 384-well microtiter plates (Nunc, 164688) using our Biomek 2000 pipetting station (Beckman Coulter Inc.) and screened at a final concentration of 10 µM. The plates were stored at 70 °C until further use. Assay for determination of survival index After 72 h incubation and imaging, cell survival was measured using the FMCA.31,33 The FMCA measures the cell survival by measuring the fluorescence generated from the hydrolysis of fluorescein diacetate to fluorescein by cells that have plasma membranes intact. The number of living cells is proportional to emitted fluorescence. Cell survival of each experimental well is calculated as the survival index, it is fluorescence measured in experimental wells as a percentage of fluorescence measured in control wells while fluorescence values of blank wells were already subtracted. More formally the survival index S is calculated as
in TBS with 0.1% Tween (TBS-T) for 1 h at room temperature and incubated with anti-LC3 mAb (Cell Signaling Technology, 2775) diluted 1:1000 in 5% BSA in TBS-T overnight at 4 °C. The next day membranes were washed and incubated for 1 h at room temperature with the appropriate HRP-conjugated secondary antibody and the binding was detected by the ECL system. Densitometric analysis of the LC3-II signal was normalized to actin by using Adobe Photoshop. Flow cytometry GFP-LC3-HOS cells are stably transfected with EGFP-LC3expressing vector and were kindly provided by Gerry McInerney (MTC, Karolinska Institute, Stockholm). These cells are used to quantify autophagic flux since saponin extraction of cytosolic EGFP-LC3-I allows quantification of autophagosome-associated EGFP-LC3-II by flow cytometry.32 One-hundred thousand cells/ dish were plated into 20-cm2 dishes and the next day cells were treated with the indicated compounds for 24 h. CQ (50 µM) was added during the last 4 h incubation to block autophagic flux. Cells were trypsinized, washed in PBS and treated with 0.05% saponin in PBS for 10 min at RT. After wash in excess PBS the cells were collected and analyzed by a FACSCalibur instrument (Becton Dickinson) using Cellquest software (Becton Dickinson). GFP fluorescence was collected on at least 10000 cells/sample. The LFVD algorithm for vesicle detection The linear 2-dimensional matched filter: The LFVD is based on a 2-dimensional linear matched filter corresponding to a sliding image region of size M × M pixels and thus M 2 filter coefficients. Expressed in terms of one local image patch, here denoted by the M2 × 1 dimensional column vector x, the matched filter is calculating the optimal test statistic for discrimination between the hypothesis H1: x = s + n of interest from the alternative null hypothesis H0 : x = n. Here s denotes the signal prototype to be detected and n denotes additive normally distributed background noise. Thus, for pixel i the standard matched filter calculates the scalar product y(i) = wTx(i) where w is a M2 × 1 dimensional filter coefficient vector and x(i) is the M2 × 1 dimensional vector representing the M 2 × M2 square of pixels centered around pixel i. The size of the square depends on the size of the vesicle to be detected and ranges in our current applications between 25 pixels (M = 5, 5 × 5 pixels) and 900 pixels (M = 30, 30 × 30 pixels). The filter coefficient vector of the standard linear matched filter is w = C -1s where C is the associated M2 × M2 dimensional covariance matrix for the background and where s is a M 2 × 1 prototype representing the circular object (vesicle) of interest. For the particular results presented in this work in which the vesicles to be detected were relatively small, the value M = 5 was used everywhere. This size was determined simply by looking at a few examples of vesicles formed in treated cells, see Figure 11. The vesicle prototype s: The signal vector s was obtained by first designing a M × M dimensional matrix which then was unfolded into a M2 × 1 dimensional vector s. One example of such a matrix for M = 30 is shown in Figure 11 together with some details about its structure. The MATLAB code used to generate the prototypes is available on request from the authors.
www.landesbioscience.com Autophagy 67
©2014 Landes Bioscience. Do not distribute.
Downloaded by [144.76.82.197] at 21:14 26 August 2015
Precision 2000 (BioTekInstruments Inc.) in 4 drug-prepared 384-well microtiter plates. Three columns without drugs served as controls, and one column with culture medium only served as blank. The plates were incubated and monitored at 37 °C for 72 h in our IncuCyte HD (Essen BioScience Inc.) which is an incubator equipped with a fully automated phase-contrast microscope and Images were taken every 2 h. The microscope has a 20× objective with the ability of imaging high definition and high quality phase-contrast images (1024 × 1280 pixels) that provide morphological information not found with fluorescentonly imaging. In total there were 1458 wells scanned (1266 drug treated and 192 control wells), with each well having 36 time points. A single-filter setting needed approximately 0.47 s to process each image (3 min per 384 wells) using Quad-core Intel® Xeon 5520 (Nehalem 2.26 GHz, 8 MB cache) processor and 3 GB RAM. The analysis was performed on a computing cluster, 4 cores were used in parallel to do the computation for 4 384well plates. Data storage and computations were performed on resources provided through Uppsala Multidisciplinary Centre for Advanced Computational Science (http://www.uppmax.uu.se). Labeling acidic organelles HCT116 cells were plated at a density of 6000 cells per well in a black 96-well plate (Perkin Elmer) and incubated for 24 h. Top hits from the screen were then added and cells were incubated for 48 h. The selection of time interval 48 h was based on the fact that circular vesicles within the cells appear as clearly visible objects around this time point. Wells devoid of chemical modulators were used as negative control. Acidic organelles within the cells were then labeled using LysoTracker® Red DND-99 dye (Invitrogen, L-7528) according to the manufacturer’s instructions. Hoechst 33342 was added to label the nuclei of the cells. Plates were read in ArrayScan® HCS reader (Cellomics). Images were acquired using a 20× objective in the Hoechst 3342 and the fluorescence channels. Assay for quantification of LC3-II protein HCT116 cells were plated at a density of 6000 cells per well in a black 96-well plate (Perkin Elmer, 6005182) and incubated for 24 h. Top hits from the screen were then each added at different concentrations and incubated for 48 h at 37 °C. Subsequent to removal of culture medium cells were fixed and stained according to manufacturer’s instructions (Cellomics® LC3B and Poly-Ubiquitin Detection Kits, 8407801). Plates were read in ArrayScan® High-Content Screening reader (Cellomics). Images were acquired using a 20× objective in the Hoechst 3342 and the fluorescence channels. The spot detector algorithm was used to identify the nuclei, apply a cytoplasmic mask and quantify the fluorescence spots in the fluorescence channel. Western blot HCT116 cells were washed in PBS on ice and collected by scraping. Cells were lysed in RIPA buffer (150 mM NaCl, 50 mM Tris pH 7.4, 1% Nonidet P-40, 0.1% SDS and 0.5% sodium deoxycholate) containing protease and phosphatase inhibitors. The protein concentration was determined by Biorad Protein Assay (Bio-Rad Laboratories, 500-0001) and an equal amount of proteins was loaded on precast acrylamide gels (4–12% SDS-PAGE). Membranes were blocked in 5% dry milk
Estimation of the covariance matrix C: The covariance matrix C was estimated using the conventional unbiased estimator
where
Here N is the number of M × M-dimensional patches used and xn is the pixel vector corresponding to the n:th patch. Robust estimation of the covariance matrix inverse C -1: Since already M = 5 makes the size of the covariance matrix C equal to 25 × 25 and there is usually substantial statistical structure in the image background, estimating this matrix using patches extracted from vesicle free images is expected to result in a singular or nearly singular estimate. To avoid problems with a nonexisting or highly instable inverse C -1 when calculating the matched filter coefficient vector w = C-1s, the inverse was replaced by the matrix
where pk is the eigenvector of C with the k:th largest eigenvalue λk. Thus the filter coefficient vector was calculated as:
(1)
The number of terms K used in (1) was selected to keep the ratio between the smallest and the largest eigenvalues less than 1/1000 (which corresponds to a ratio of 1/32 between the largest and smallest standard deviations). The chosen ratio 1/1000 was the result of our first trial and turned out to yield useful results. Thus, there might be room for improved results if this user-defined parameter is optimized according to some performance criterion of interest but this is beyond the current scope. Implementation: The resulting 2-dimensional matched filter was implemented in Matlab 7.12(R2011a) using the built-in function filter2 using default settings. Detection across cell lines Cells from the 3 different cell lines HCT116 (human colon carcinoma), DLD1 (human colorectal adenocarcinoma) and RKO (human rectal carcinoma) were plated at a density of 6000 cells per well in a 96-well plate (Nunc). Cells were exposed to 1,10-phenanthroline monohydrate, rottlerin, L-703,606 oxalate and ancitabine hydrochloride at a final concentration of 10 µM. Cells were incubated for 3 d and images were recorded every 2 h. There were 3 replicates for each treatment and each replicate well had 4 fields. Vesicles detected per image are equal to the total number of vesicles present within all the cells in an image. The total count of vesicles per well was determined by taking an average of detections made within all four fields in order to compensate cell number variation between fields. Comparison between cell lines was based only on the number of detections made at one time point (48 h). Dose-dependent kinetics HCT116 cells were plated at a density of 6000 cells per well. Three different concentrations of the compound 1,10-phenanthroline monohydrate were used (2.5, 5, and 10 µM). The compound was added 24 h after cell seeding and images were recorded every 2 h for 3 d. There were 12 replicates for each concentration and 4 fields within a well making a total count of 48 images per treatment. Vesicle count per well was the average of vesicle’s detected within all fields. Filter of size M = 5 was
68 Autophagy
Volume 10 Issue 1
©2014 Landes Bioscience. Do not distribute.
Downloaded by [144.76.82.197] at 21:14 26 August 2015
Figure 11. Designing vesicle prototypes. (A) Image displaying vesicle formation in HCT116 cell line treated with 1,10-phenanthroline monohydrate. (B) Illustration of one vesicle prototype in the form of a MxM dimensional matrix for M = 30. Thus the prototype consists of a circular center consisting of high intensity pixel values (white) surrounded by a relatively thin ring of low intensity pixels (black) which in turn are surrounded by an area of midintensity pixel values (gray). (C) Illustration of the matched filter corresponding to the vesicle prototype shown in (B) when employing a robust estimate of the covariance matrix inverse.
selected for detection of the vesicles. After 72 h of incubation culture medium was removed and cells were fixed and stained according to manufacturer’s instructions (Cellomics® LC3B and Poly-Ubiquitin Detection Kits). Plates were read in ArrayScan® HCS reader (Cellomics). Disclosure of Potential Conflicts of Interest
Acknowledgment
This work was supported by the Higher Education Commission of Pakistan (OA), by the SSF framework project “Tools for diagnosis and drug discovery in cancer” (MF). ADM is supported by a grant from the Association for International Cancer Research. We thank the anonymous reviewers for their valuable suggestions for improvements to the paper.
No potential conflicts of interest were disclosed.
Supplemental Materials
Downloaded by [144.76.82.197] at 21:14 26 August 2015
References 1. Muzzey D, van Oudenaarden A. Quantitative time-lapse fluorescence microscopy in single cells. Annu Rev Cell Dev Biol 2009; 25:301-27; PMID:19575655; http://dx.doi.org/10.1146/ annurev.cellbio.042308.113408 2. Li K, Miller ED, Chen M, Kanade T, Weiss LE, Campbell PG. Cell population tracking and lineage construction with spatiotemporal context. Med Image Anal 2008; 12:546-66; PMID:18656418; http://dx.doi.org/10.1016/j.media.2008.06.001 3. Al-Kofahi O, Radke RJ, Goderie SK, Shen Q, Temple S, Roysam B. Automated cell lineage construction: a rapid method to analyze clonal development established with murine neural progenitor cells. Cell Cycle 2006; 5:327-35; PMID:16434878; http://dx.doi. org/10.4161/cc.5.3.2426 4. Bao Z, Murray JI, Boyle T, Ooi SL, Sandel MJ, Waterston RH. Automated cell lineage tracing in Caenorhabditis elegans. Proc Natl Acad Sci U S A 2006; 103:2707-12; PMID:16477039; http://dx.doi. org/10.1073/pnas.0511111103 5. Murphy D. Phase contrast microscopy, Fundamentals of Light Microscopy and Electronic Imaging. WileyLiss 2001; 97-112. 6. Rubinsztein DC, Codogno P, Levine B. Autophagy modulation as a potential therapeutic target for diverse diseases. Nat Rev Drug Discov 2012; 11:70930; PMID:22935804; http://dx.doi.org/10.1038/ nrd3802 7. Mizushima N. Autophagy: process and function. Genes Dev 2007; 21:2861-73; PMID:18006683; http://dx.doi.org/10.1101/gad.1599207 8. Klionsky DJ, Emr SD. Autophagy as a regulated pathway of cellular degradation. Science 2000; 290:171721; PMID:11099404; http://dx.doi.org/10.1126/ science.290.5497.1717 9. Gozuacik D, Kimchi A. Autophagy and cell death. Curr Top Dev Biol 2007; 78:217-45; PMID:17338918; http://dx.doi.org/10.1016/ S0070-2153(06)78006-1 10. Mizushima N, Komatsu M. Autophagy: renovation of cells and tissues. Cell 2011; 147:728-41; PMID:22078875; http://dx.doi.org/10.1016/j. cell.2011.10.026 11. Klionsky DJ, Emr SD. Autophagy as a regulated pathway of cellular degradation. Science 2000; 290:171721; PMID:11099404; http://dx.doi.org/10.1126/ science.290.5497.1717 12. Balgi AD, Fonseca BD, Donohue E, Tsang TC, Lajoie P, Proud CG, Nabi IR, Roberge M. Screen for chemical modulators of autophagy reveals novel therapeutic inhibitors of mTORC1 signaling. PLoS One 2009; 4:e7124; PMID:19771169; http://dx.doi. org/10.1371/journal.pone.0007124
13. Zhang L, Yu J, Pan H, Hu P, Hao Y, Cai W, Zhu H, Yu AD, Xie X, Ma D, et al. Small molecule regulators of autophagy identified by an image-based high-throughput screen. Proc Natl Acad Sci U S A 2007; 104:19023-8; PMID:18024584; http://dx.doi. org/10.1073/pnas.0709695104 14. Shu CW, Madiraju C, Zhai D, Welsh K, Diaz P, Sergienko E, Sano R, Reed JC. High-throughput fluorescence assay for small-molecule inhibitors of autophagins/Atg4. J Biomol Screen 2011; 16:174-82; PMID:21245471; http://dx.doi. org/10.1177/1087057110392996 15. Singh BN, Kumar D, Shankar S, Srivastava RK. Rottlerin induces autophagy which leads to apoptotic cell death through inhibition of PI3K/Akt/ mTOR pathway in human pancreatic cancer stem cells. Biochem Pharmacol 2012; 84:1154-63; PMID:22902833; http://dx.doi.org/10.1016/j. bcp.2012.08.007 16. Park SJ, Shin JH, Kim ES, Jo YK, Kim JH, Hwang JJ, Kim JC, Cho DH. Mitochondrial fragmentation caused by phenanthroline promotes mitophagy. FEBS Lett 2012; 586:4303-10; PMID:23123158; http:// dx.doi.org/10.1016/j.febslet.2012.10.035 17. Huang J, Liu K, Yu Y, Xie M, Kang R, Vernon P, Cao L, Tang D, Ni J. Targeting HMGB1-mediated autophagy as a novel therapeutic strategy for osteosarcoma. Autophagy 2012; 8:275-7; PMID:22301993; http://dx.doi.org/10.4161/auto.8.2.18940 18. Pankiv S, Clausen TH, Lamark T, Brech A, Bruun JA, Outzen H, Øvervatn A, Bjørkøy G, Johansen T. p62/SQSTM1 binds directly to Atg8/LC3 to facilitate degradation of ubiquitinated protein aggregates by autophagy. J Biol Chem 2007; 282:24131-45; PMID:17580304; http://dx.doi.org/10.1074/jbc. M702824200 19. Kabeya Y, Mizushima N, Ueno T, Yamamoto A, Kirisako T, Noda T, Kominami E, Ohsumi Y, Yoshimori T. LC3, a mammalian homologue of yeast Apg8p, is localized in autophagosome membranes after processing. EMBO J 2000; 19:57208; PMID:11060023; http://dx.doi.org/10.1093/ emboj/19.21.5720 20. Tanida I, Ueno T, Kominami E. LC3 conjugation system in mammalian autophagy. Int J Biochem Cell Biol 2004; 36:2503-18; PMID:15325588; http:// dx.doi.org/10.1016/j.biocel.2004.05.009 21. Shen HM, Codogno P. Autophagy is a survival force via suppression of necrotic cell death. Exp Cell Res 2012; 318:1304-8; PMID:22366289; http://dx.doi. org/10.1016/j.yexcr.2012.02.006 22. Fleming A, Noda T, Yoshimori T, Rubinsztein DC. Chemical modulators of autophagy as biological probes and potential therapeutics. Nat Chem Biol 2011; 7:9-17; PMID:21164513; http://dx.doi. org/10.1038/nchembio.500
23. Klionsky DJ, Abdalla FC, Abeliovich H, Abraham RT, Acevedo-Arozena A, Adeli K, Agholme L, Agnello M, Agostinis P, Aguirre-Ghiso JA, et al. Guidelines for the use and interpretation of assays for monitoring autophagy. Autophagy 2012; 8:445544; PMID:22966490; http://dx.doi.org/10.4161/ auto.19496 24. Xia X, Kar R, Gluhak-Heinrich J, Yao W, Lane NE, Bonewald LF, Biswas SK, Lo WK, Jiang JX. Glucocorticoid-induced autophagy in osteocytes. J Bone Miner Res 2010; 25:2479-88; PMID:20564240; http://dx.doi.org/10.1002/ jbmr.160 25. Gustafsson MG. Detection of Spatio-Temporal Ultrasonic Transient Families Using Filter Banks and Neural Nets. Springer Verlag ICANN98 1998; 227-32 26. Asraf DE, Gustafsson MG. Optimal detection of crack echo families in elastic solids. J Acoust Soc Am 2003; 113:2732-41; PMID:12765391; http://dx.doi. org/10.1121/1.1566976 27. Li Q, You J, Zhang D. Vessel segmentation and width estimation in retinal images using multiscale production of matched filter responses. Expert Syst Appl 2012; 39:7600-10; http://dx.doi.org/10.1016/j. eswa.2011.12.046 28. Garth LM, Poor HV. Detection of Non-Gaussian Signals: A Paradigm for Modern Signal Processing. Proc IEEE 1994; 82:1061-95; http://dx.doi. org/10.1109/5.293163 29. Fraza MM, Remagninoa P, Hoppea A, Uyyanonvarab B, Rudnickac AR, Owenc CG, Barmana SA. Blood vessel segmentation methodologies in retinal images-a survey. Comput Methods Programs Biomed 2012; PMID:22525589; http://dx.doi.org/10.1016/j. cmpb.2012.03.009 30. O’Toole JM, Meshba M, Boashash B. Accurate and efficient implementation of the time-frequency matched filter. IET Signal Processing 2010; 4:42837; http://dx.doi.org/10.1049/iet-spr.2009.0104 31. Lindhagen E, Nygren P, Larsson R. The fluorometric microculture cytotoxicity assay. Nat Protoc 2008; 3:1364-9; PMID:18714304; http://dx.doi. org/10.1038/nprot.2008.114 32. Eng KE, Panas MD, Karlsson Hedestam GB, McInerney GM. A novel quantitative flow cytometrybased assay for autophagy. Autophagy 2010; 6:63441; PMID:20458170; http://dx.doi.org/10.4161/ auto.6.5.12112 33. Larsson R, Kristensen J, Sandberg C, Nygren P. Laboratory determination of chemotherapeutic drug resistance in tumor cells from patients with leukemia, using a fluorometric microculture cytotoxicity assay (FMCA). Int J Cancer 1992; 50:17785; PMID:1730510; http://dx.doi.org/10.1002/ ijc.2910500204
www.landesbioscience.com Autophagy 69
©2014 Landes Bioscience. Do not distribute.
Supplemental materials may be found here: www.landesbioscience.com/journals/autophagy/article/26678