avalanche size distribution for the three dimensional Toom interface. ... DLSS found, among others, that the continuum ... for spatial derivative along the direction parallel (perpendicular) to the avalanche ... For ds = 2, it is the checkerboard lattice, square lattice rotated by 45 degrees. ... original Toom interface is assigned.
arXiv:cond-mat/9309034v1 22 Sep 1993
Avalanche Size Distribution in the Toom Interface H. Jeong† , B. Kahng‡ , and D. Kim†
†Center for Theoretical Physics and Department of Physics, Seoul National University, Seoul 151-742, Korea ‡Department of Physics, Kon-Kuk University, Seoul 133-701, Korea
Abstract We present numerical data of the height-height correlation function and of the avalanche size distribution for the three dimensional Toom interface. The heightheight correlation function behaves samely as the interfacial fluctuation width, which diverges logarithmically with space and time for both unbiased and biased cases. The avalanche size defined by the number of changing sites caused by a single noise process, exhibits an exponentially decaying distribution, which is in contrast to power-law distributions appearing in typical self-organized critical phenomena. We also generalize the Toom model into arbitrary dimensions.
PACS numbers: 68.35.Fx, 05.40.+j, 64.60.Ht
1
The Toom model [1] is a dynamical model of Ising spins in which the condition of detailed balance is not satisfied and hence whose phases are not described by equilibrium Gibbs ensembles. Recently, Derrida, Lebowitz, Speer and Spohn (DLSS) [2] studied physical properties of interfaces formed in the two-dimensional Toom model. In low-noise limit, this model leads to a (1 + 1) dimensional solidon-solid-type (SOS) model, which is in turn much simpler for understanding generic nature of dynamics. In the SOS model, the dynamics of spin-flips may be regarded as a deposition-evaporation process of particles. Due to the nature of the Toom dynamics, the deposition-evaporation process occurs in an avalanche fashion with preferred direction. DLSS found, among others, that the continuum stochastic equation describing such SOS model is the well-known Kardar-ParisiZhang (KPZ) equation [3]. In reference [4], present authors proposed a natural generalization of the model in three dimension on the body centered cubic lattice and found that the continuum equation is the anisotropic KPZ (AKPZ) equation given by 1 1 ∂t h = νk ∂k 2 h + ν⊥ ∂⊥ 2 h + λk (∂k h)2 + λ⊥ (∂⊥ h)2 + η 2 2
(1)
with opposite signs of the coefficients λk and λ⊥ . In Eq. (1), h is the height of the fluctuating surface with respect to a reference (co-moving) plane, ∂k (∂⊥ ) stands for spatial derivative along the direction parallel (perpendicular) to the avalanche direction, and η is the white noise. AKPZ equation with opposite signs of ∂k and ∂⊥ is known to renormalize toward the weak coupling limit [5] and consequently, square of the width, w 2 , of the Toom interface shows logarithmic dependence both in space and time. This is in contrast to the model studied by Barab´asi, Araujo, and Stanley [6] which again is described by Eq. (1) but belongs to the strong coupling regime of the AKPZ universality.
2
In this work, we present numerical data of the height-height correlation function and of the avalanche size distribution for the three dimensional Toom interface. The height-height correlation function shows the same logarithmic dependences both on space and time as in w 2 . The avalanche size distribution is found to be exponential. This is in contrast to power law behaviors appearing in typical self-organized critical phenomena and indirectly substantiate the validity of the collective variable approximation used by DLSS.
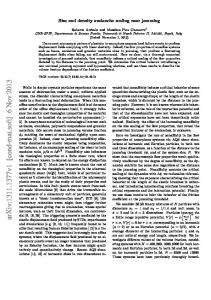
The d-dimensional Toom model we introduced in [4] and generalized here consists of Ising spins (σ(x1 , x2 , · · · , xd ) = ±1) on d-dimensional body-centered-cubic lattice. The spin coordinates xi takes the values in Z for the spins on one sublattice and Z+ 12 for those on the other sublattice. At each time step, a randomly selected spin is updated according to the local rule that it becomes, at the next time step, equal to the majority of itself and of its 2d−1 neighbors relatively situated at (− 12 , ± 12 , ± 12 , · · · , ± 21 ) with probability 1 − p − q, to +1 with probability p, and to −1 with probability q. The referencing neighbors are shown in Fig. 1 for d = 3. Unbiased (biased) dynamics results when p = q (p 6= q). To produce stationary interface at zero noise, the boundary spins on the three surfaces defined by x1 = 0, x2 = 0 and x2 = L, respectively, need to be fixed to the value +1 (−1) if x2 > ( 0 and λ⊥ < 0 by applying the tilt argument [11]. Consequently, the model belongs to the weak-coupling regime of the AKPZ universality. Therefore, both the square of the surface width and the height-height correlation function are logarithmic for both unbiased and biased cases.
To check correspondences between the low noise Toom model and the SOS model, we performed numerical simulations for both models. Results for both cases run on small sizes are in complete agreement with each other in low-noise limit. Accordingly, we performed simulations intensively for larger systems using the SOS model. The simulations are done in the range of system size L = 20 ∼ 140 for both unbiased (¯ p = 0.5) and biased (¯ p 6= 0.5) cases. We measured the surface width w 2 and the height-height correlation functions Ck (rk , t) and C⊥ (r⊥ , t), defined by Ck (rk , t) = h[h(rk , t) − h(0, 0)]2 i,
and
C⊥ (r⊥ , t) = h[h(r⊥ , t) − h(0, 0)]2 i, (2)
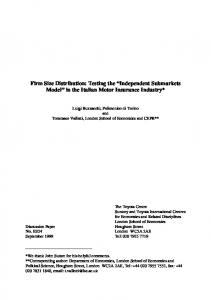
respectively. Here, rk (r⊥ ) denotes the spatial separation along the direction parallel (perpendicular) to the avalanche direction. From the theoretical considerations, we expect the height-height correlation functions diverges as ∼ ln t 5
before saturation, and ∼ ln r after saturation. Typical data of Ck (r) and C⊥ (r) after saturation are shown in Fig. 2 for the case of unbiased dynamics (¯ p = 0.5) and in Fig. 3 for the case of biased one (¯ p = 0.3). Each curve is for system sizes L = 40, 60, 80, 100, and 120, respectively, from bottom to top and is averaged over 300 configurations. It confirms clearly the logarithmic dependence on r. Deviation from straight line for large r is the finite size effect.
Next, we examined the avalanche size distribution n(s). The avalanche size s is defined as the number of successive spin flips by a single noise process. n(s) was measured in two different manners. In the first case, it is measured in the critical state (after saturation), while in the second case, it is measured during the whole time steps. In both cases, the distribution function n(s) is found to be exponential, n(s) ∼ exp(−s/s∗ ) as shown in Figs. 4 and 5. The characteristic size s∗ determined from the slopes of the inset figures is found to be independent of p¯ and of the way n(s) is measured. It takes the value s∗ = 1.11 ± 0.01.
In conclusion, we have generalized the Toom model into d dimensions and defined its associated SOS-type model. Also we have presented numerical data for the height-height correlation functions in perpendicular and parallel directions, respectively, for unbiased and biased cases for d = 3. We have found that for the unbiased case, the interface is described by the EW equation, and for the biased case, it is described by the AKPZ equation with the opposite signs of λk and λ⊥ . Consequently, the height-height correlation functions diverge logarithmically with space and time. The avalanche size distribution has also been examined, which exhibits an exponential distribution for unbiased and biased cases instead of a power-law distribution.
6
We would like to thank Dr. Jin Min Kim for helpful discussions. This work was supported in part by the Korea Science and Engineering Foundation through the SRC program of SNU-CTP and through CTSP in Korea Univ, and in part by the Ministry of Education, Korea.
References [1] A.L. Toom, in Multicomponent Random Systems, edited by R.L. Dobrushin and Ya.G. Sinai (Marcel Dekker, New York, 1980). [2] B. Derrida, J.L. Lebowitz, E.R. Speer and H. Spohn, Phys. Rev. Lett. 67, 165 (1991); J. Phys. A 24, 4805 (1991). [3] M. Kardar, G. Parisi and Y. Zhang, Phys. Rev. Lett. 56, 889 (1986). [4] H. Jeong, B. Kahng, and D. Kim, Phys. Rev. Lett. 71, 747 (1993). [5] D.E. Wolf, Phys. Rev. Lett. 67, 1783 (1991); J. Villain, J. de Physique I 1, 19 (1991). [6] A.-L. Barab´asi, M. Araujo, and H.E. Stanley, Phys. Rev. Lett. 68, 3729 (1992). [7] B.M. Forrest and L.-H. Tang, Phys. Rev. Lett. 64, 1405 (1990). [8] M. Plischke, Z. R´acz, and D. Liu, Phys. Rev. B 35, 3485 (1987). [9] P. Devillard and H. Spohn, J. Stat. Phys. 66, 1089 (1992).
7
[10] S.F. Edwards and D.R. Wilkinson, Proc. R. Soc. Lond. A 381 17 (1982). [11] J.M. Kim (private communication).
8
Figure Captions Fig. 1 The three dimensional Toom rule on bcc lattice used in this work. The black circled spin in the center is updated with the majority rule of itself and four nearest neighbor spins (the black circled) with probability 1−p−q, and becomes equal to +1 (−1) with probability p (q). In the low-noise limit, p, q → 0. Fig. 2 The height-height correlation functions Ck (r) (dotted line) and C⊥ (r) (solid line) versus ln r for unbiased case, after saturation. Each curve is for system sizes L = 40, 60, 80, 100 and 120, respectively, from bottom to top, and is averaged over 300 configurations. Fig. 3 Same as in Fig. 2 for biased case, p¯ = 0.3. Fig. 4 The avalanche size distribution n(s) versus s for unbiased case measured during whole time steps (a) and after saturation (b). The data are obtained from different system size, but they are collapsed into each other, implying that n(s) is independent of system size. Insets show ln n(s) versus s. Fig. 5 Same as in Fig. 4 for biased case, p¯ = 0.3.
9
2 1 3